Equitable Growth’s Jobs Day Graphs: June 2021 Report Edition
On July 2, the U.S. Bureau of Labor Statistics released new data on the U.S. labor market during the month of June. Below are five graphs compiled by Equitable Growth staff highlighting important trends in the data.
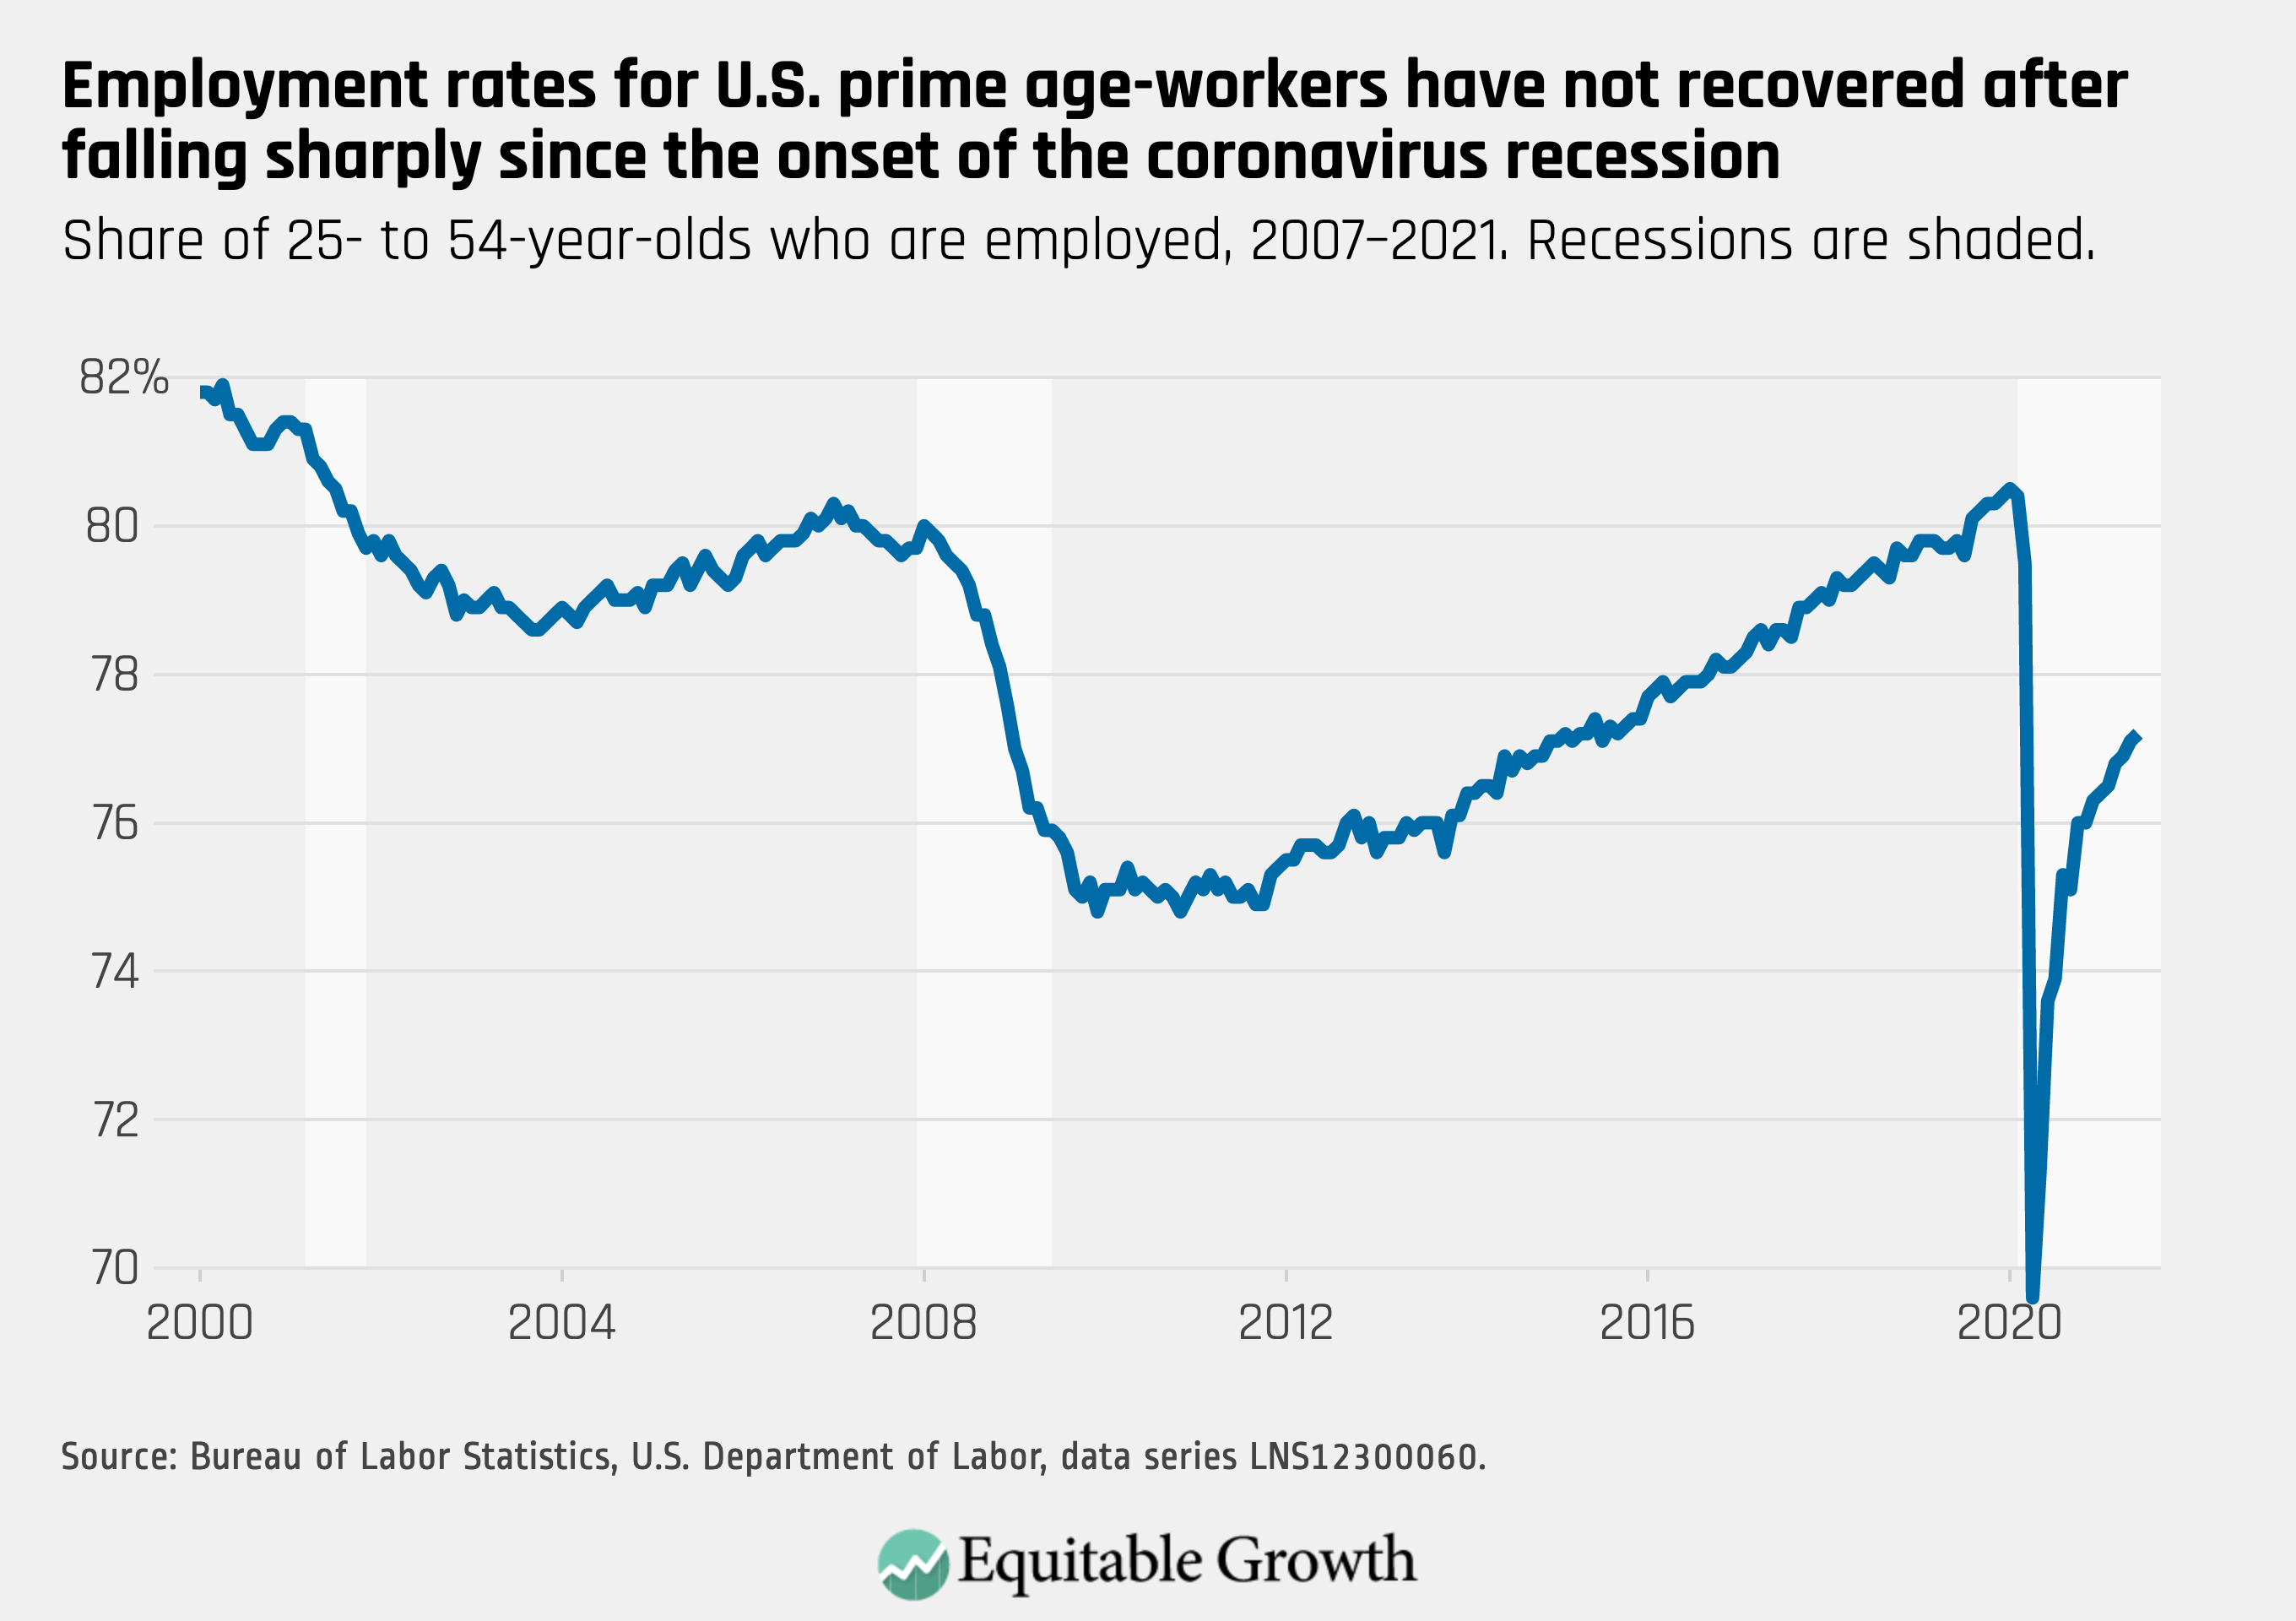
The prime-age employment-to-population ratio remained steady in June, while the labor market added 850,000 jobs.
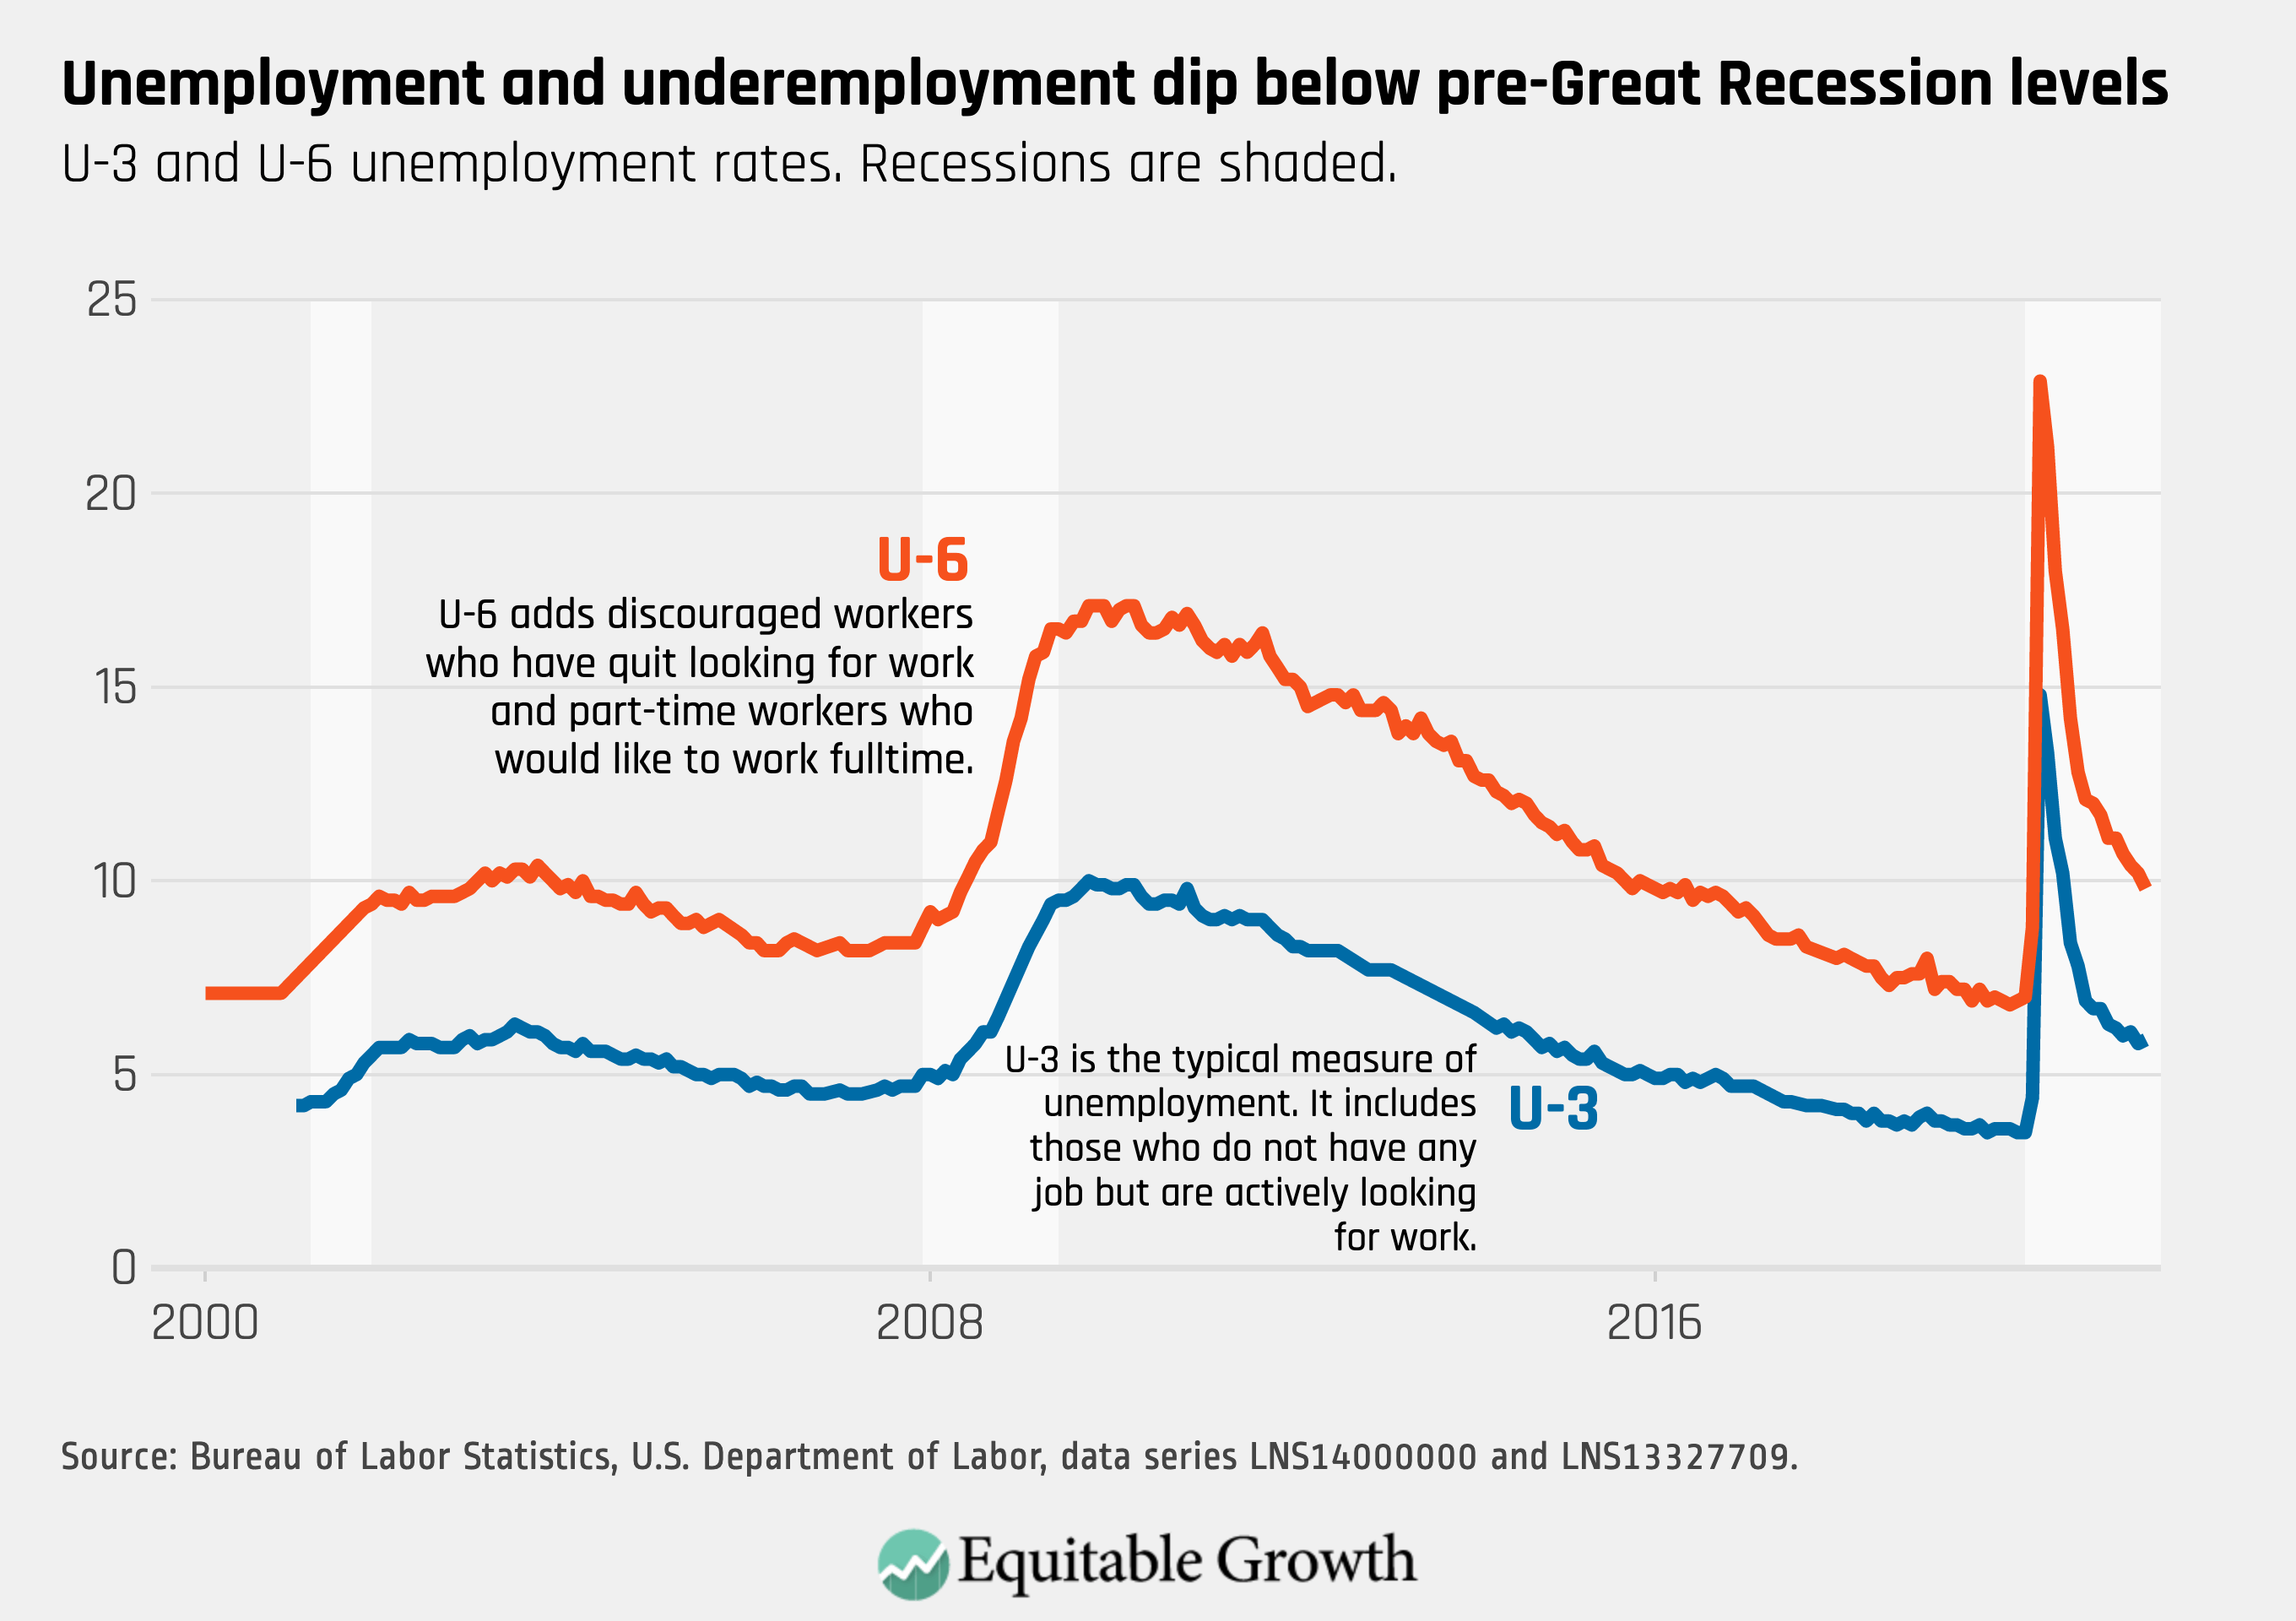
Top-line unemployment, also known as U-3, and a broader measure of labor underutilization, known as U-6, remain low in June, falling below their levels prior to the Great Recession.
Unemployment rates by race and ethnicity saw little change and remain highest for Black workers at 9.2 percent and Latinx workers at 7.4 percent.

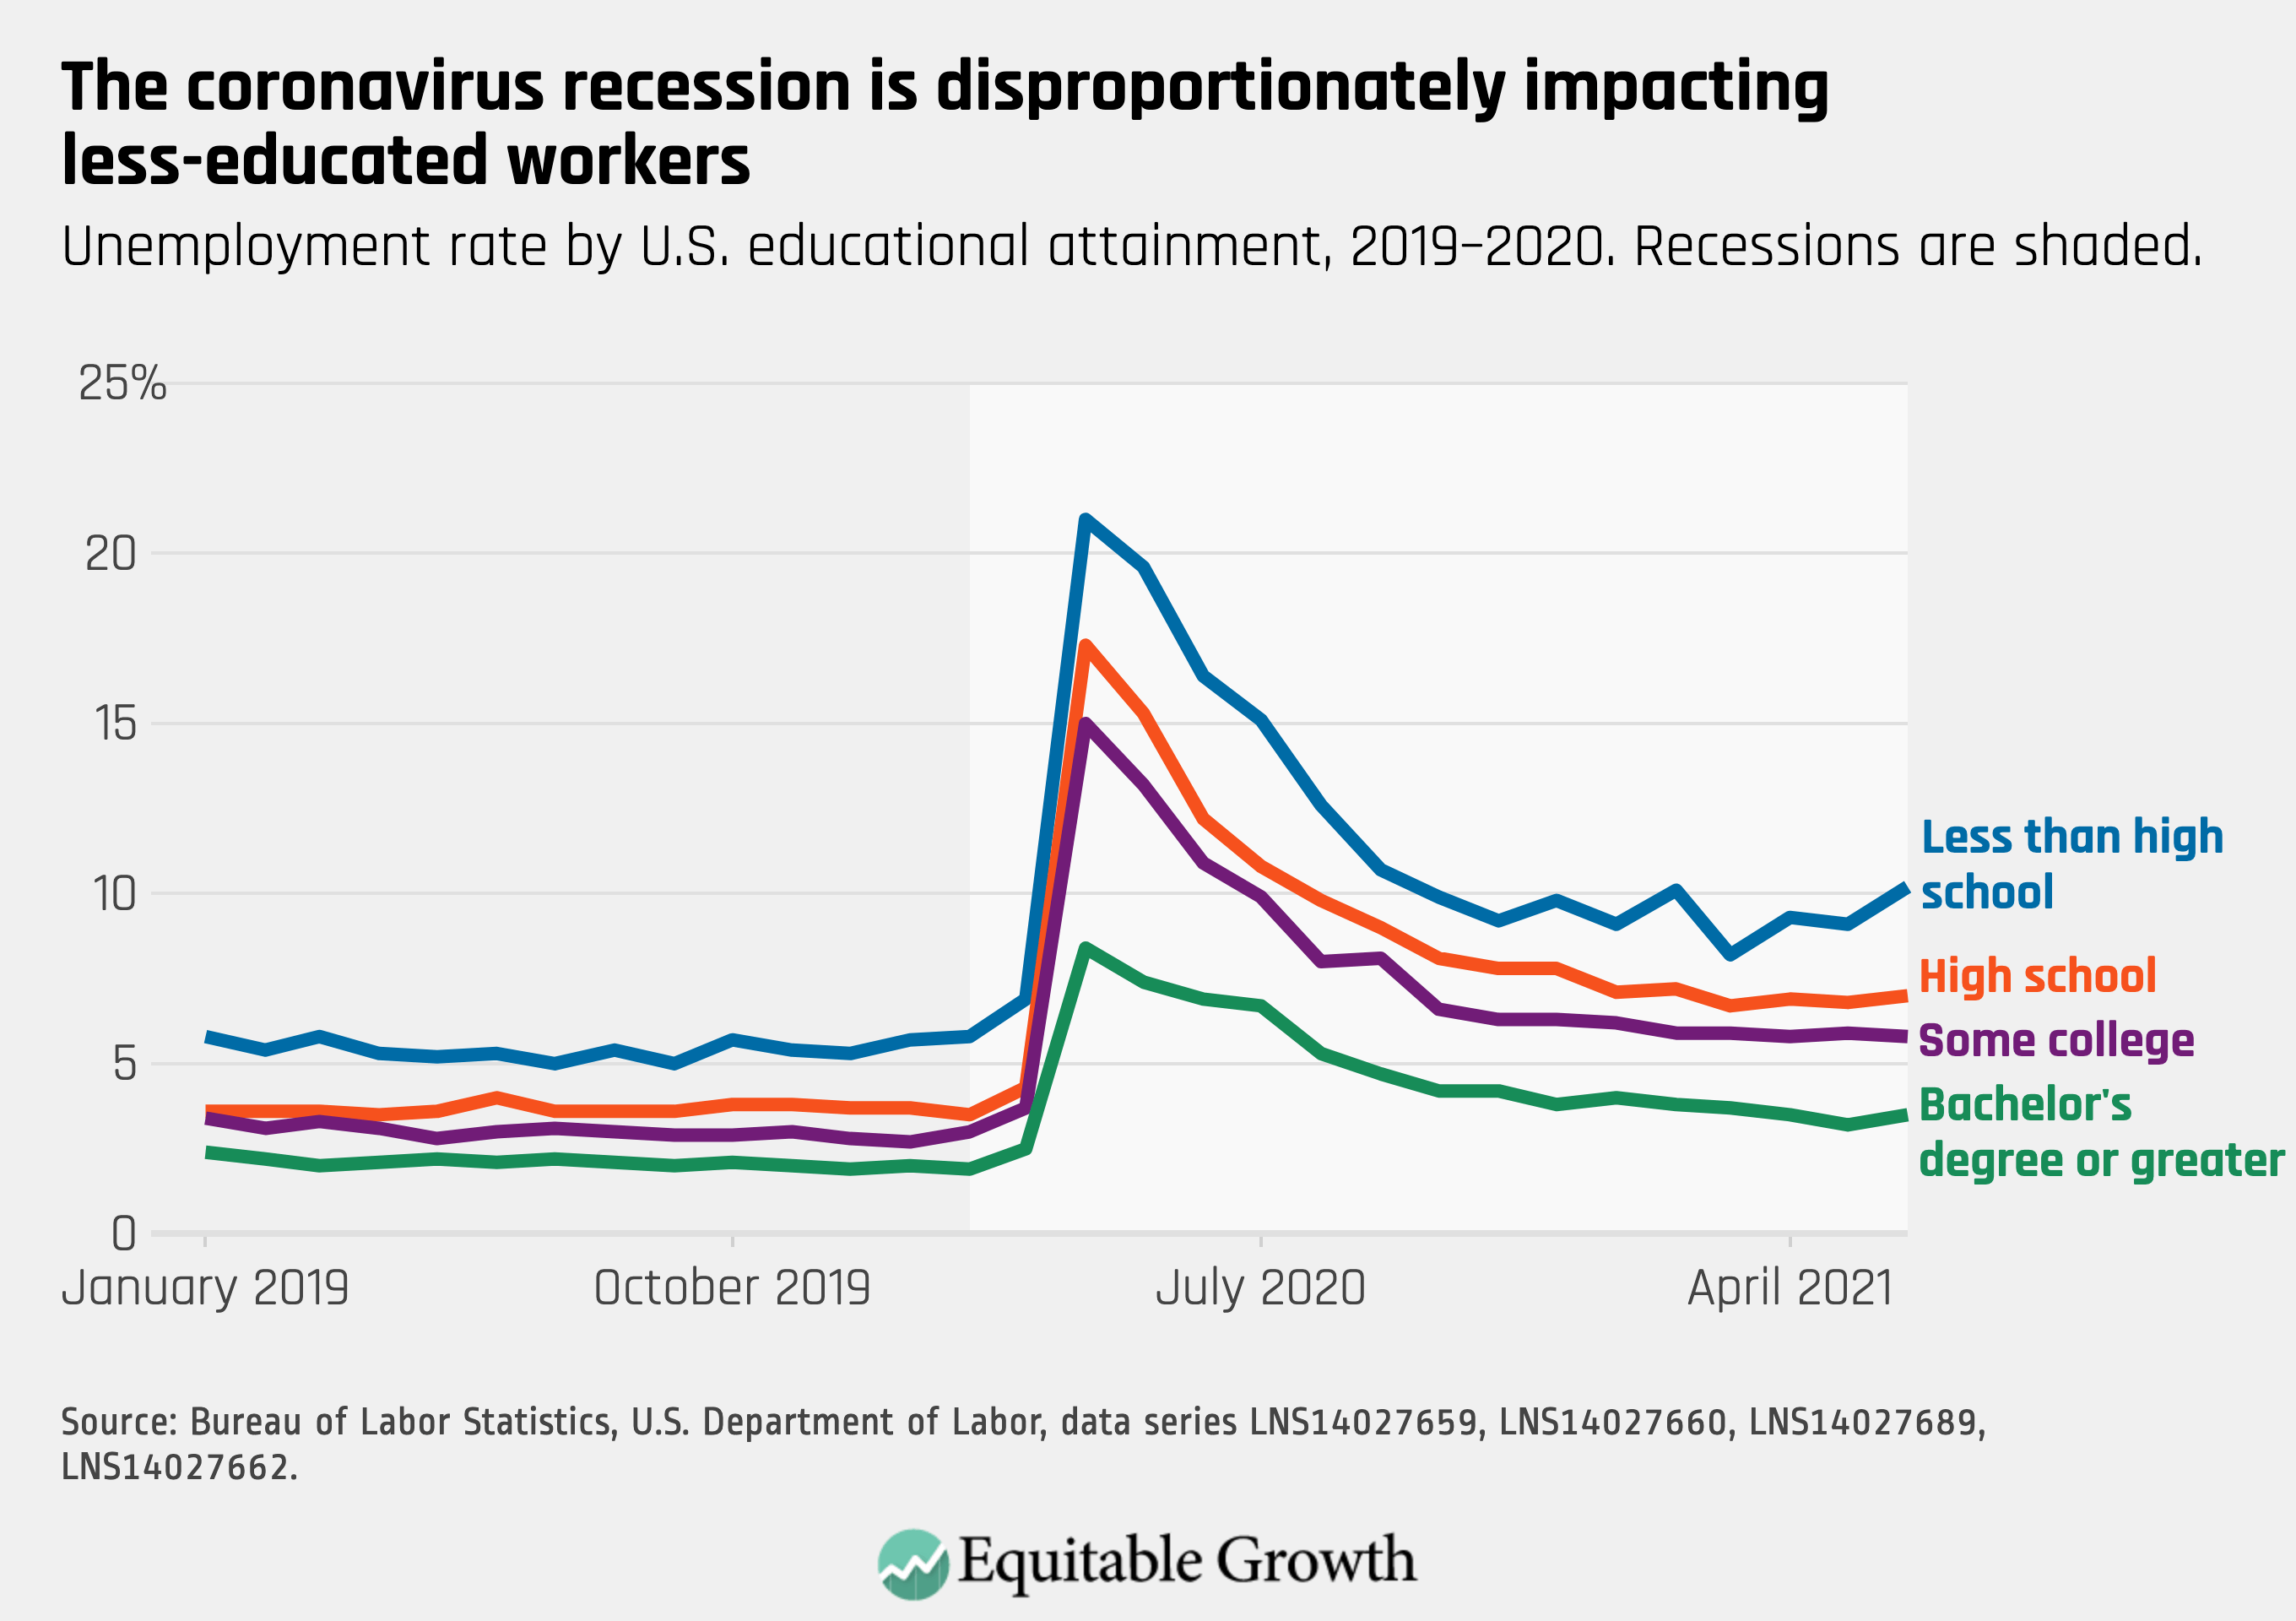
The unemployment rate remains highest for workers with less education and increased slightly to 10.2 percent for workers with less than a high school degree.
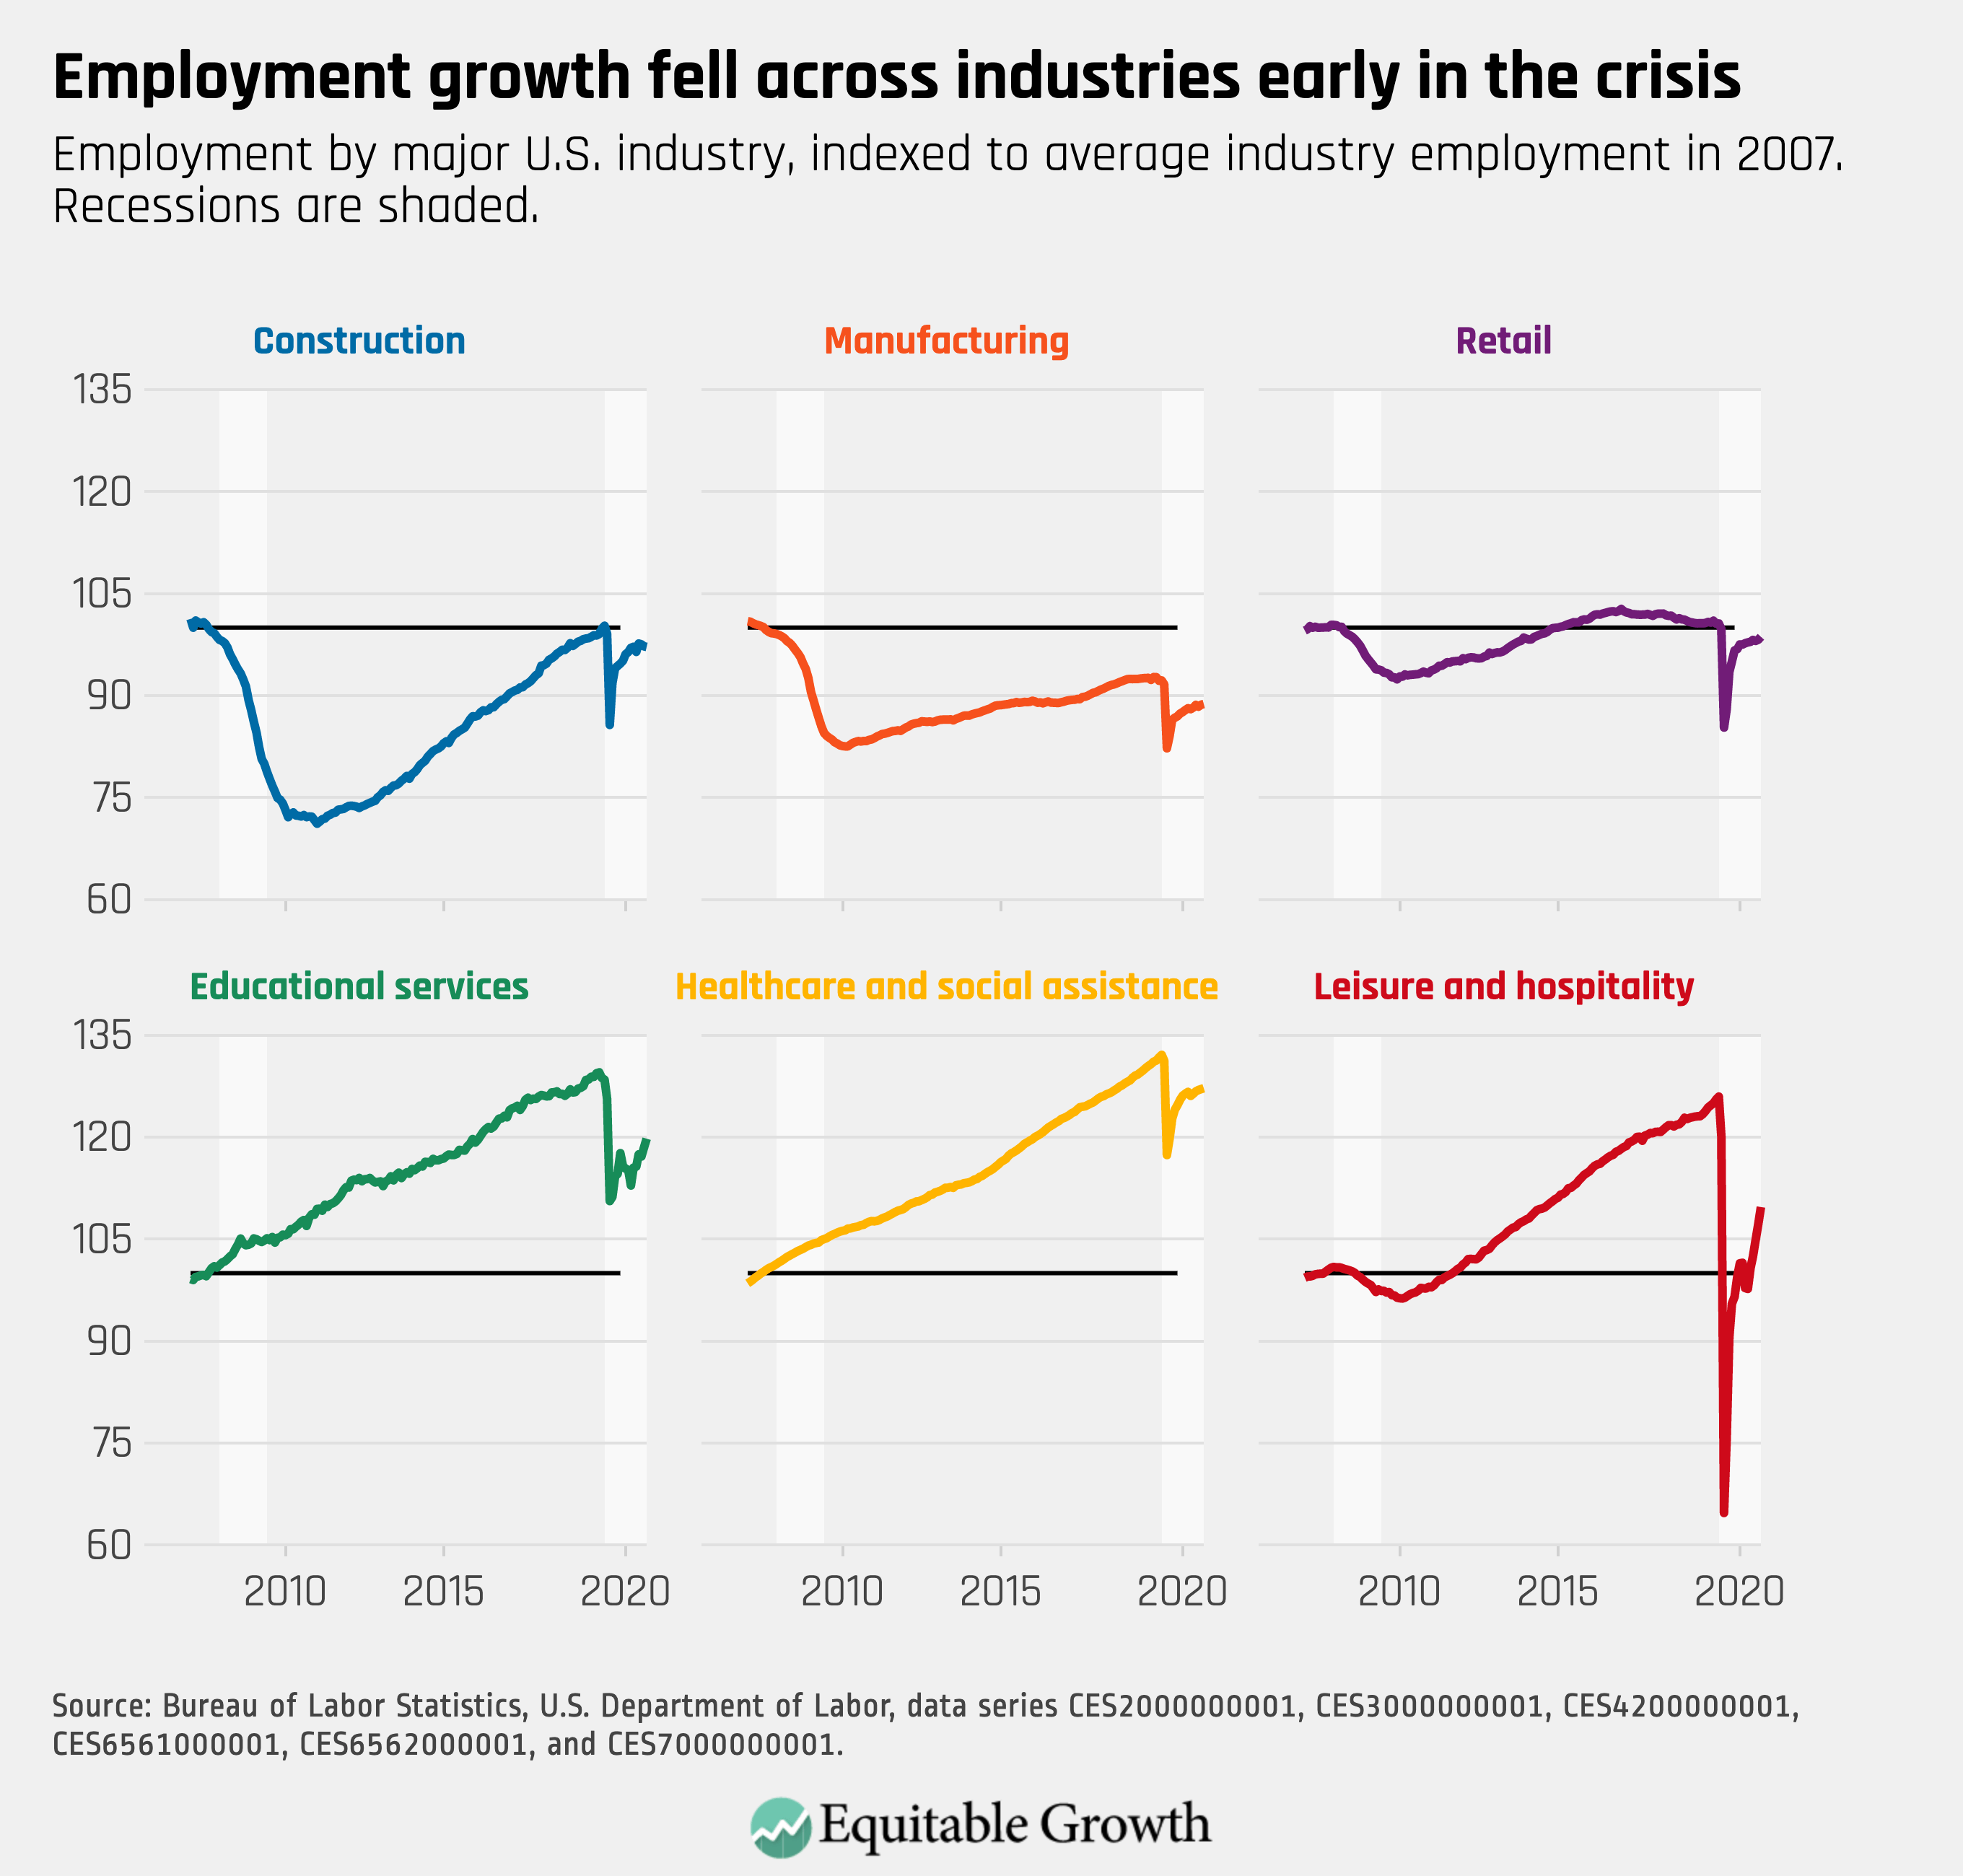
Employment grew for some of the industries hit hard by the coronavirus recession, including leisure and hospitality, but still remains below pre-pandemic levels.