Equitable Growth’s Jobs Day Graphs: June 2020 Report Edition
On July 2nd, the U.S. Bureau of Labor Statistics released new data on the U.S. labor market during the month of May. Below are five graphs compiled by Equitable Growth staff highlighting important trends in the data.
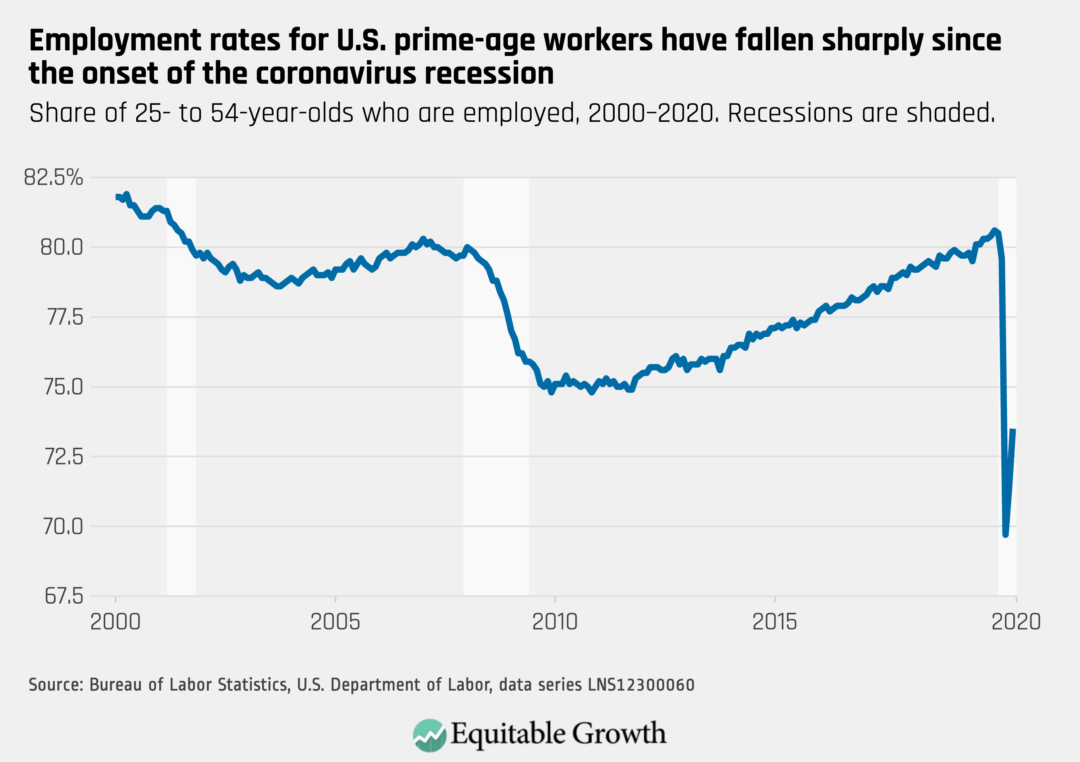
The prime-age employment rate continues to rebound from its stark drop in March, but only recovering about 1/3 of its drop as the pandemic surges again and necessitates further lockdowns.
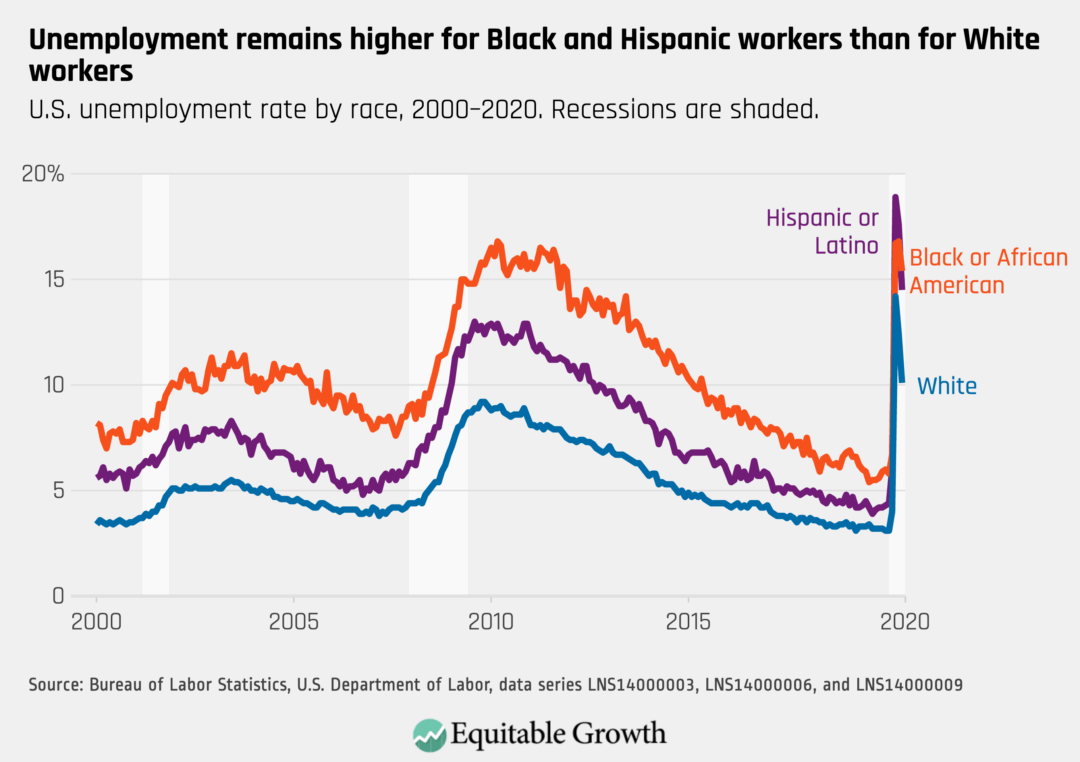
Unemployment rates decreased across racial and ethnic groups, but significantly less so for Black workers compared to White and Hispanic workers. Hispanic workers’ unemployment rate continues to be elevated against historical trends.
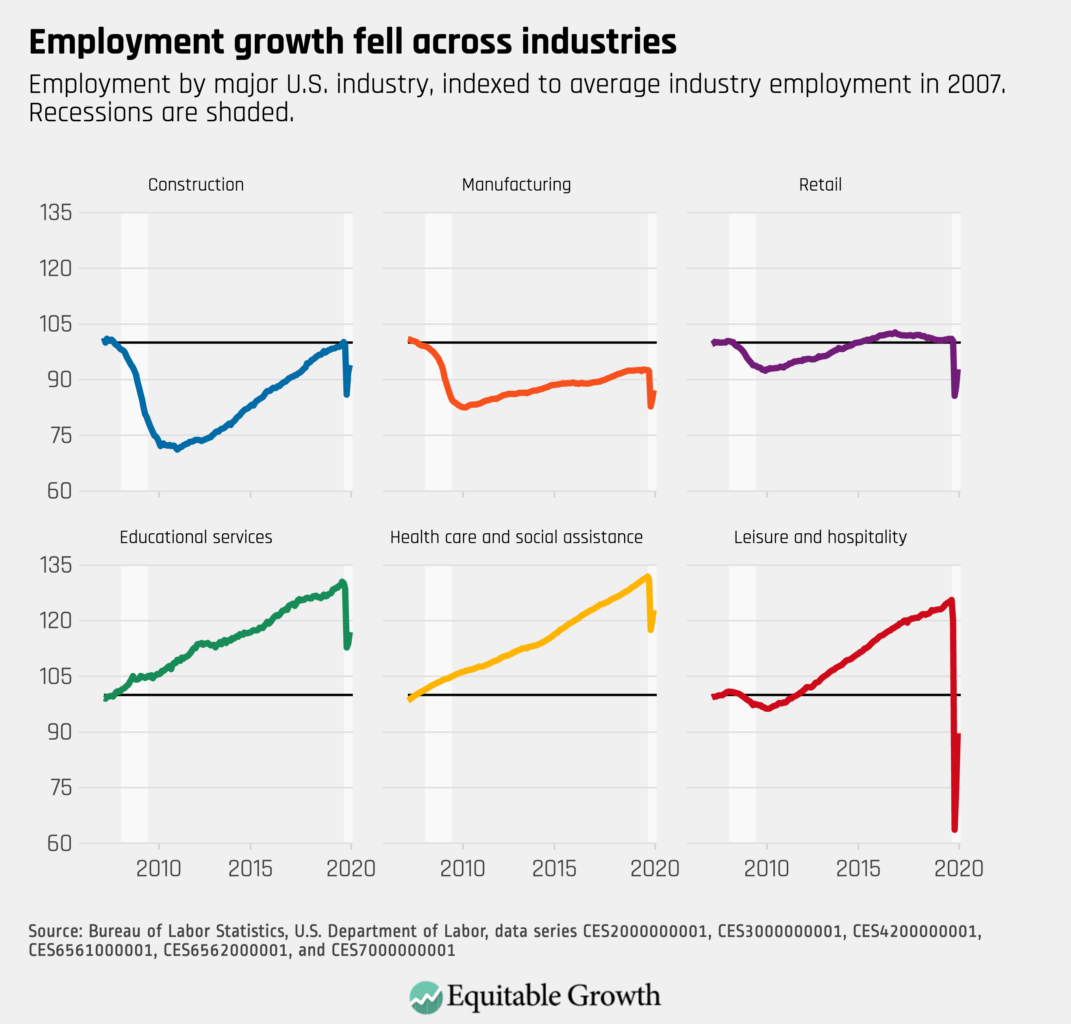
All industries gained employment in June, with 2/5 of new jobs being added in leisure and hospitality, after facing the steepest job losses among industries in March.
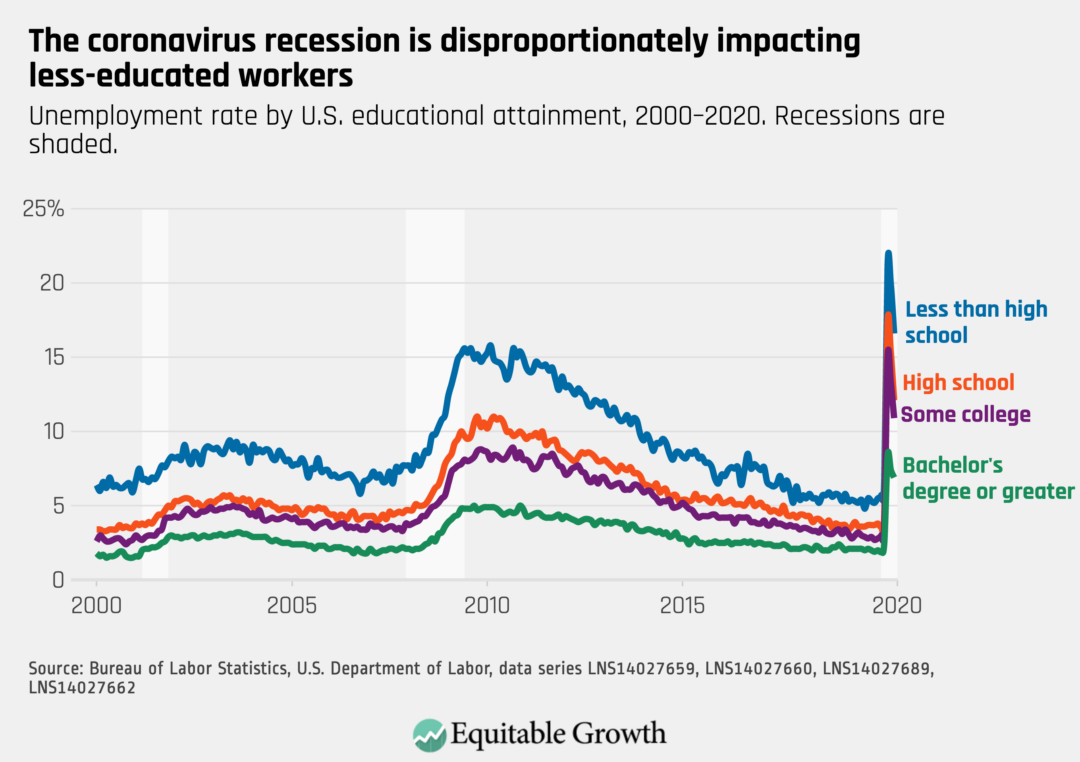
The unemployment rate declined for workers of all education levels. Workers with a college degree or higher experienced a lower rate of decline but still have lower unemployment rates compared to other groups.
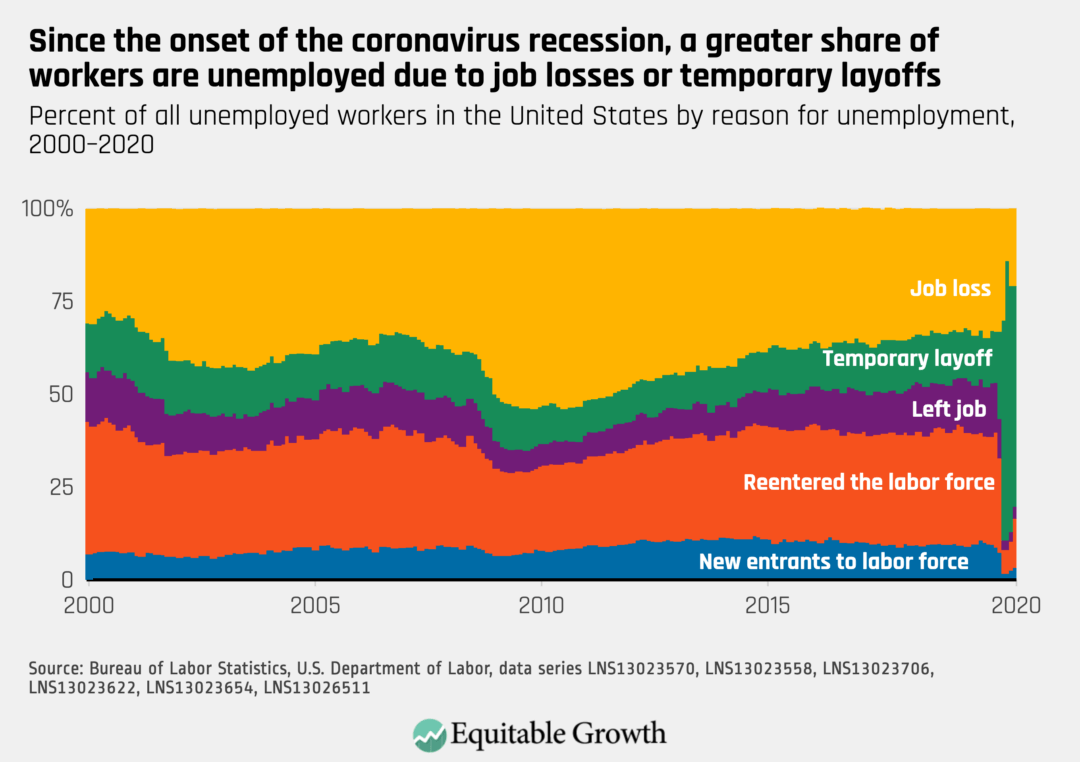
As the labor market partially rebounded in June, a smaller share of unemployed workers were temporarily laid off and an increasing proportion have reentered the labor force.