Equitable Growth’s Jobs Day Graphs: June 2018 Report Edition
Earlier this morning, the U.S. Bureau of Labor Statistics released new data on the U.S. labor market during the month of June. Below are five graphs compiled by Equitable Growth staff highlighting important trends in the data.
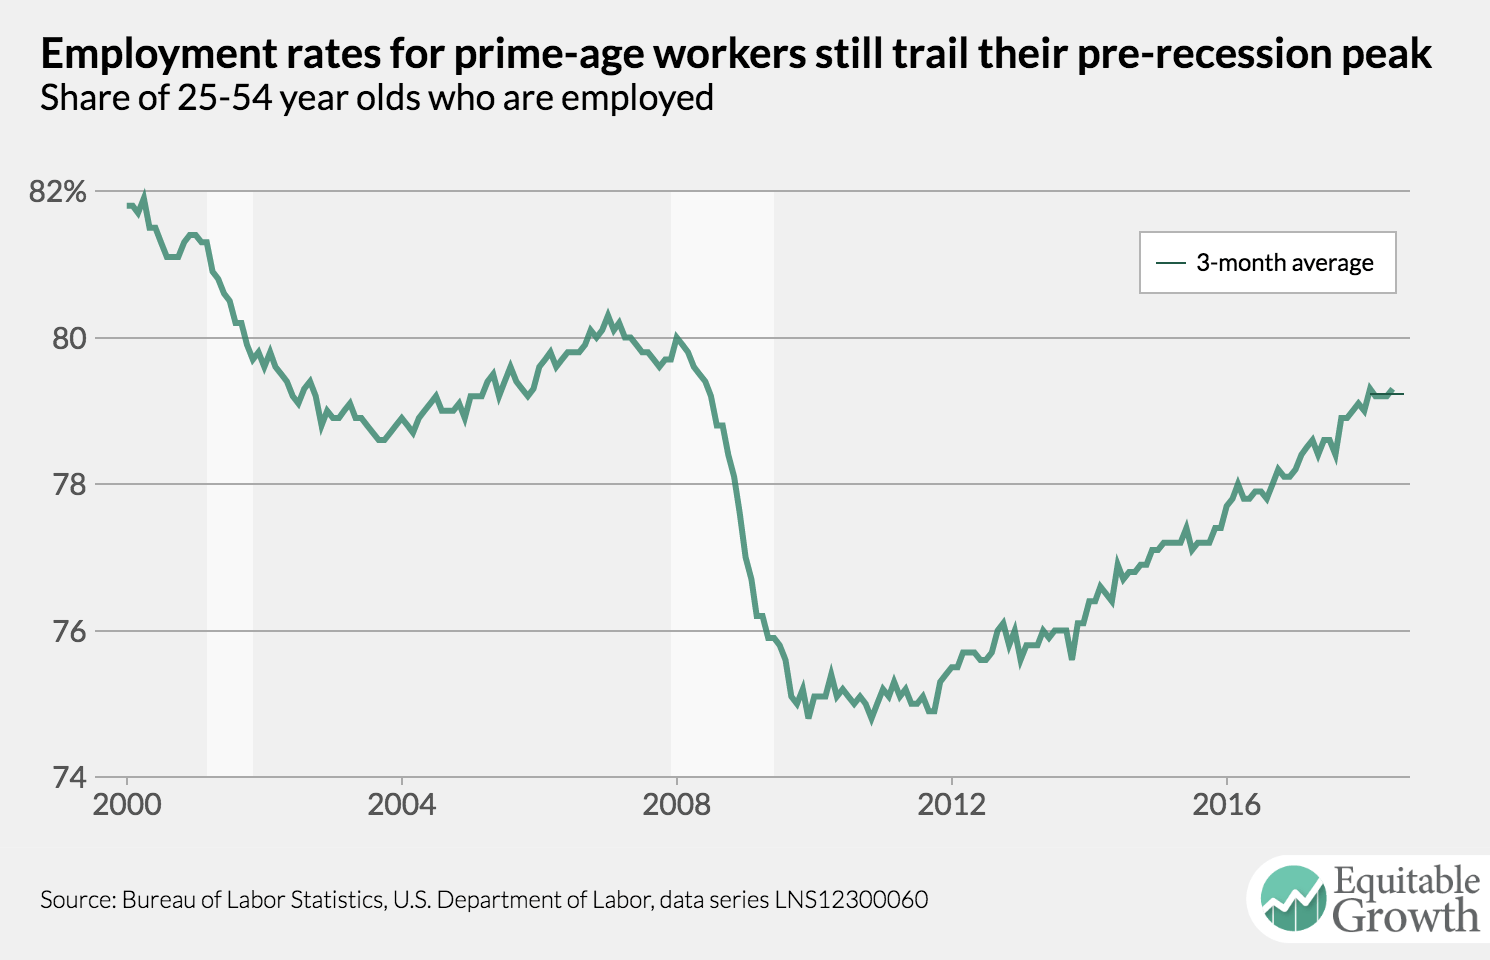
1.
While the trend in prime age employment has been upward since the end of the Great Recession, this statistic remained flat in June and has moved little since February, and remains below its pre-recession levels.
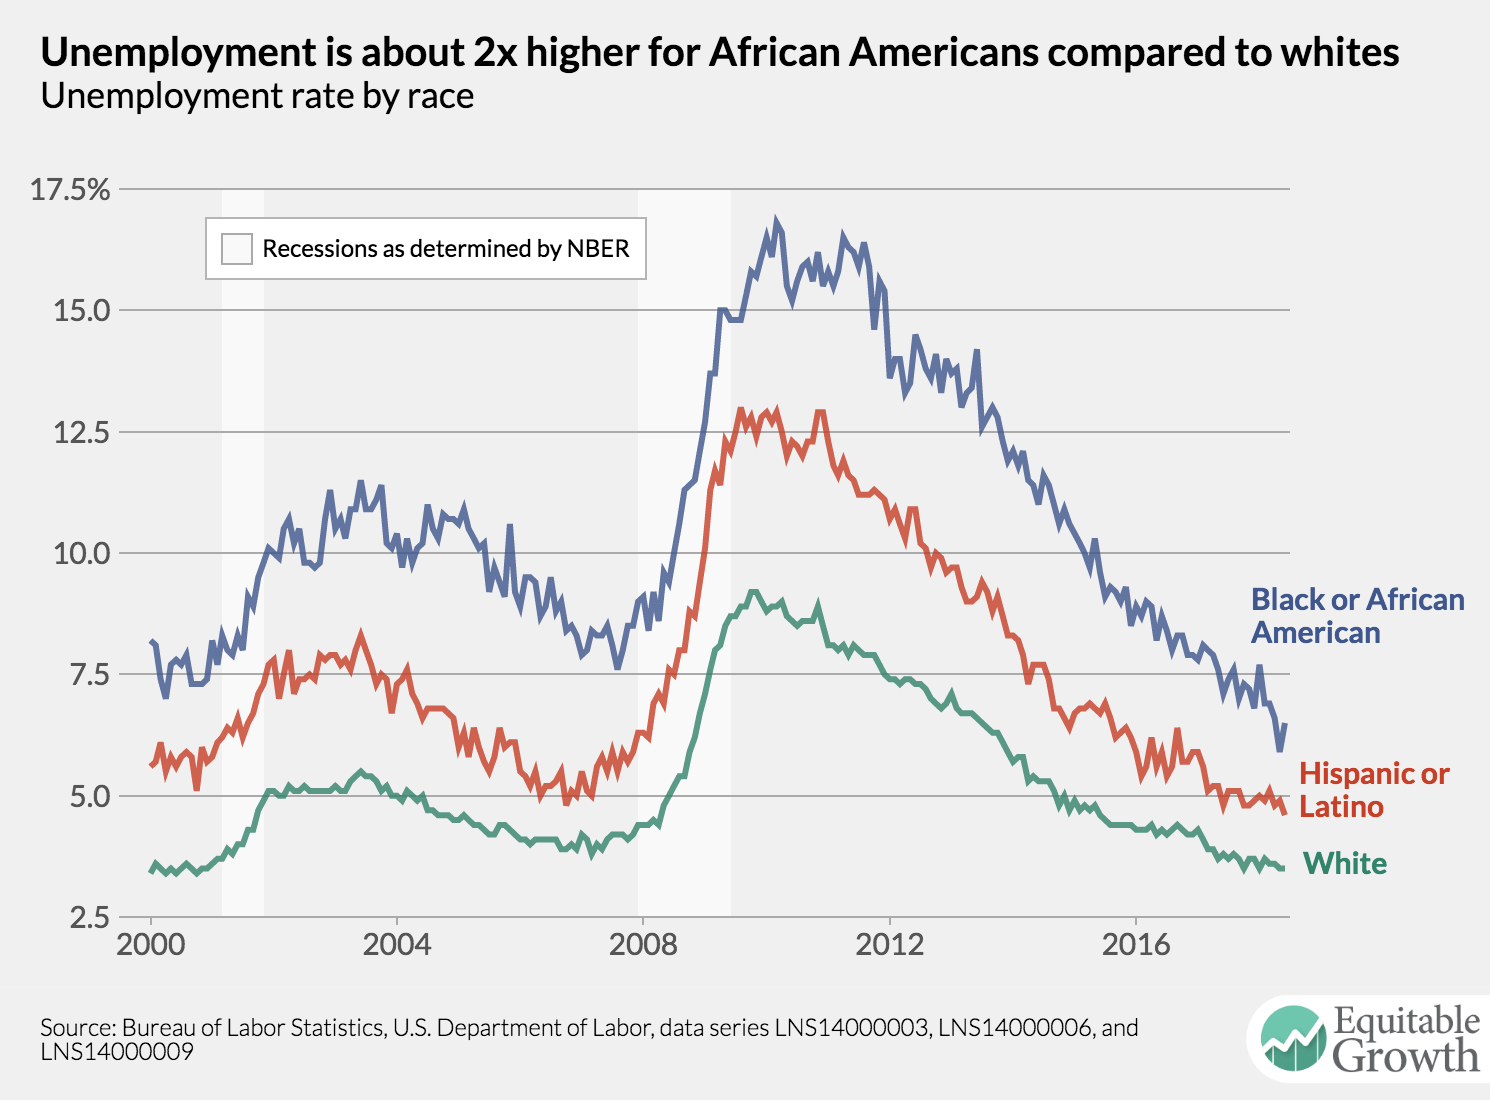
2.
Unemployment rates by race continue to demonstrate persistent disparities, with Black or African American unemployment twice that of White unemployment and Hispanic unemployment one percentage point greater than White unemployment.
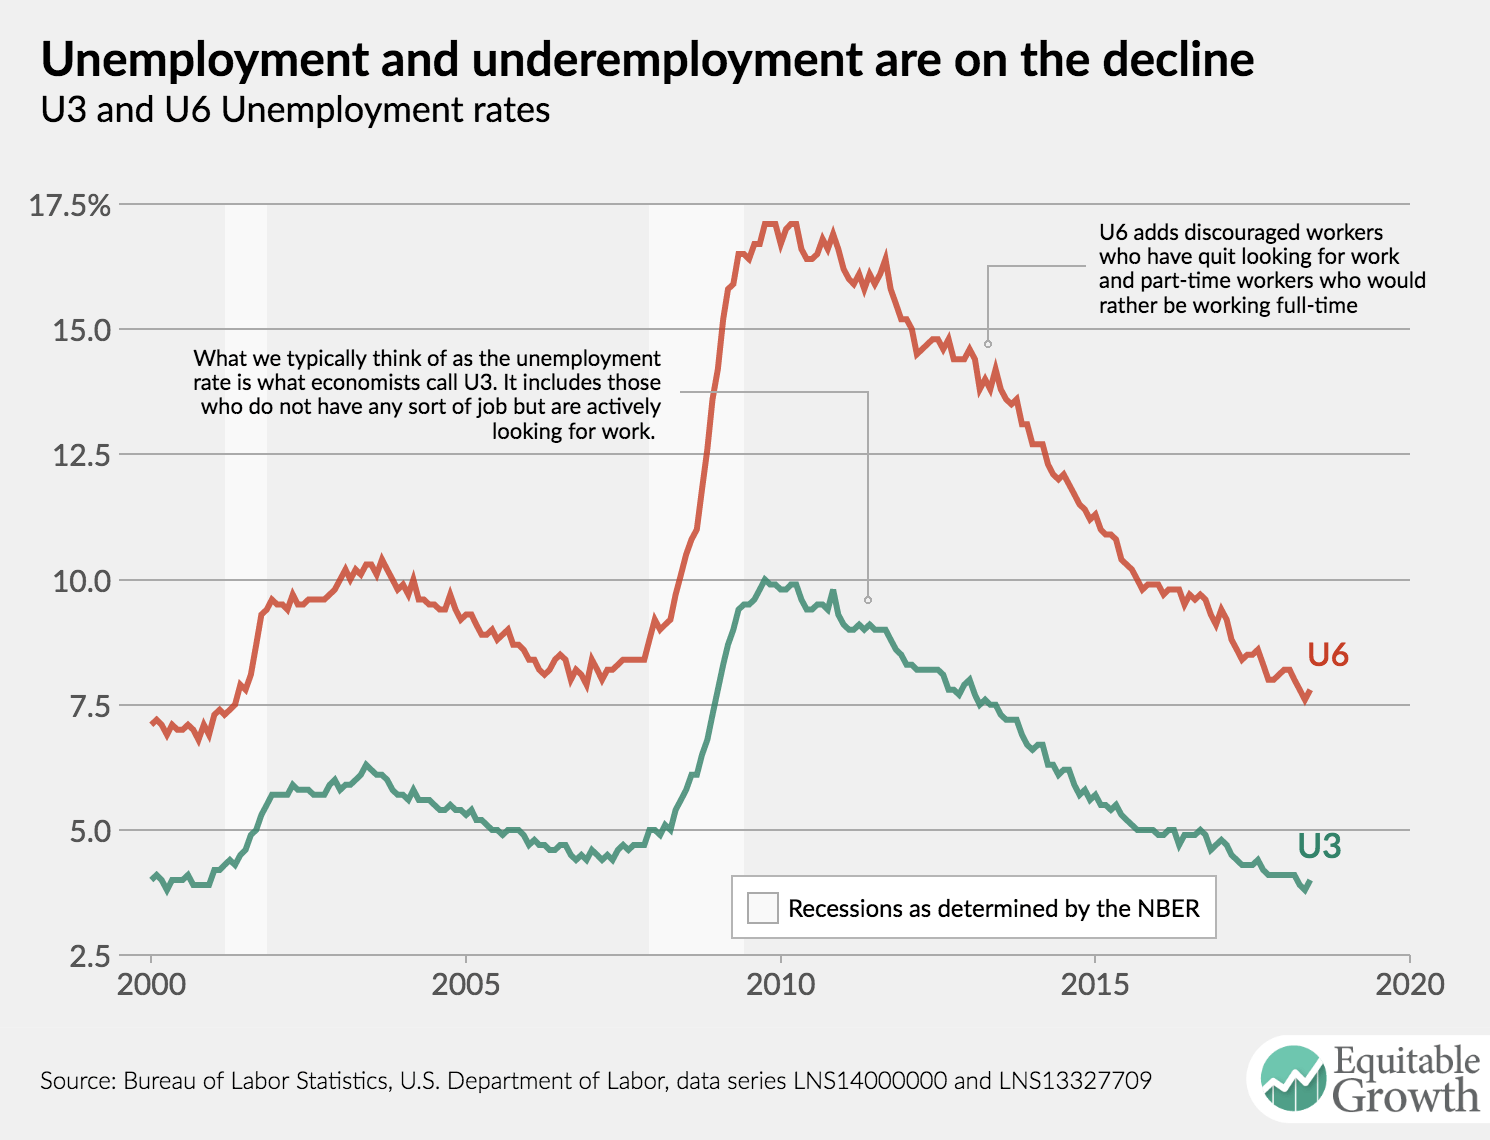
3.
Historic downward trends in unemployment and underemployment held off in June, with U-3 and U-6 unemployment both ticking upward slightly.
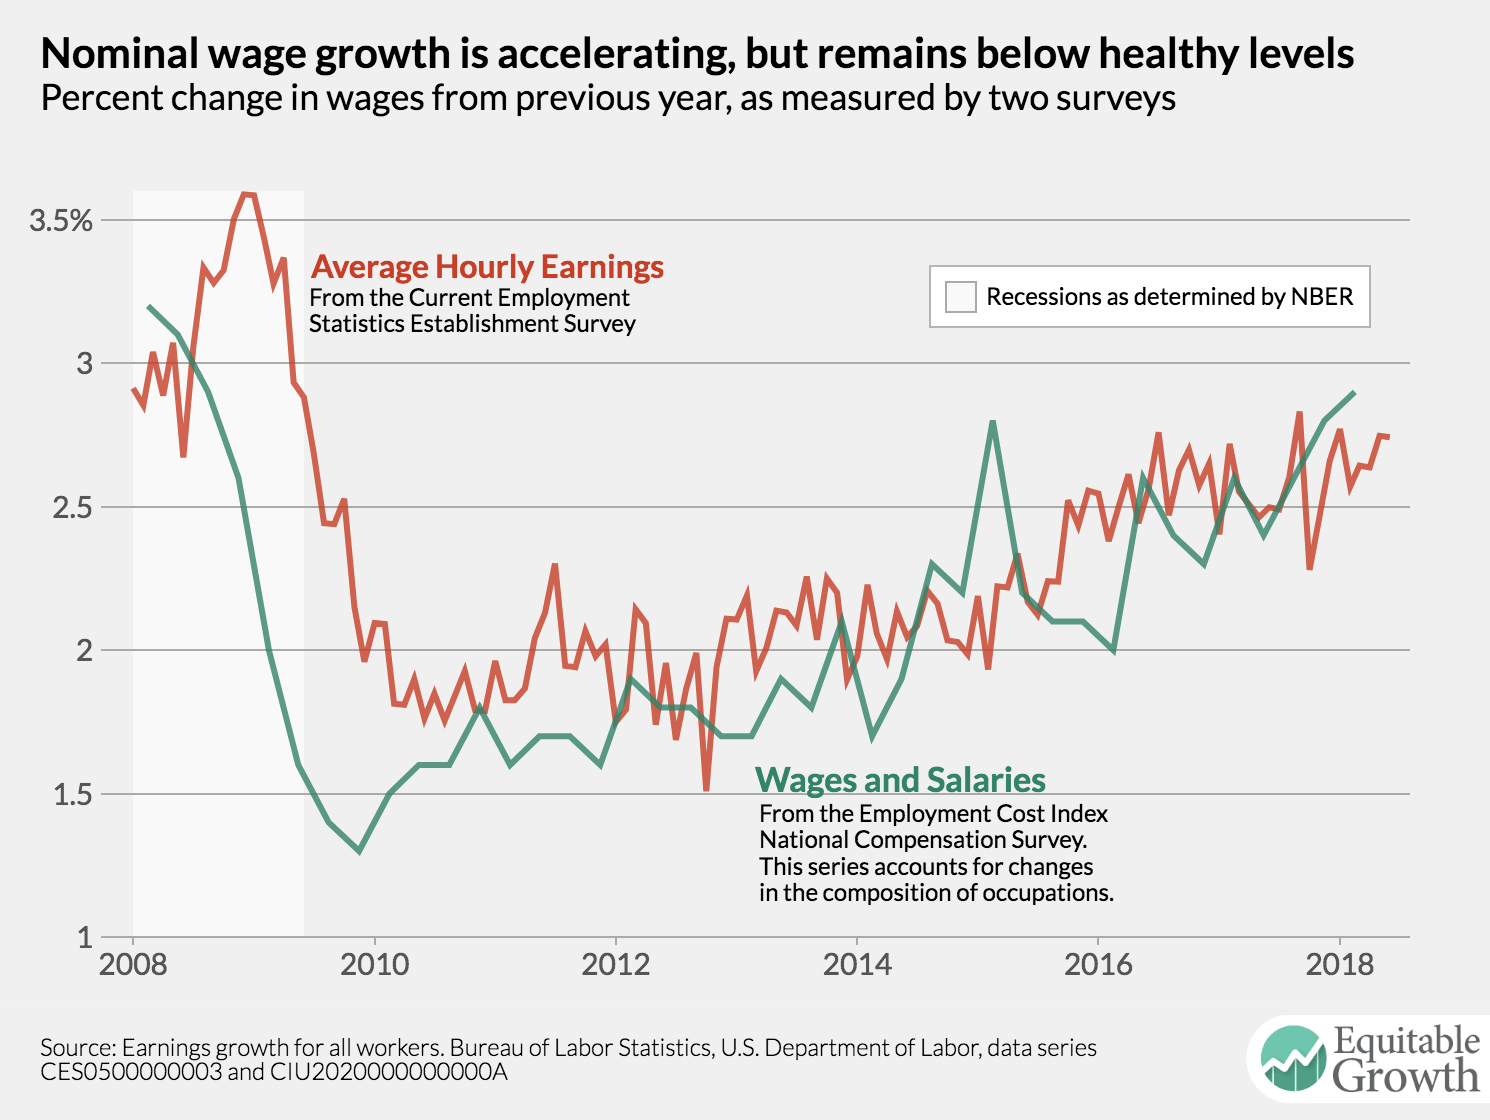
4.
Wage growth remains positive but tepid. Year-over-year wages increased 2.7% before accounting for inflation.
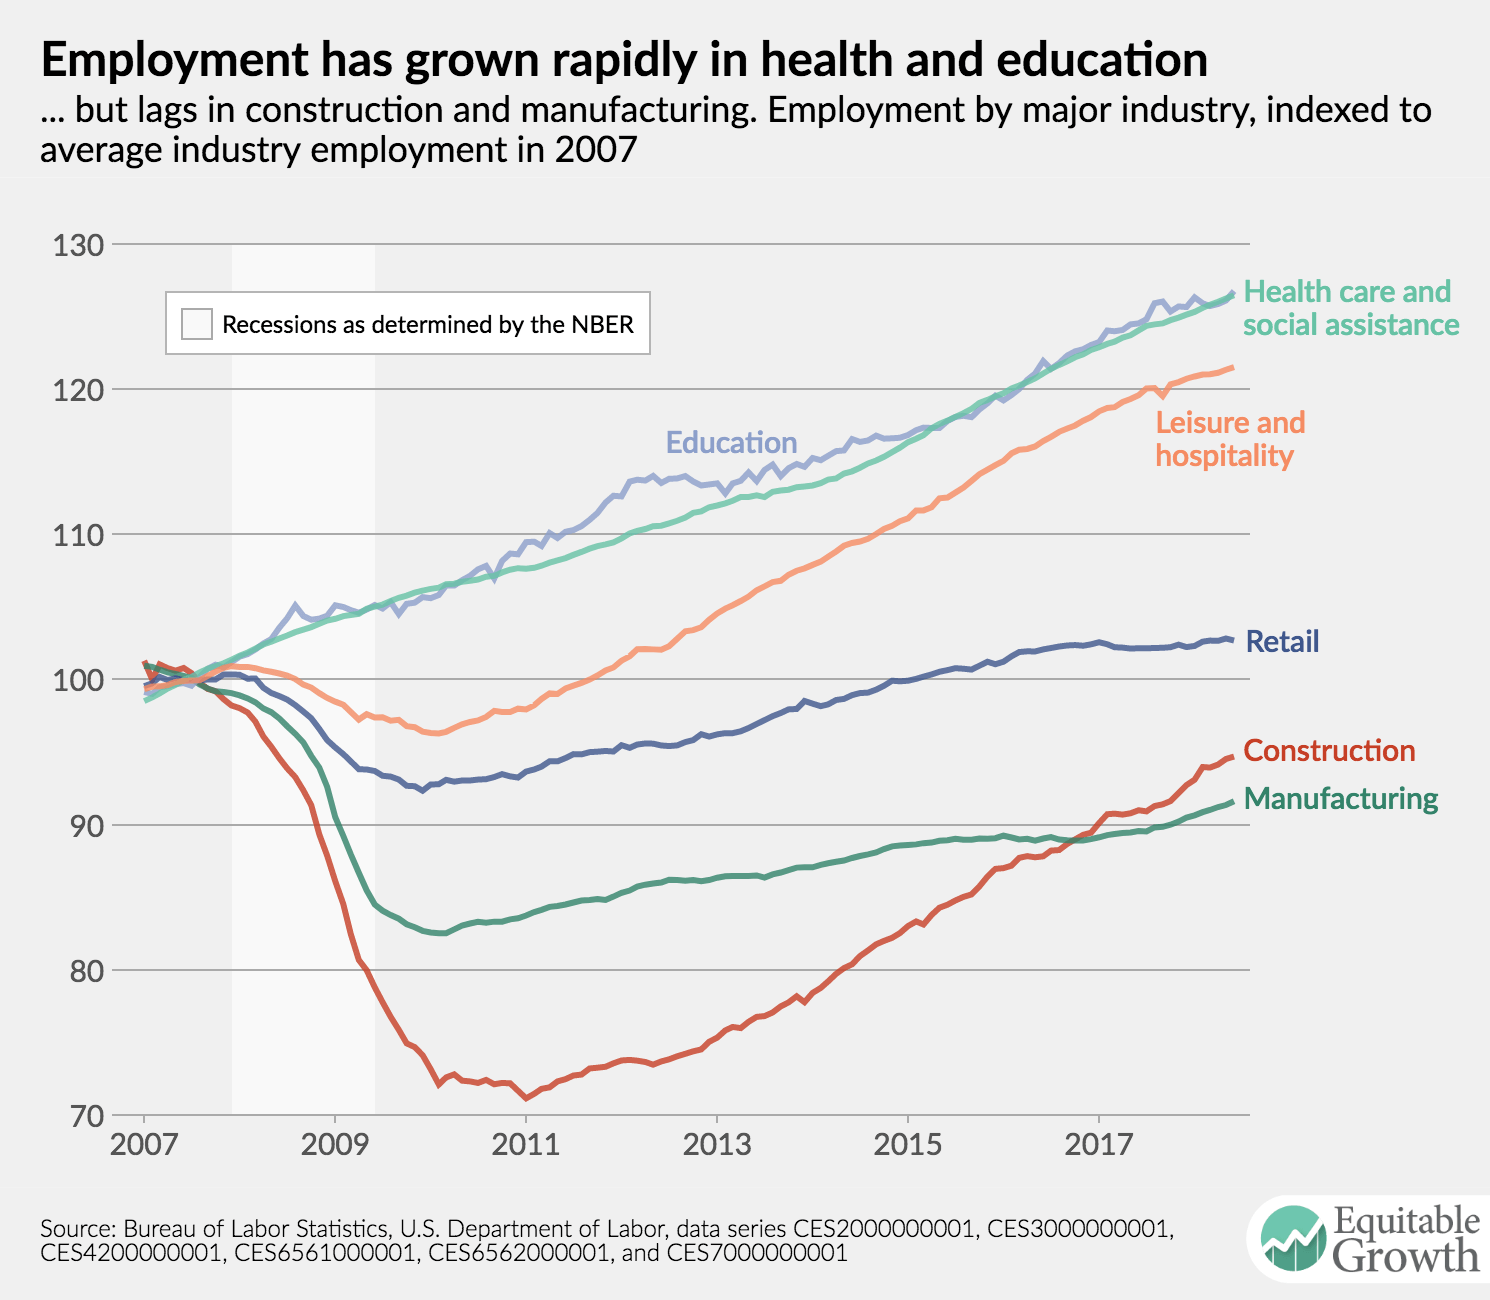
5.
The manufacturing sector added the most employment of any industry in June, with 36,000 jobs. But the long-term trend remains below healthcare, which has added 309,000 jobs in the past year compared to 285,000 jobs in manufacturing.