Equitable Growth’s Jobs Day Graphs: January 2020 Report Edition
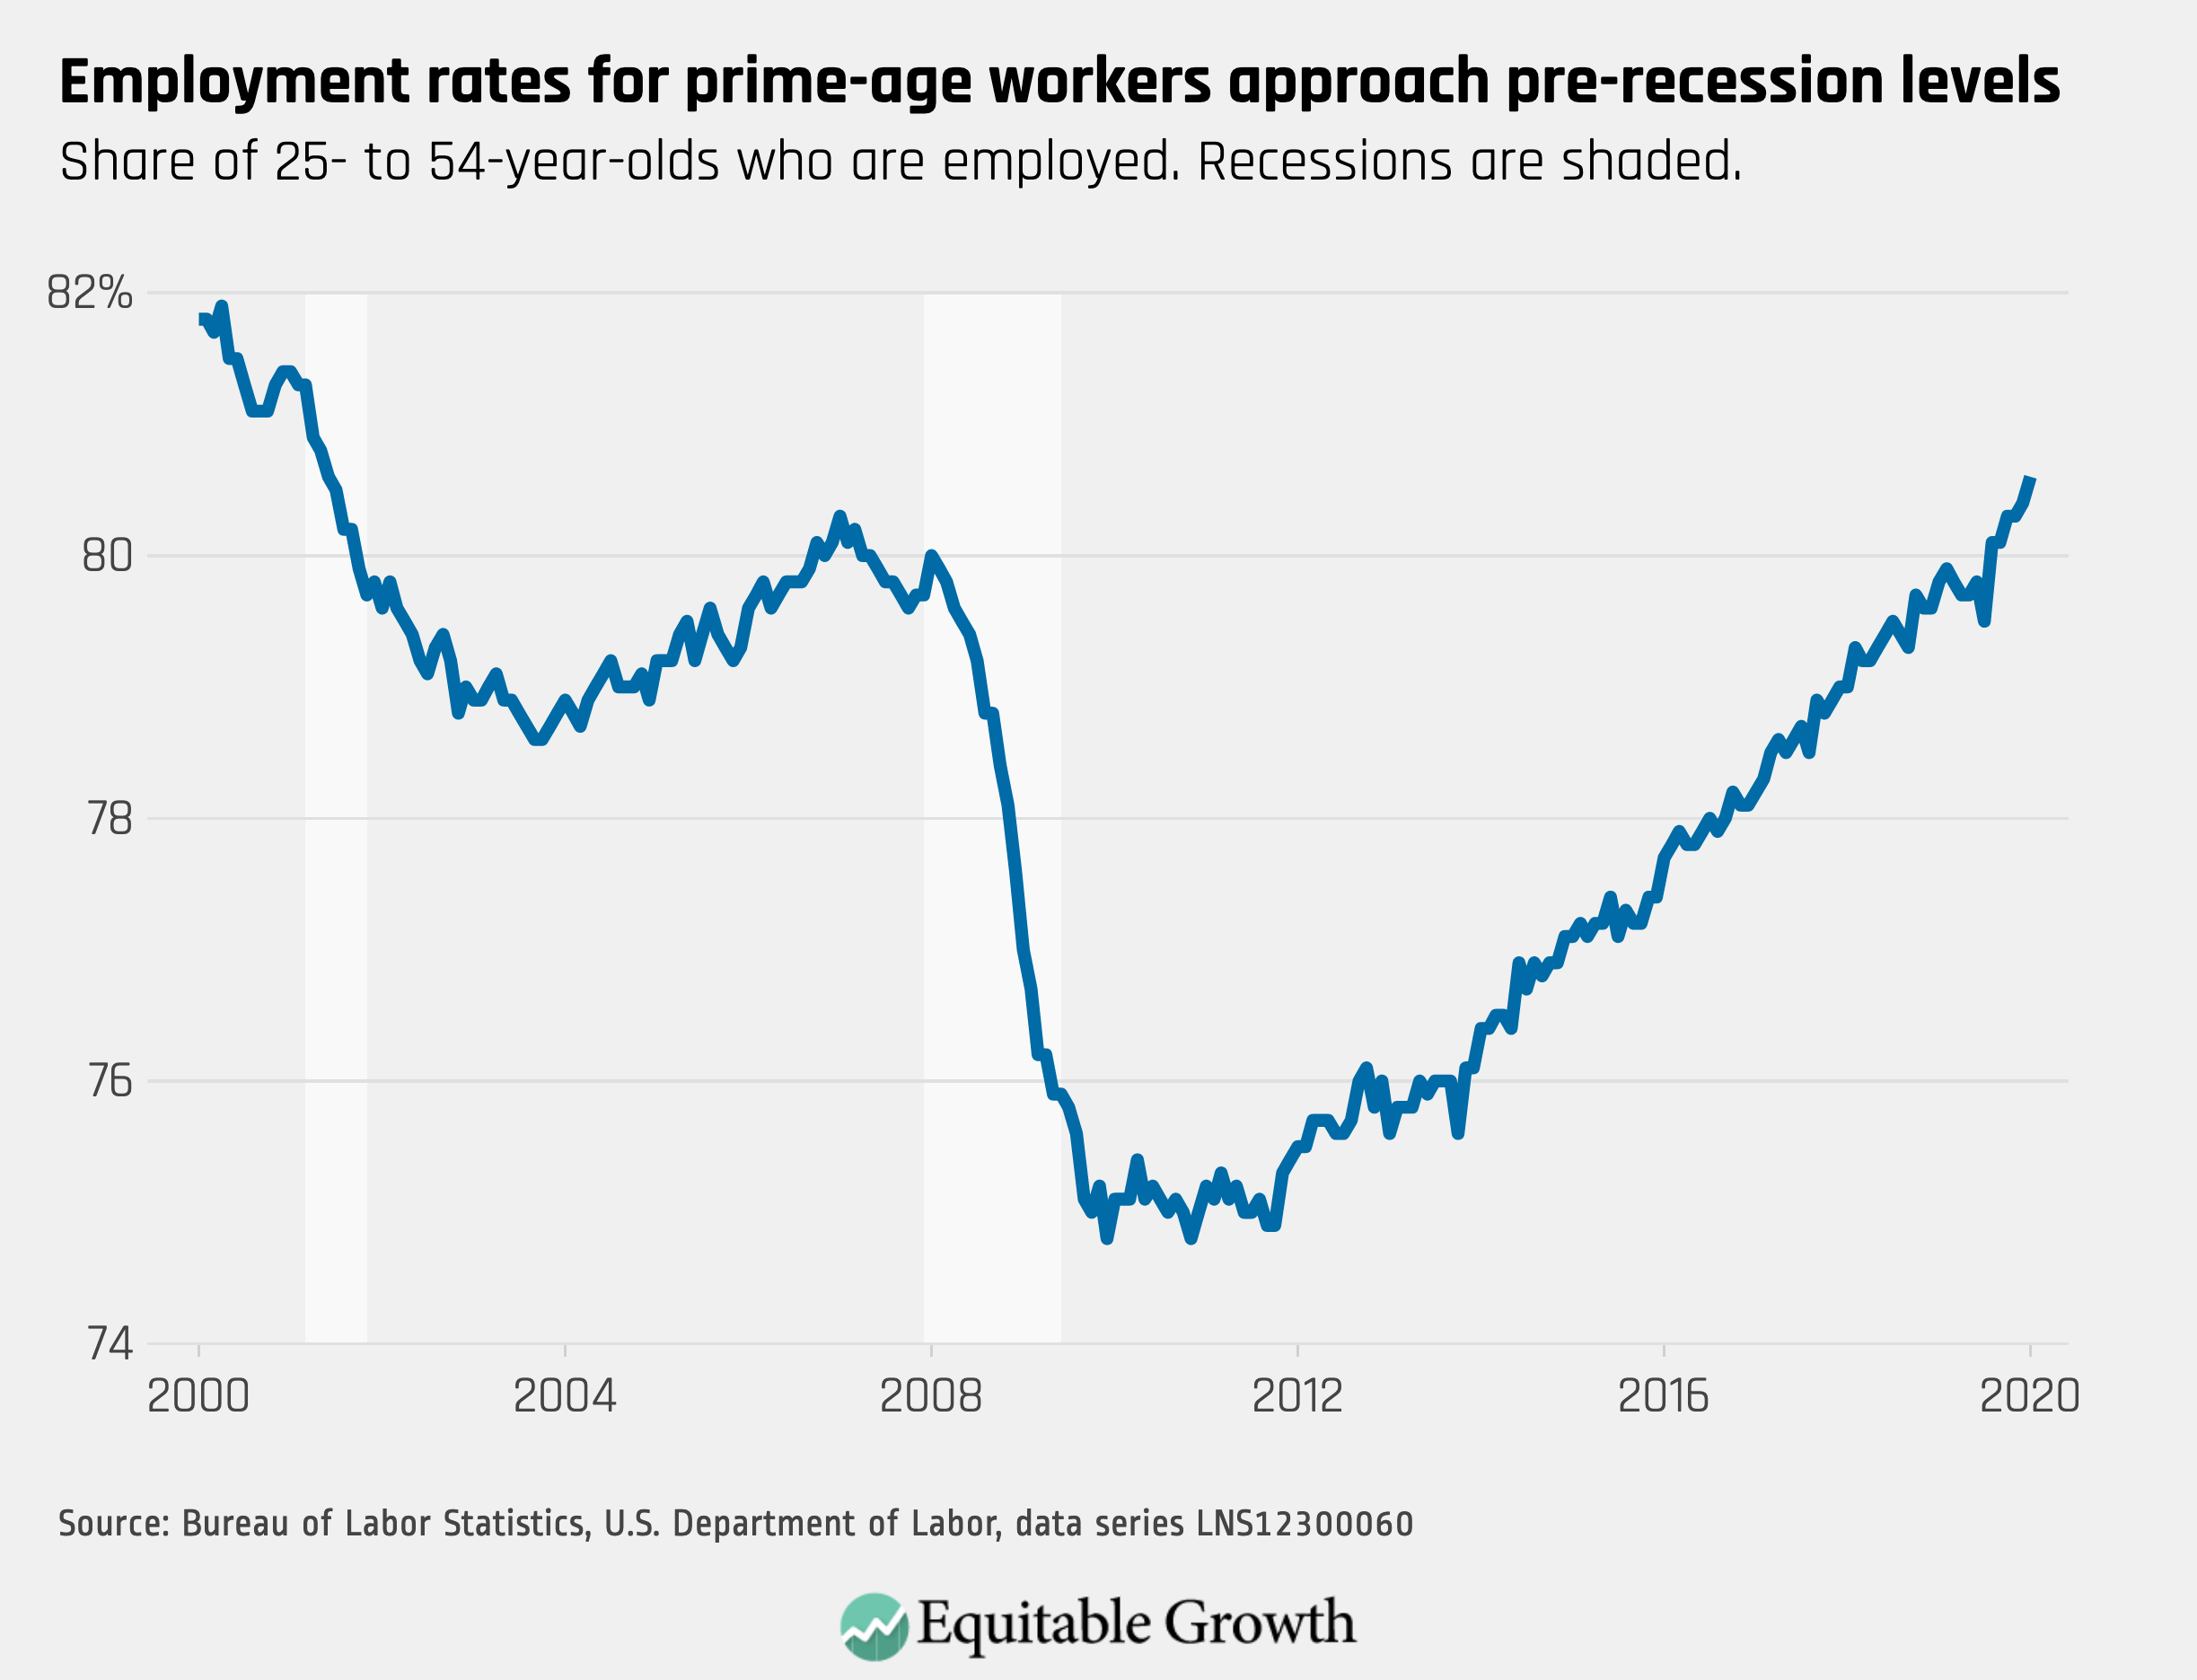
1.
Prime-age employment-to-population ratio increased to 80.6% in January, reflecting a healthy labor market 10 years into the expansion.
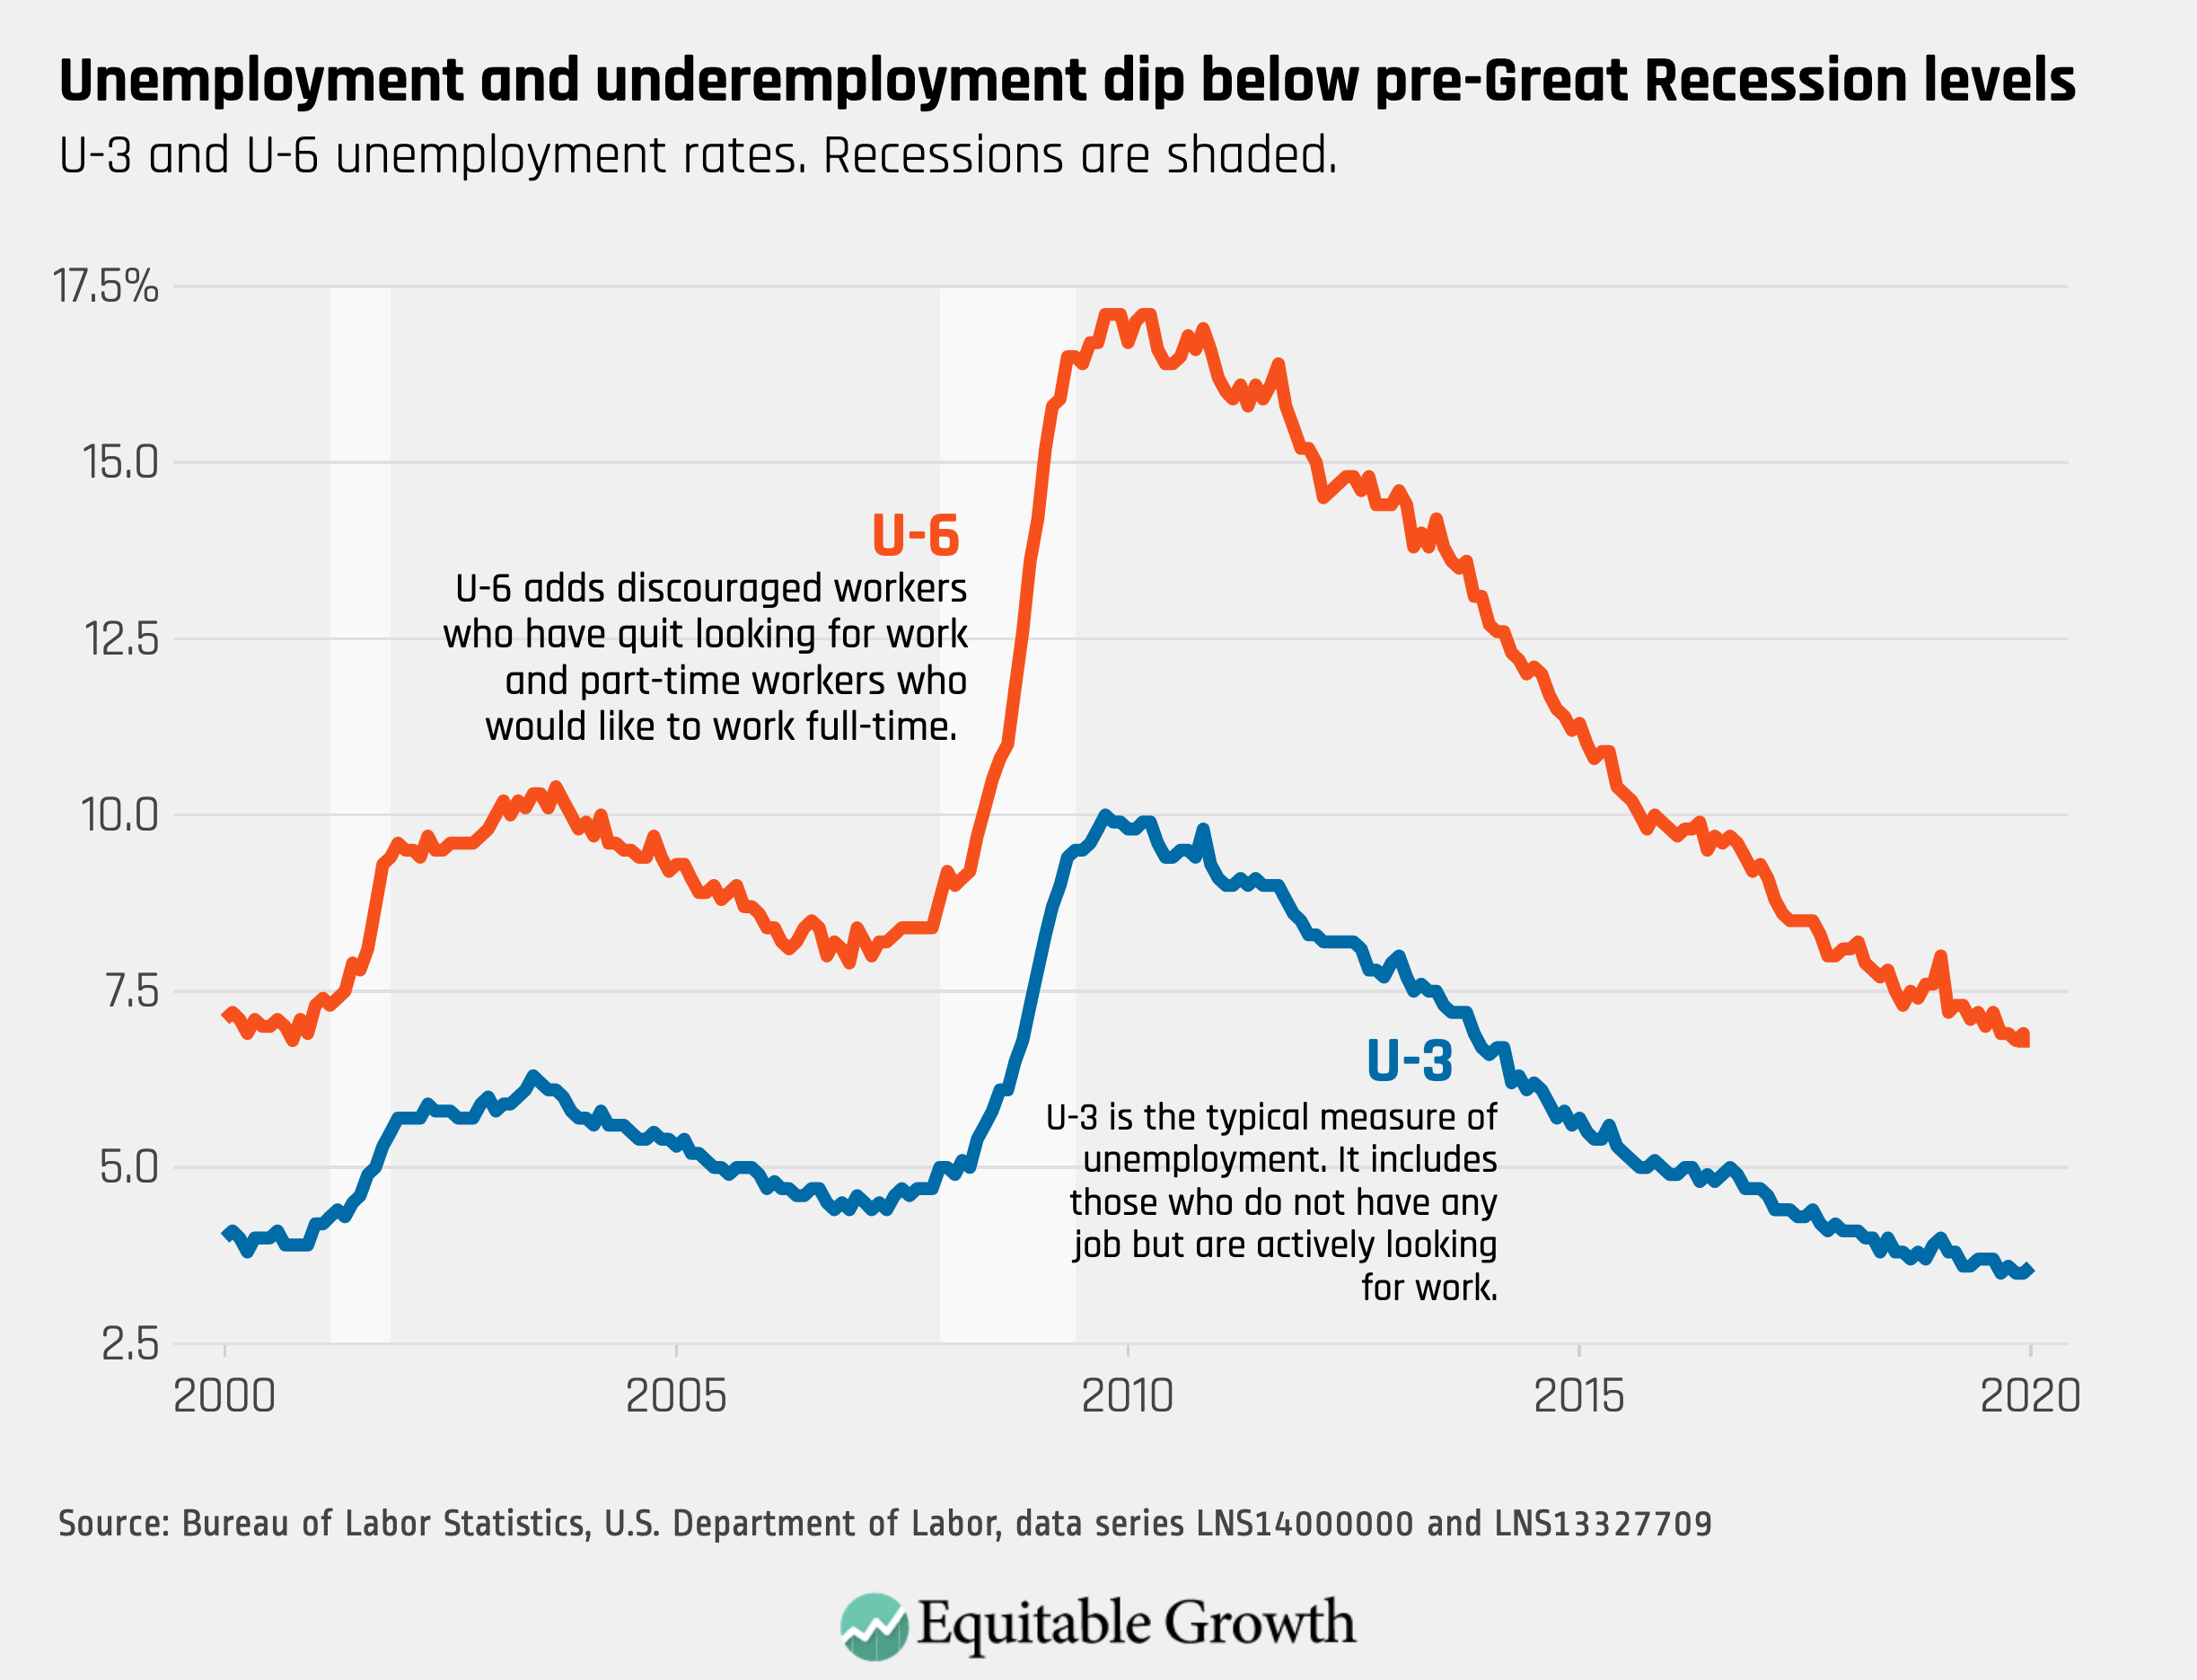
2.
Topline unemployment, also known as U3, edged up slightly from 3.5% to 3.6%, and underemployment, or U6, increased from 6.7% to 6.9%.
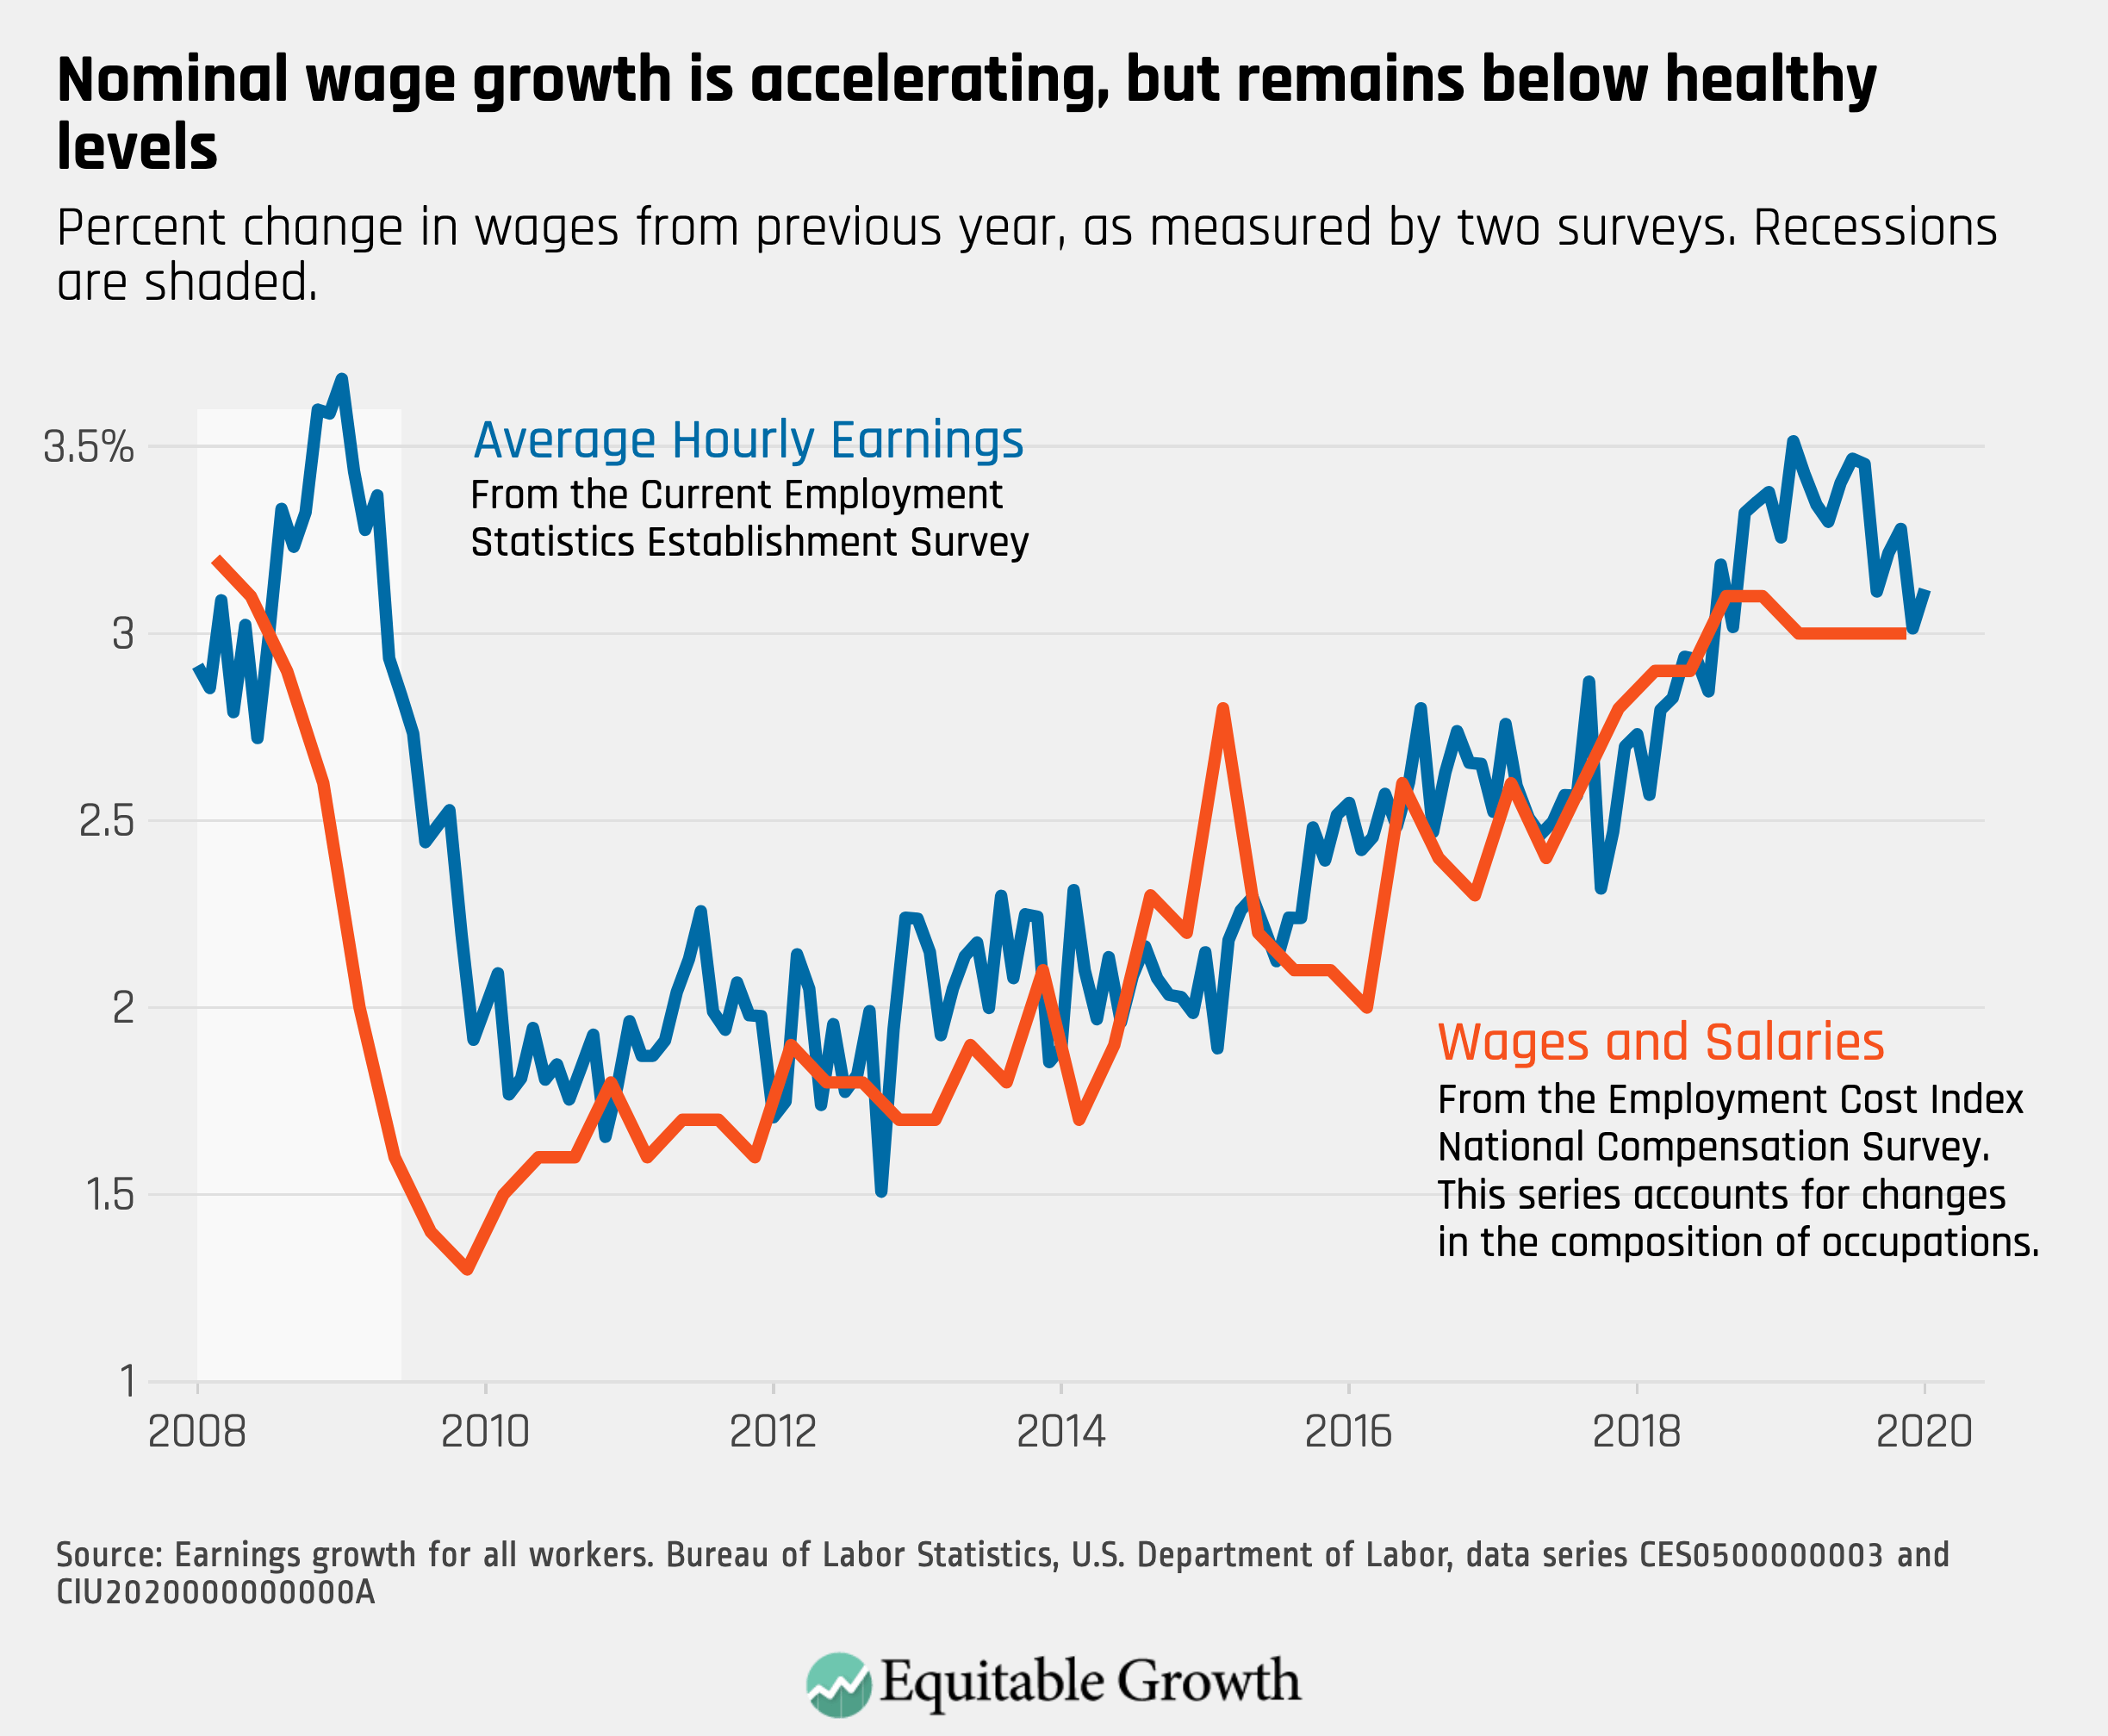
3.
Wage growth remains tepid at 3.1% year-over-year, despite a low unemployment rate and more jobs being added to the labor force.
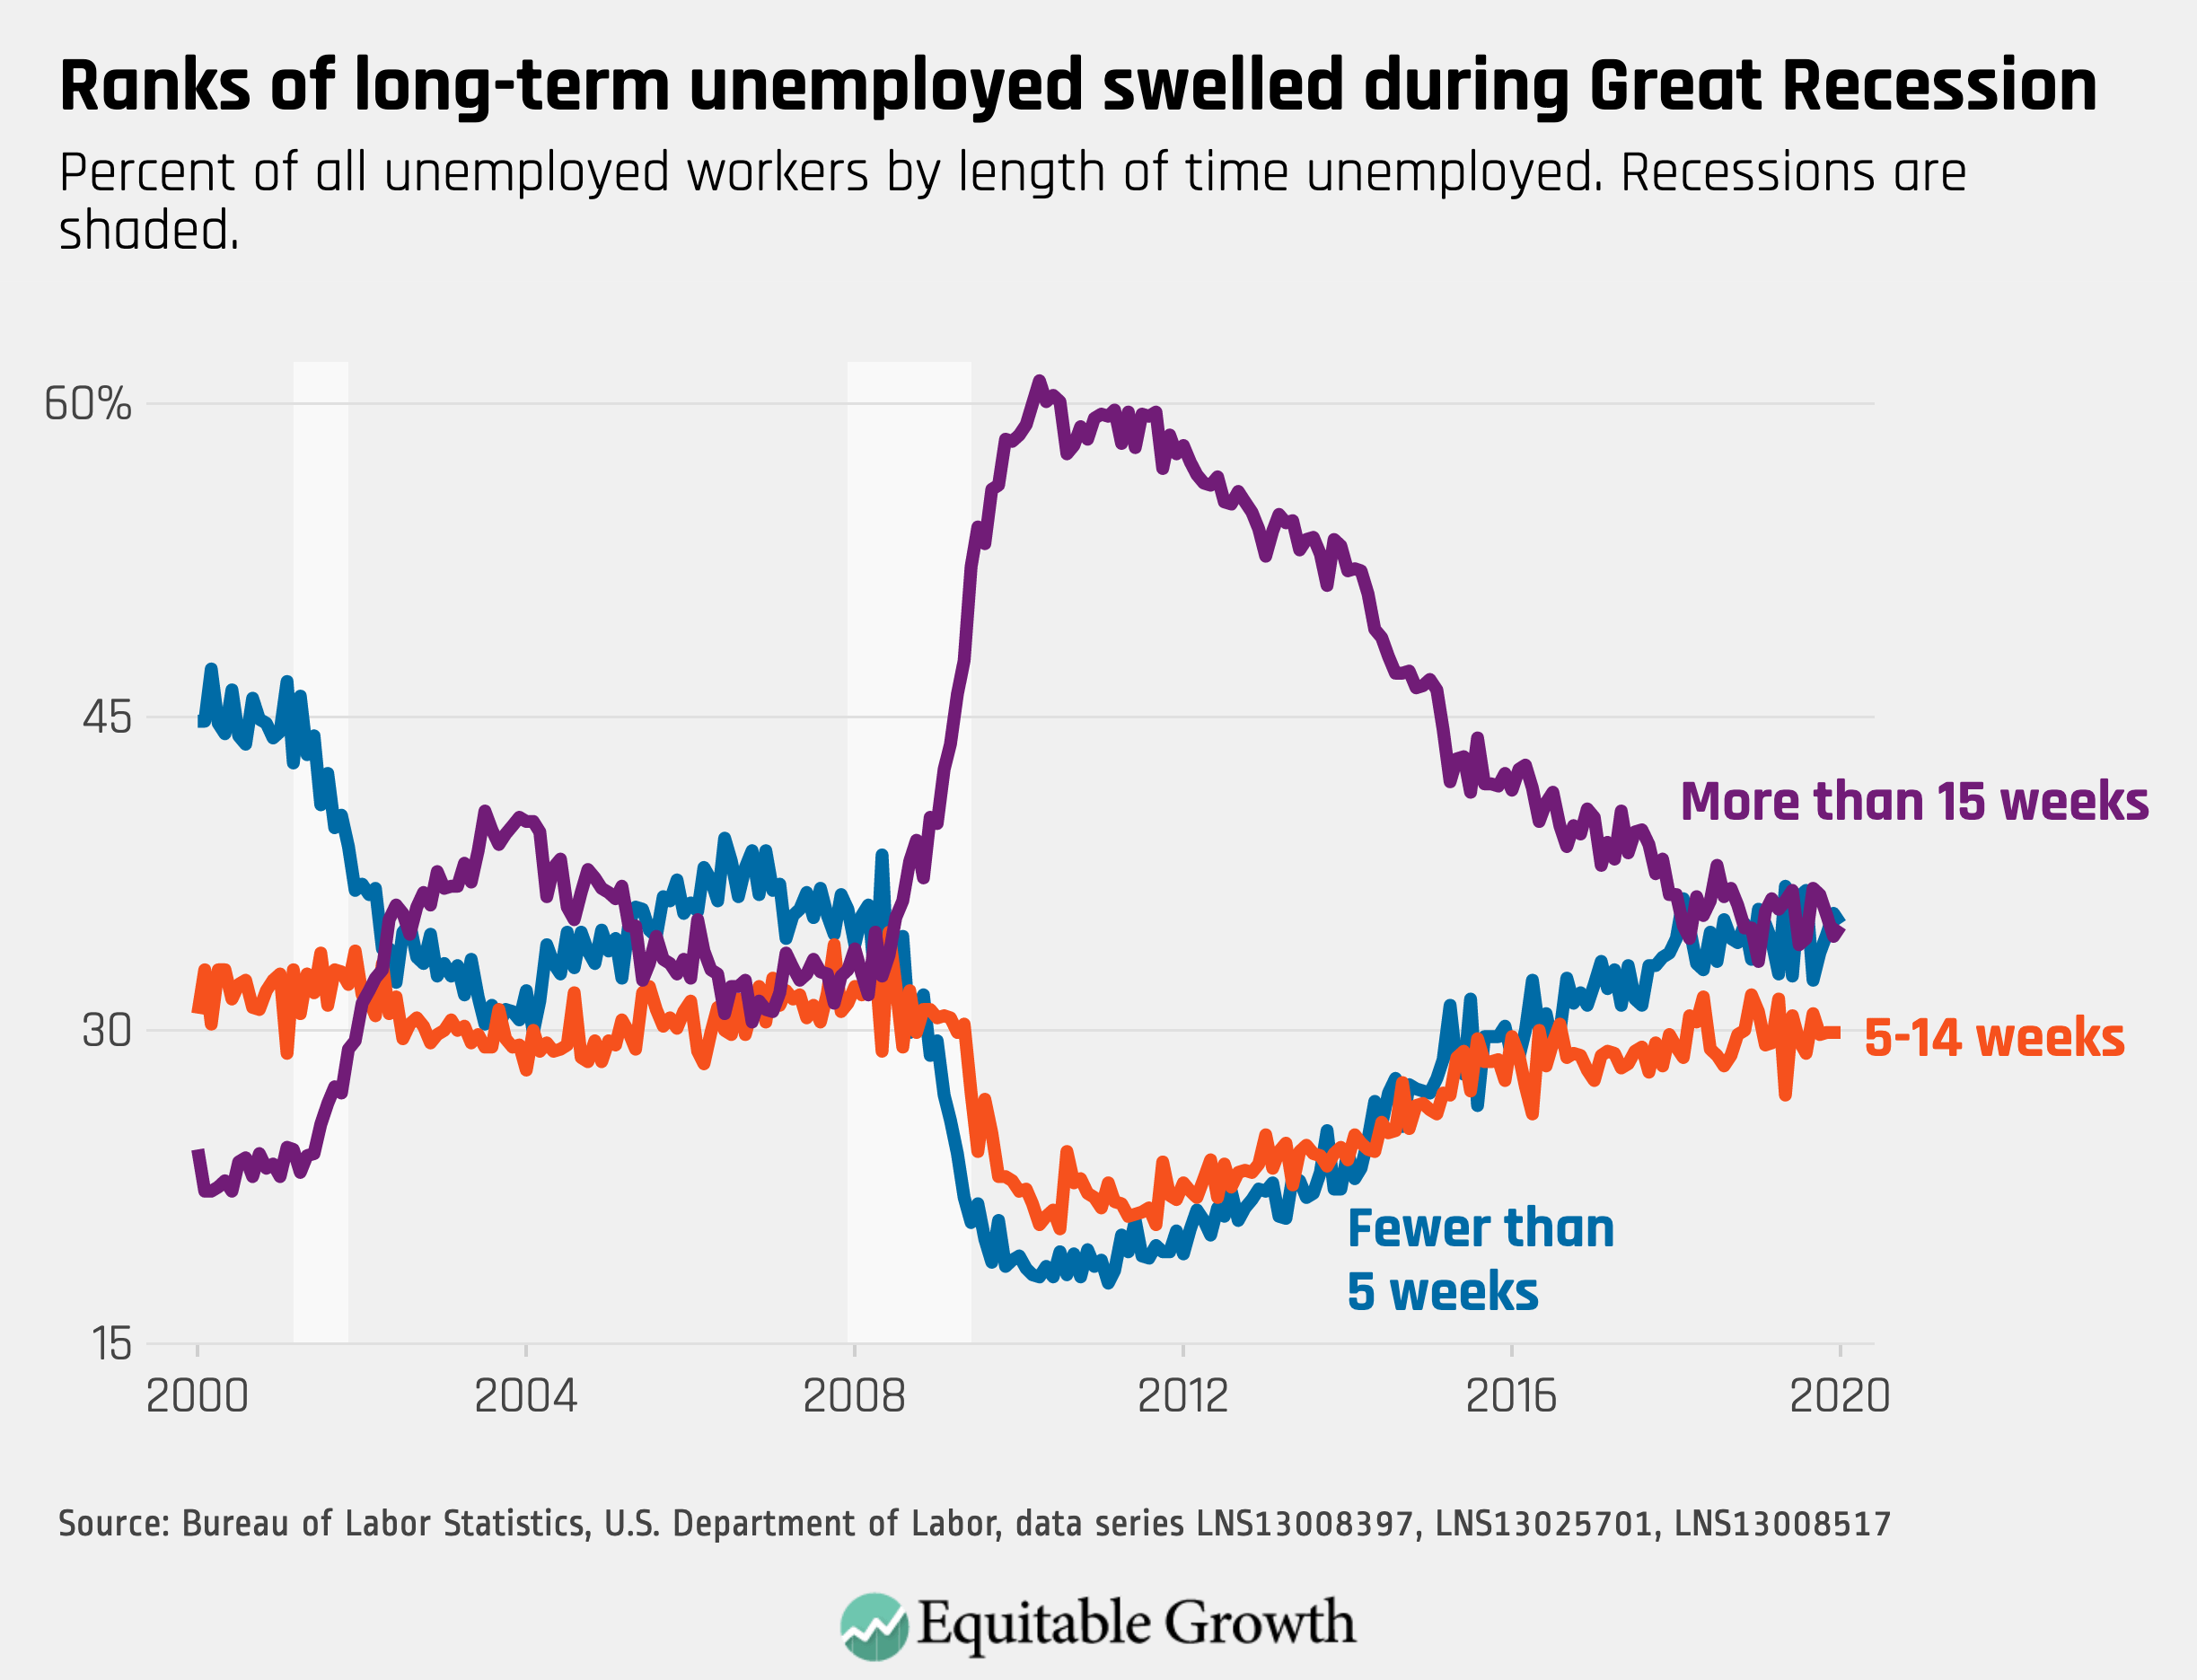
4.
The proportion of unemployed workers who have been out of work for more than 15 weeks has been steadily declining since the expansion began, but it has plateaued in the past two years, other than a small increase in January.
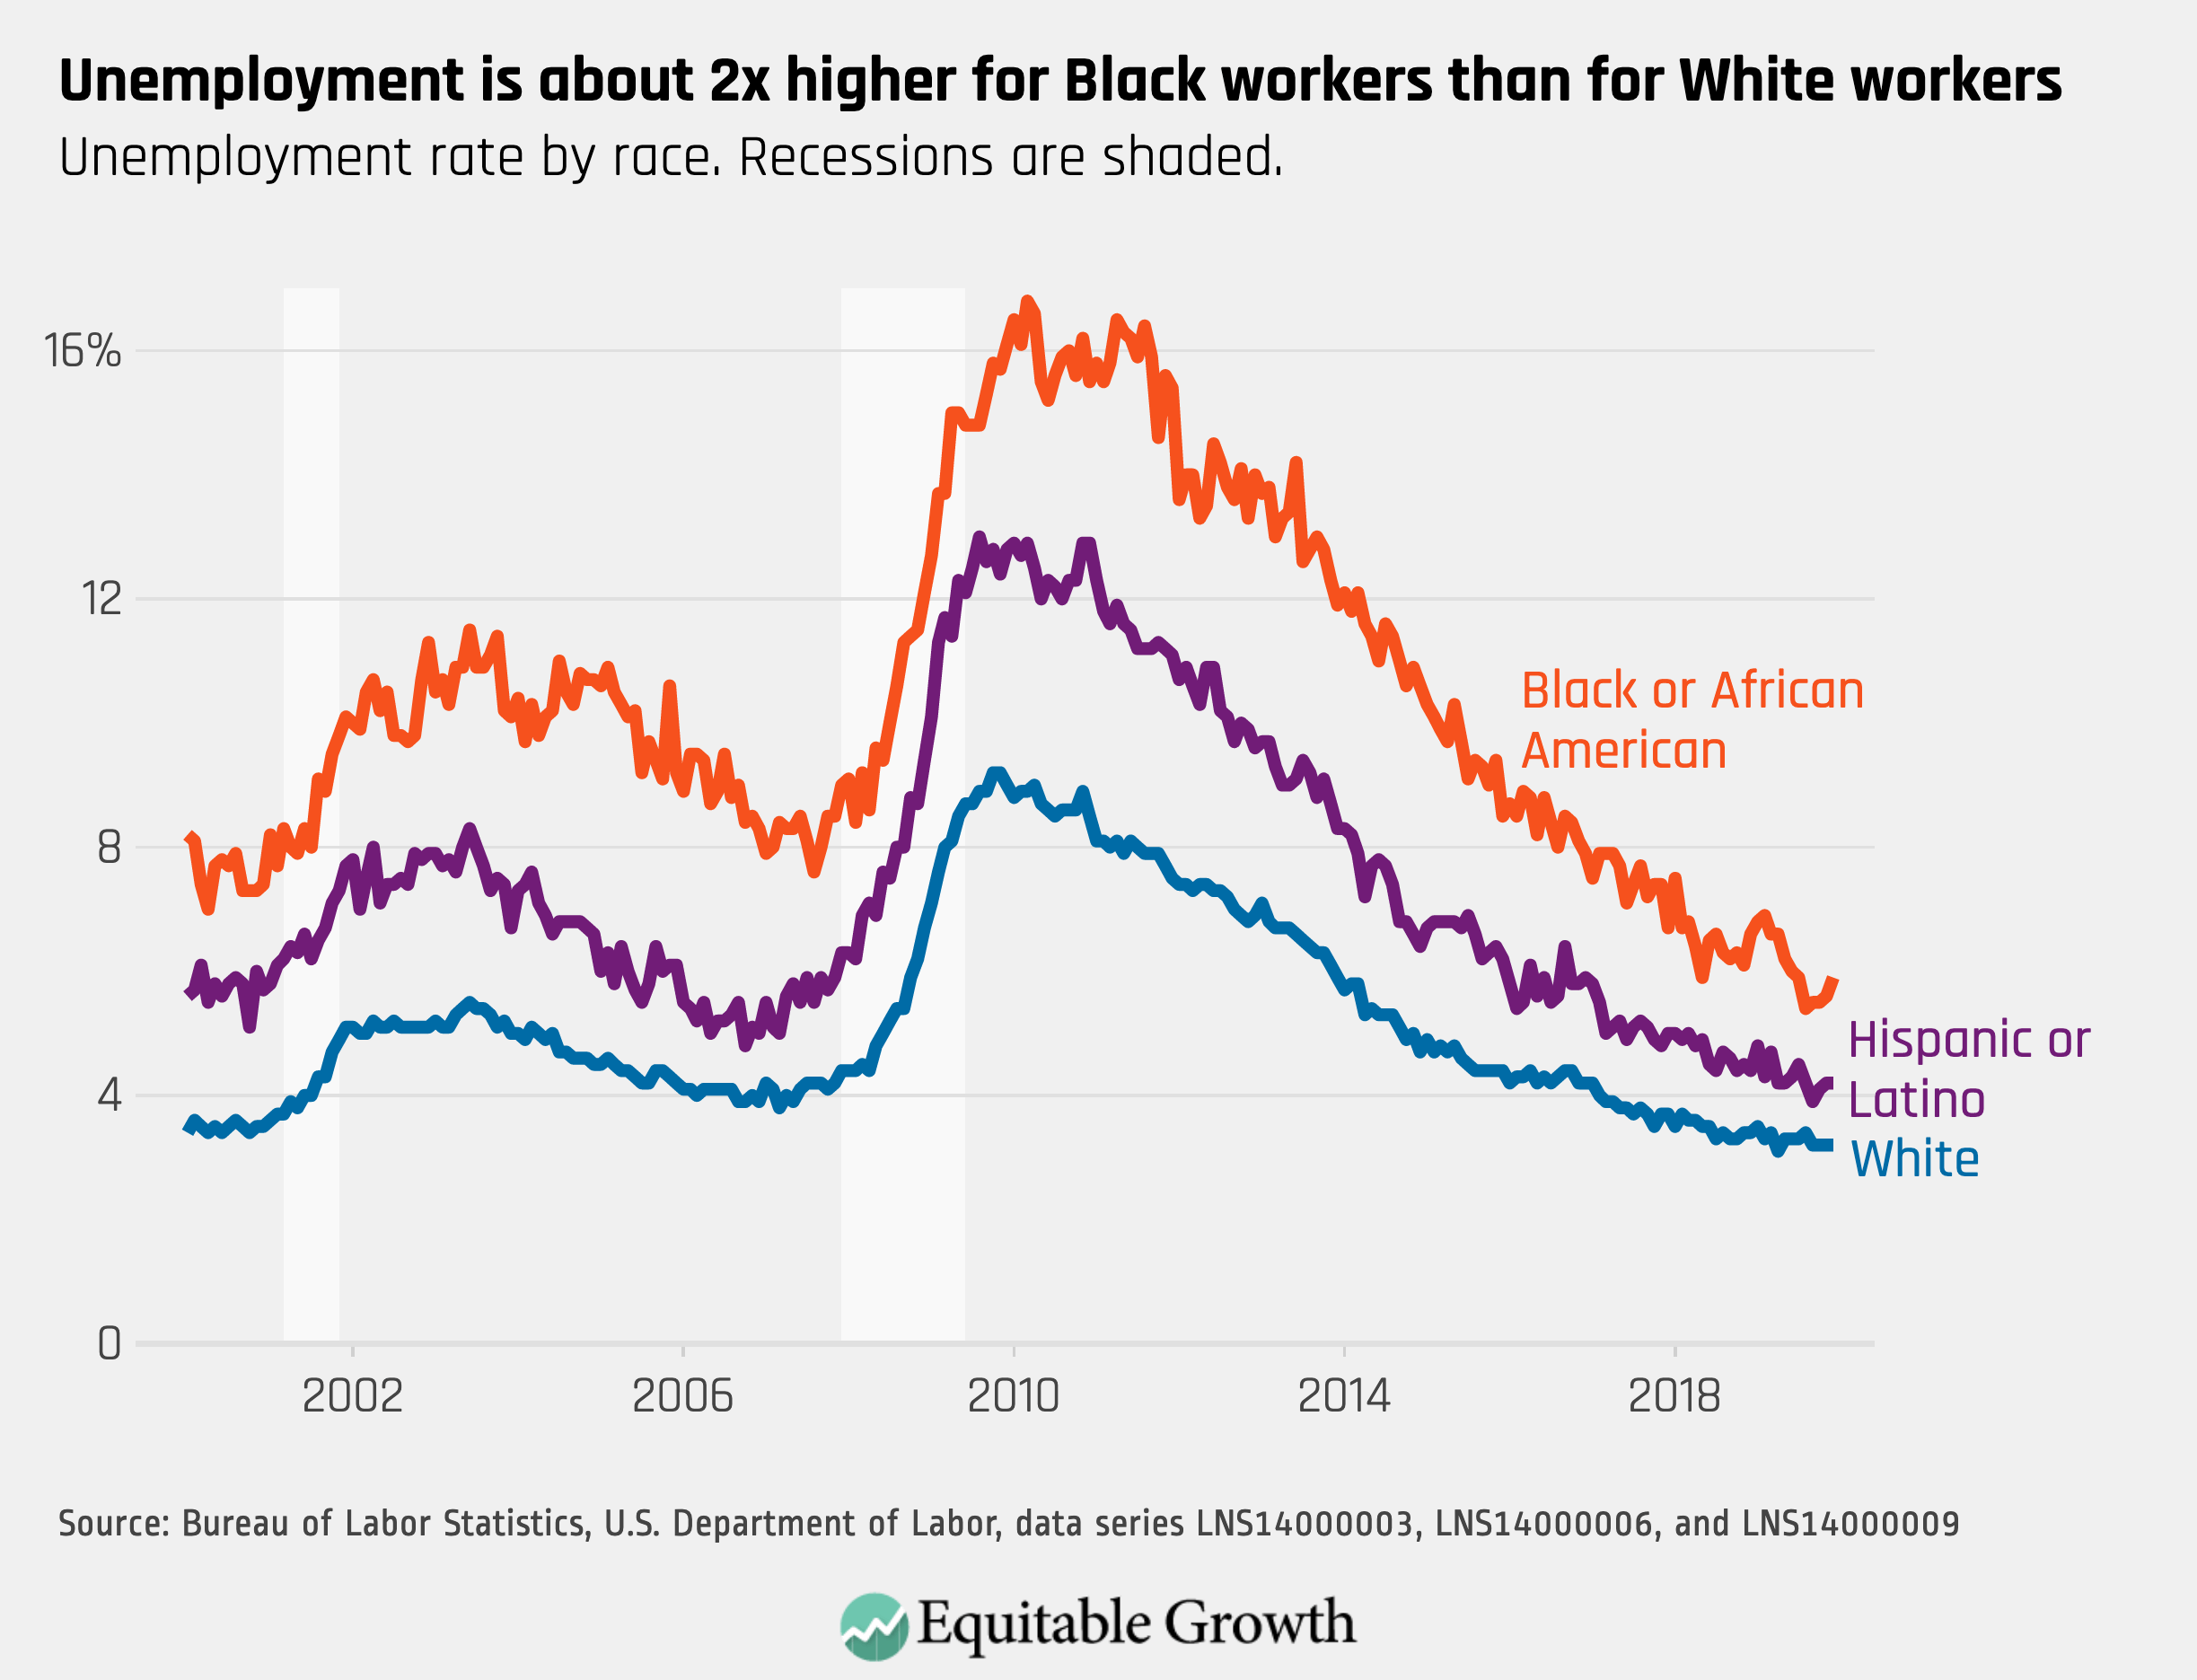
5.
White unemployment has been declining slightly over the past few months while African American and Hispanic unemployment has been increasing slightly, showing the stratified labor markets diverging since the fall.