Should-Read: Andrew Harless: Employment, Interest, and Money: James Medoff, Stagflation, the Phillips Curve, and the Greenspan Boom

Should-Read: My memory is that Andrew was a full coauthor on this work. And it certainly profoundly influenced us over at the Treasury–it definitely shaped how Bentsen talked to Greenspan…

Andrew Harless (2013): Employment, Interest, and Money: James Medoff, Stagflation, the Phillips Curve, and the Greenspan Boom: “James Medoff, my thesis advisor in graduate school and later my collaborator and business associate, died on Saturday, September 15 after a long struggle with multiple sclerosis…

…I was a student of macroeconomics…. Why was there stagflation (stagnation and inflation at the same time) in the 1970’s?  When I was in graduate school, there were two popular (complementary) explanations. First, the Fed had been too easy because it didn’t adequately account for the way inflation expectations would become ingrained…. Second, there were oil shocks, shocks to aggregate supply which drove prices up and employment down.  A third explanation you might also hear was that the Fed had responded to political pressure from the Johnson and Nixon (and possibly Carter) administrations and loosened at the wrong times…. Medoff-Abraham… said… that there was not nearly as much “stag” in the stagflation as we thought… [because] the unemployment of the 1970’s was largely “structural” (at least that’s the term used in debates about today’s unemployment), and once you realized that, the accompanying inflation shouldn’t surprise you.

When I took James’ graduate course in 1989, this idea was particularly important, because the situation was beginning to reverse itself.  The plateau in structural unemployment lasted from maybe 1975 to maybe 1987, and after that it began to decline.  By the time I graduated, in 1994, this decline was well underway, and our data were suggesting that the US economy could support considerably lower unemployment rates without sparking inflation.  James was invited to the Fed’s meeting of academic consultants that year to make the case for lower unemployment, and I went along to help and observe the discussion.  As I recall, there were about 10 people at the table, and James was the only one saying that it was OK to keep interest rates low and let the unemployment rate fall further.

Naturally, rather than listen to a single maverick, the Fed kept raising rates, and maybe that was for the best, since the recovery turned out to be stronger than most people (including us) had expected.  But over the next few years, something unusual happened.  The unemployment rate kept coming down, and the inflation kept not happening, and now it was Alan Greenspan himself, not some out-of-the-mainstream labor economist from Harvard, who was insisting (against some substantial resistance) that it was OK to keep interest rates low and let the unemployment rate continue falling.

Did James Medoff ultimately influence monetary policy, and was he therefore partly responsible for the boom of the late 1990’s?  Who knows?  If I had Alan Greenspan’s ear, I might ask him.  At his funeral, James’ daughter Susanna said that, in fifth grade, she had wanted to dress up as her father for “Dress as Your Hero Day,” but the teacher wouldn’t let her, so she dressed as Alan Greenspan instead.  In those days, a lot of adults may have considered Greenspan a hero, but I doubt many other fifth graders did.  For the record, I still think Greenspan did a remarkable job with the macroeconomic aspects of monetary policy, and his hero status (since rescinded by most commentators) was not without justification.

In any case, I feel that the research I mentioned is relevant today in a couple of ways.  For one thing, the saga of structural-vs-cyclical unemployment goes on today.  Using techniques similar to those used by Abraham and Medoff, my best guess is that, after the long decline that began around 1988, structural unemployment reached a trough in 2005 and has been rising since then.  (However, I see no particular evidence of a discontinuous increase during the Great Recession, or immediately before or after, and the increase since 2005 has not been particularly rapid, so I don’t buy the view that “our problem is structural.”)

Another way the research is relevant is that it reframes the 1970’s.  By the end of the 1970’s, most economists were convinced that, as textbooks put it during my undergraduate years and maybe still do, “the long-run Phillips curve is vertical.”  In other words, there is no long-run tradeoff between unemployment and inflation.  In the minds of most economists this conclusion was necessitated by the experience of the 1970’s, during which it seemed to become obvious that higher inflation was not generally associated with lower unemployment.  But if much of the problem of the 1970’s was structural, then the conclusion is not so obvious.  Perhaps, conditioning on the structure of the labor market, a downward-sloping Phillips curve still exists, even in the long run.  Indeed, more recent evidence suggests that there is such a tradeoff after all, at least at low inflation rates.

This is important because the US seems to be in the middle of that tradeoff right now.  If you believe there is no tradeoff, if you believe the long-run Phillips curve is vertical, then it’s hard to explain how there’s still any inflation at all after almost 5 years during which we had first an extremely deep recession and then a painfully slow recovery that has left output still well below any reasonable estimate of the economy’s potential.  After 5 years, we should surely be making our way toward the long run, that vertical Phillips curve at full employment. If we’re not, it must be because demand is astonishingly weak, and that astonishingly weak demand should be associated with an inflation rate that falls lower and lower until it becomes negative. (This is the flip side of an overheated economy that produces ever-accelerating inflation.) But that isn’t happening. Instead we’re seeing something that looks a little bit like the old-fashioned downward-sloping static Phillips curve, where low, but not necessarily falling, inflation rates are associated with persistent excess unemployment.

I admit this isn’t what I expected. I wrote a blog post a couple of years ago predicting deflation. Even after having questioned the conventional wisdom, I had found it too strong to resist. The vertical long-run Phillips curve, I thought, might not be quite right, but it was “a close enough approximation,” and if I denied this, I’d face excommunication from the Church of Macroeconomics. Deflation was coming, I thought.  I was wrong.

I never got a chance to discuss this question with James. During his last years he found it increasingly difficult to think and express himself clearly, so it’s unlikely we could have had a productive discussion. But I can imagine what he would have said 20 years ago. He would have talked about his contacts in industry and how they weren’t about to destroy morale by cutting wages, even if the economy stayed weak for several years. After some discussion I think we would have come to the conclusion that the vertical long-run Phillips curve was actually a pretty crummy approximation. That’s certainly what I think now. I’m going to have to pay more attention in the future to what Hypothetical James Medoff has to say. He lives on.

U.S. tax revenue will rise modestly in the next 10 years, no thanks to corporate taxes

Photo of the Internal Revenue Service (IRS) headquarters building in Washington.

The Congressional Budget Office’s latest budget and economic outlook for 2017 and beyond estimates that overall federal tax revenue will be on the rise over the next decade if current tax laws remain unchanged. Yet the CBO also anticipates that this growth in tax revenue will be tempered by decreases in receipts from specific sources, including the payroll tax and the corporate income tax.

The report forecasts that revenues will grow modestly relative to U.S. gross domestic product between this fiscal year ending September 30th and 2027. A majority of this growth is expected to be driven by an increase in revenues from individual income taxes, which will rise from 8.6 percent of GDP in 2017 to 9.7 percent of GDP by 2027 thanks to “bracket creep,” an aging population that will begin accessing more and more retirement income, and fast-growing earnings for those at the top of the income ladder. Revenues from payroll taxes and other taxes, which includes the excise, estate, and gift taxes, will see small declines from 6.0 percent and 1.5 percent of GDP to 5.9 percent and 1.2 percent of GDP in 2027, respectively.

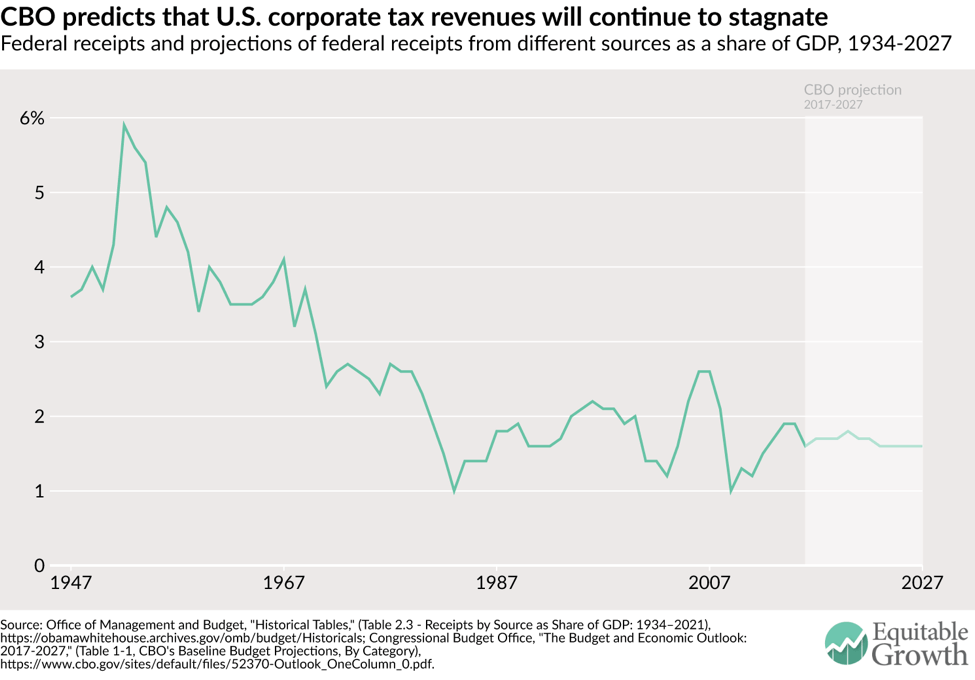
The trends in corporate tax revenues, however, are an interesting case. In fiscal year 2017, receipts from corporate income tax are expected to amount to 1.7 percent of GDP. By 2027, the Congressional Budget Office anticipates that these revenues will fall by 0.1 percentage point to 1.6 percent of GDP. This small predicted drop is actually part of a longer trend: In the United States, corporate tax revenues as a share of the economy have been relatively stagnant since the mid-1980s. (See Figure 1).

Figure 1

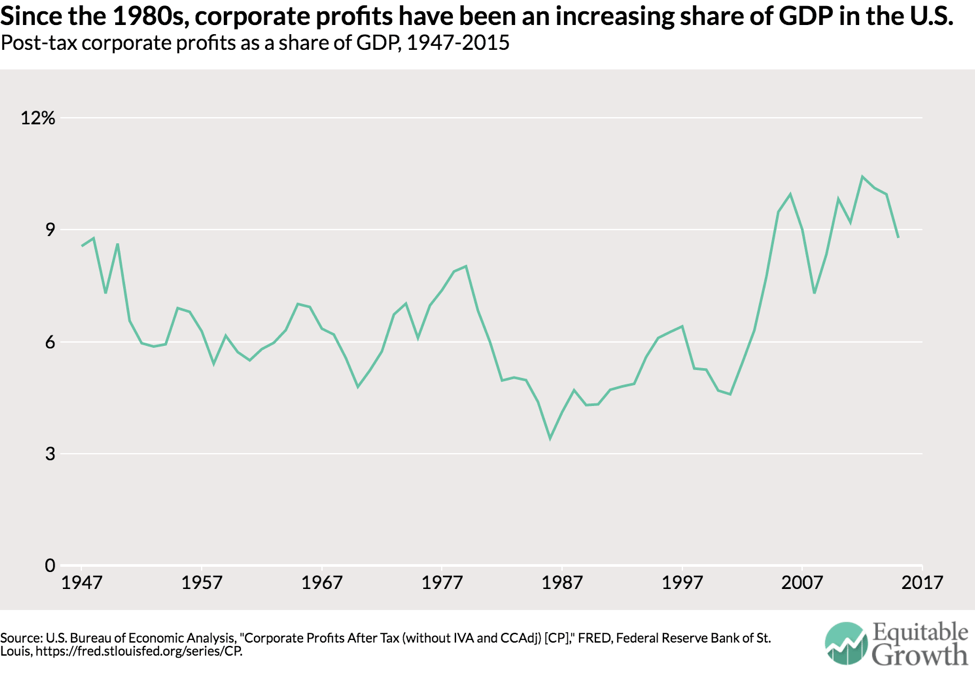
Over this same period, though, corporate profits have grown sharply. Between 1985 and 2015, corporate profits as a share of GDP rose by 4.4 percentage points. (See Figure 2.)

Figure 2

Rising corporate profits in a time when corporate tax revenues remain relatively stable suggests that effective corporate tax rates are declining. In fact, in their models, the Congressional Budget Office assumes that businesses and investors will continue to find new ways to reduce their tax rates, which is part of the reason that corporate receipts face a small decrease in the next decade. The continued erosion of corporate tax revenues will have long-term effects on total federal revenues and could even contribute to a further rise in income inequality.

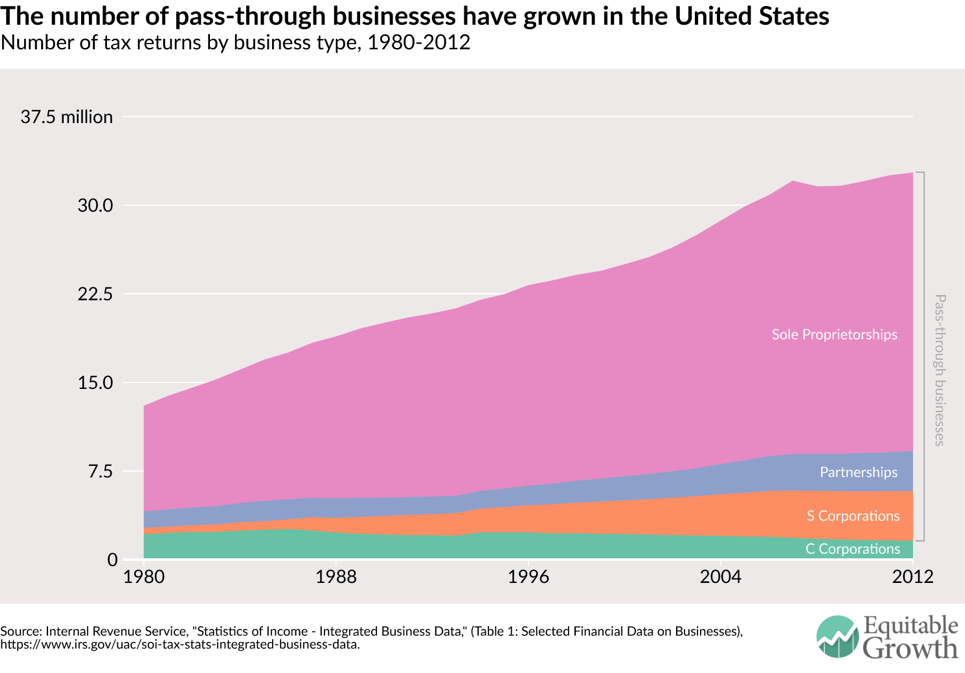
One strategy that businesses use to reduce their tax rates is to organize as a pass-through business, effectively reducing the tax base for the corporate income tax. S Corporations, Sole Proprietorships, and Partnerships are all considered to be pass-through businesses because the profits from these firms are not subject to corporate income taxes. Instead, the profits can be “passed-through” to the business owners and taxed only on their individual income tax returns. In contrast, owners of traditional C Corporations face two taxes: a corporate tax on profits and a tax to shareholders on profits that are distributed as dividends. The clear advantage of setting up as a pass-through business has greatly motivated owners to find loopholes, which has augmented their presence in the United States. (See Figure 3.)

Figure 3

Another strategy that businesses are increasingly using is corporate profit shifting. Corporate profits, for example, can be shifted out of the United States by increasing intercompany loans,  setting high transfer prices, or using a process known as corporate tax inversion. According to research by Kimberly Clausing of Reed College, who uses data from the U.S. Commerce Department’s Bureau of Economic Analysis, corporate profit shifting in 2012 alone reduced tax revenues by between $77 billion and $111 billion.

Again, if all current laws and tax codes remain unchanged, the Congressional Budget Office predicts these strategies will be used at a greater rate and corporate tax revenue will continue to stagnate as a share of GDP and actually fall relative to total corporate profits in the economy. But, with tax reform looming as a top priority for the Trump Administration and Congress, business may not stay as usual.

Speaker of the House Paul Ryan’s blueprint for tax reform—the likely template for Congress—would make several major changes to the corporate income tax code that would slash corporate tax revenues over time. Some of these changes include reducing the marginal tax rate on corporate profits from 35 percent to 20 percent and capping the tax rate on pass-through business profits at 25 percent. A recent analysis of the House of Representative’s plan by the Tax Policy Center found that if the House blueprint were implemented, $3 trillion in tax revenue would be lost over the next ten years. The TPC estimates that close to two-thirds of those losses would come from changes to the corporate tax code. What’s more, there is skepticism that the Ryan plan would lessen incentives for creating pass-through entities or fully stop U.S. corporations from shifting their profits to earn most of their income overseas in the first place.

Whether laws and tax codes remain the same or are reformed according to the House blueprint, it is clear that over the next decade corporate tax revenues need to be better preserved. Given that corporate taxes are one of the most progressive taxes in the federal system, policymakers must consider a way to recoup these losses or else we’ll be saddled with even wider income inequality.

Why the United States still needs paid family and medical leave

Senator Kirsten Gillibrand (D-NY) and Representative Rosa DeLauro (D-CT) yesterday reintroduced their bill to establish a federal paid family and medical leave program—the FAMILY Act. First introduced in 2013, the bill would give mothers and fathers 12 weeks of job-protected leave at 66 percent wage replacement—funded by a 0.4 percent increase in the payroll tax, split evenly between employers and employees. The Trump administration also is on record supporting paid leave for new mothers (and recently indicated it may consider paid leave for new fathers), though it has not specified how to pay for the program. With these efforts by policymakers in mind, it’s a good opportunity to briefly look at the policy landscape for paid leave and the economics of job protected leave.
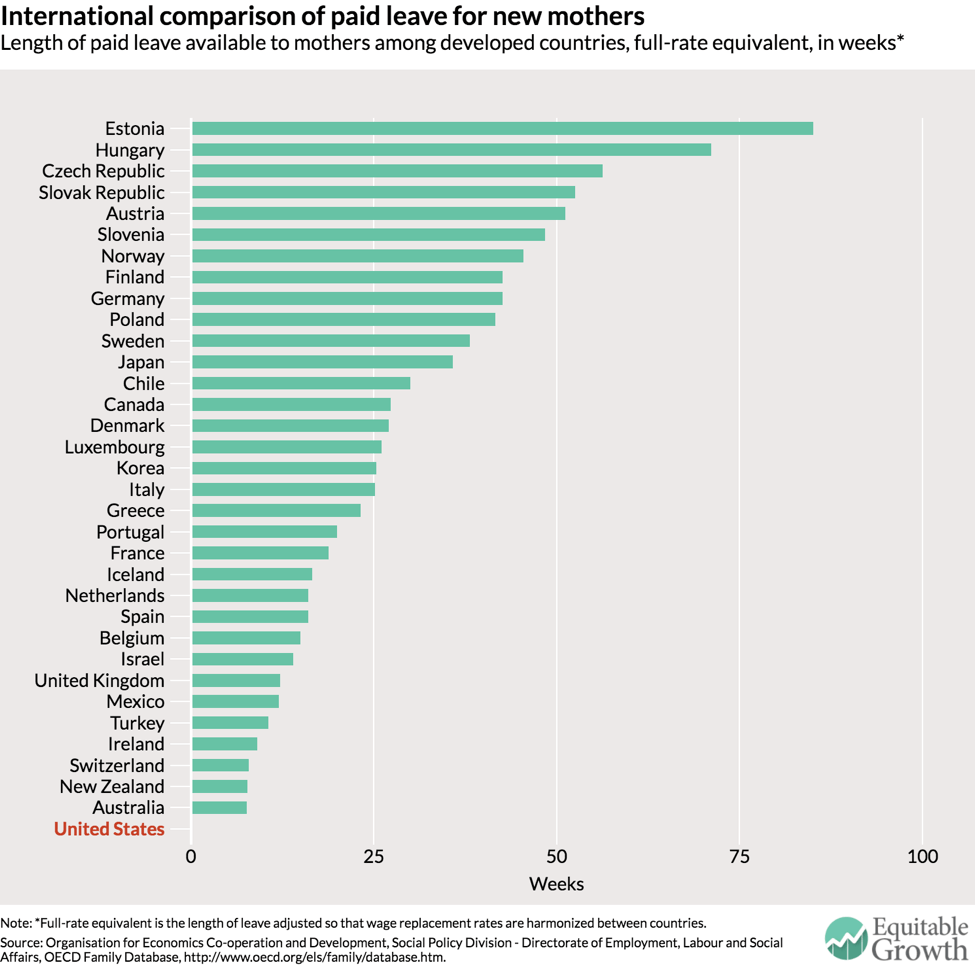
Internationally, the United States is a major laggard on expenditures on childcare and work-life benefits, and is alone among member countries of the Organisation for Economic Co-operation and Development in not providing any paid leave to new mothers. (See Figure 1.)

Figure 1

Within the United States, California, New Jersey, Rhode Island, and New York have enacted paid leave programs, and the District of Columbia has recently passed a version of its own—it just awaits Mayor Muriel Bowser’s signature. All in all, 13 percent of workers in the United States have access to paid family and medical leave through state and local paid leave programs, as well as private employer plans.

These state and local programs provide insights into the economic effects of paid leave. In California, where workers can take up to six weeks of paid leave, researchers find that following implementation not only were workers much more likely to take leave following the birth of a child, but they more often returned to work following their period of leave. In the three years following child birth, researchers find that hours worked increased by 10 to 17 percent. Among women who were employed during their pregnancy, paid family leave raised the probability of returning to work within a year of childbirth by 10.5 percentage points. Cross-national evidence (including California) shows that female employment rates increased by about 2.5 percent relative to their male counterparts with the introduction of paid leave.

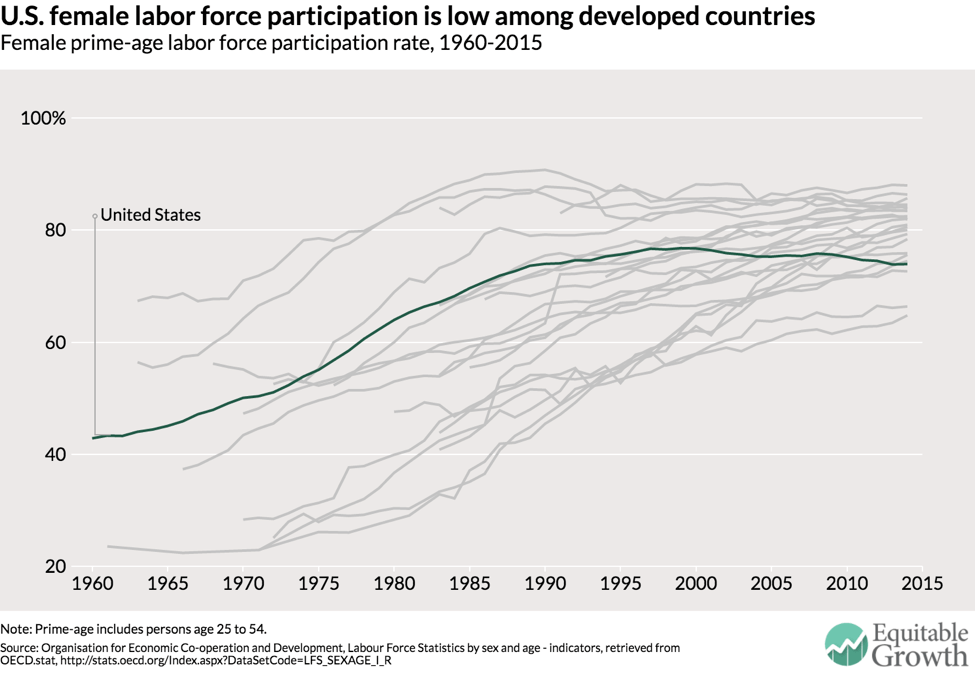
Since 1948, when data was first collected, U.S. labor force participation for women ages 16 to 64 was 32 percent. Today, that number has only risen to 56.8 percent. The difference is even more stark for prime-age workers, or those between the ages of 25 and 54, which economists use to control for demographic changes. Prime age participation grew from 38.9 percent to 73.4 percent from 1955 to 2015. Yet since the mid-1990s this progress has stalled out and even reversed slightly. Meanwhile, other advanced economies have seen women enter their labor forces unabated. The U.S now ranks 21st out of 24 OECD countries in prime-age female labor force participation. (See Figure 2.)

Figure 2

Research suggests this decline is largely due to a lack of work-life policies at the national level, and that the availability of paid leave increases the labor force participation rate of women. An influential examination of the economics of paid leave in Europe by University of Virginia economist Christopher Ruhm finds that paid family and medical leave programs raised the employment-population ratios of women by 4.2 percent.

Paid leave is not just a policy that would improve the individual lives of those who struggle to balance their responsibilities as a worker and as a caregiver. Paid leave also would boost U.S. economic growth and further equalize labor market disparities between men and women. The people who are left on the sidelines aren’t just missing out on income for themselves and their families, but they represent missing productive capacity for the entire economy.


JOLTS Day Graphs: December 2016 Report Edition

Every month the U.S. Bureau of Labor Statistics releases data on hiring, firing, and other labor market flows from the Job Openings and Labor Turnover Survey, better known as JOLTS. Today, the BLS released the latest data for December 2016. This report doesn’t get as much attention as the monthly Employment Situation Report, but it contains useful information about the state of the U.S. labor market. Below are a few key graphs using data from the report.

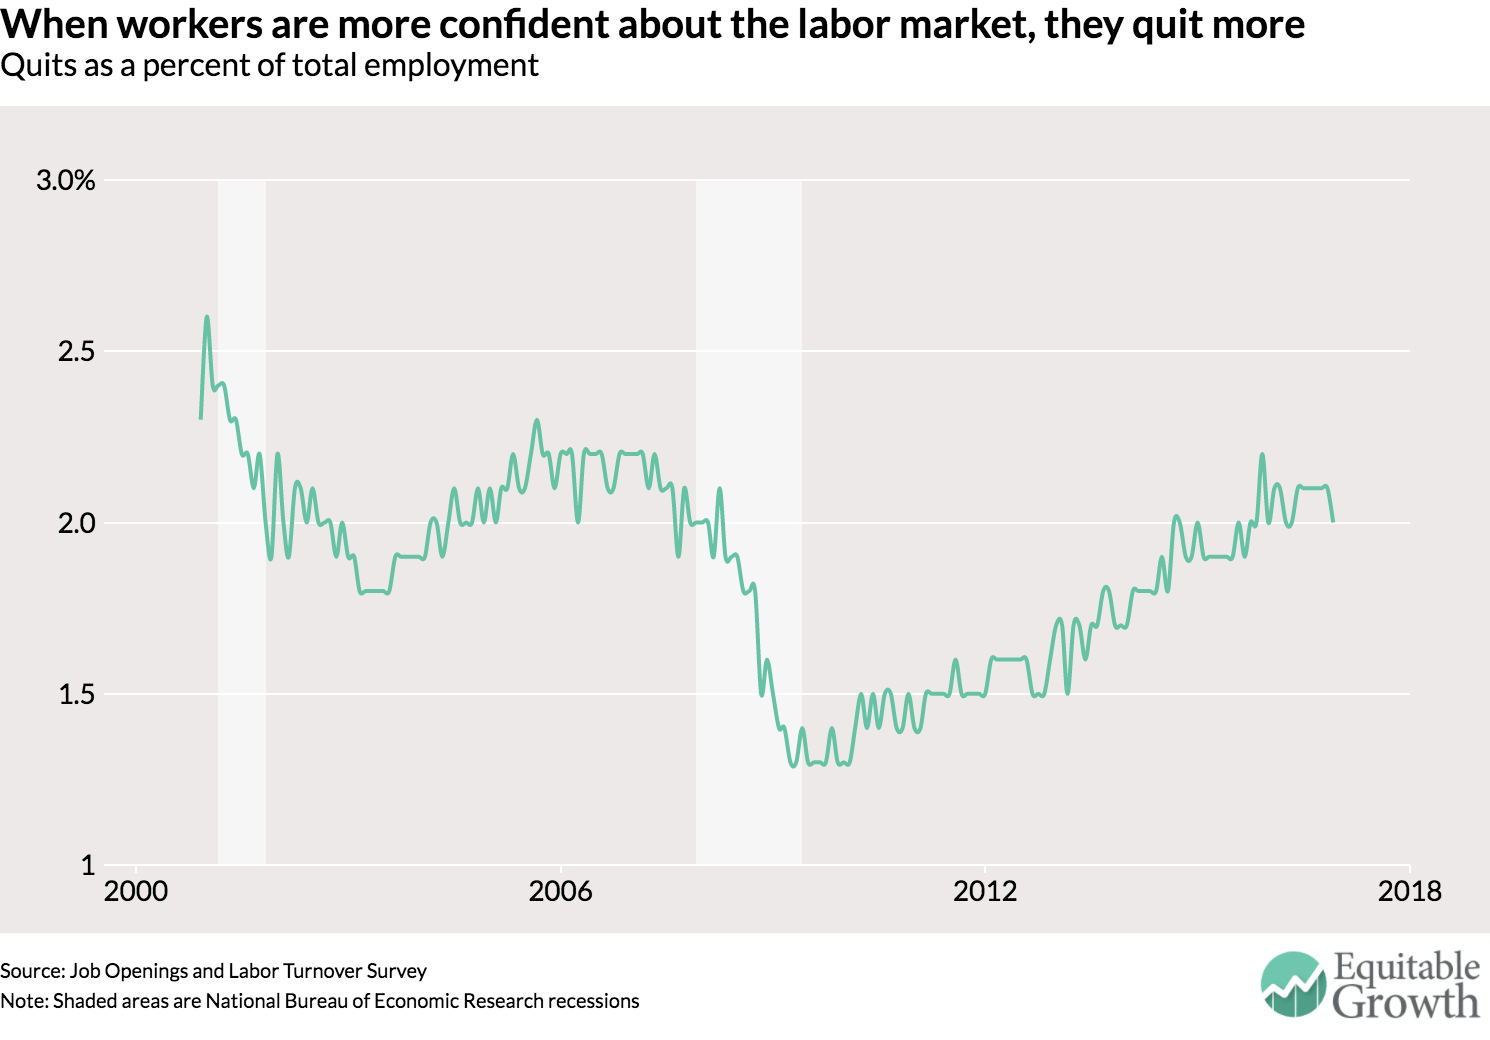
The quits rate dropped in December in 2 percent. The quits rate is at pre-recession levels, though other data show quitting and job-switching was more common during the late 1990s.

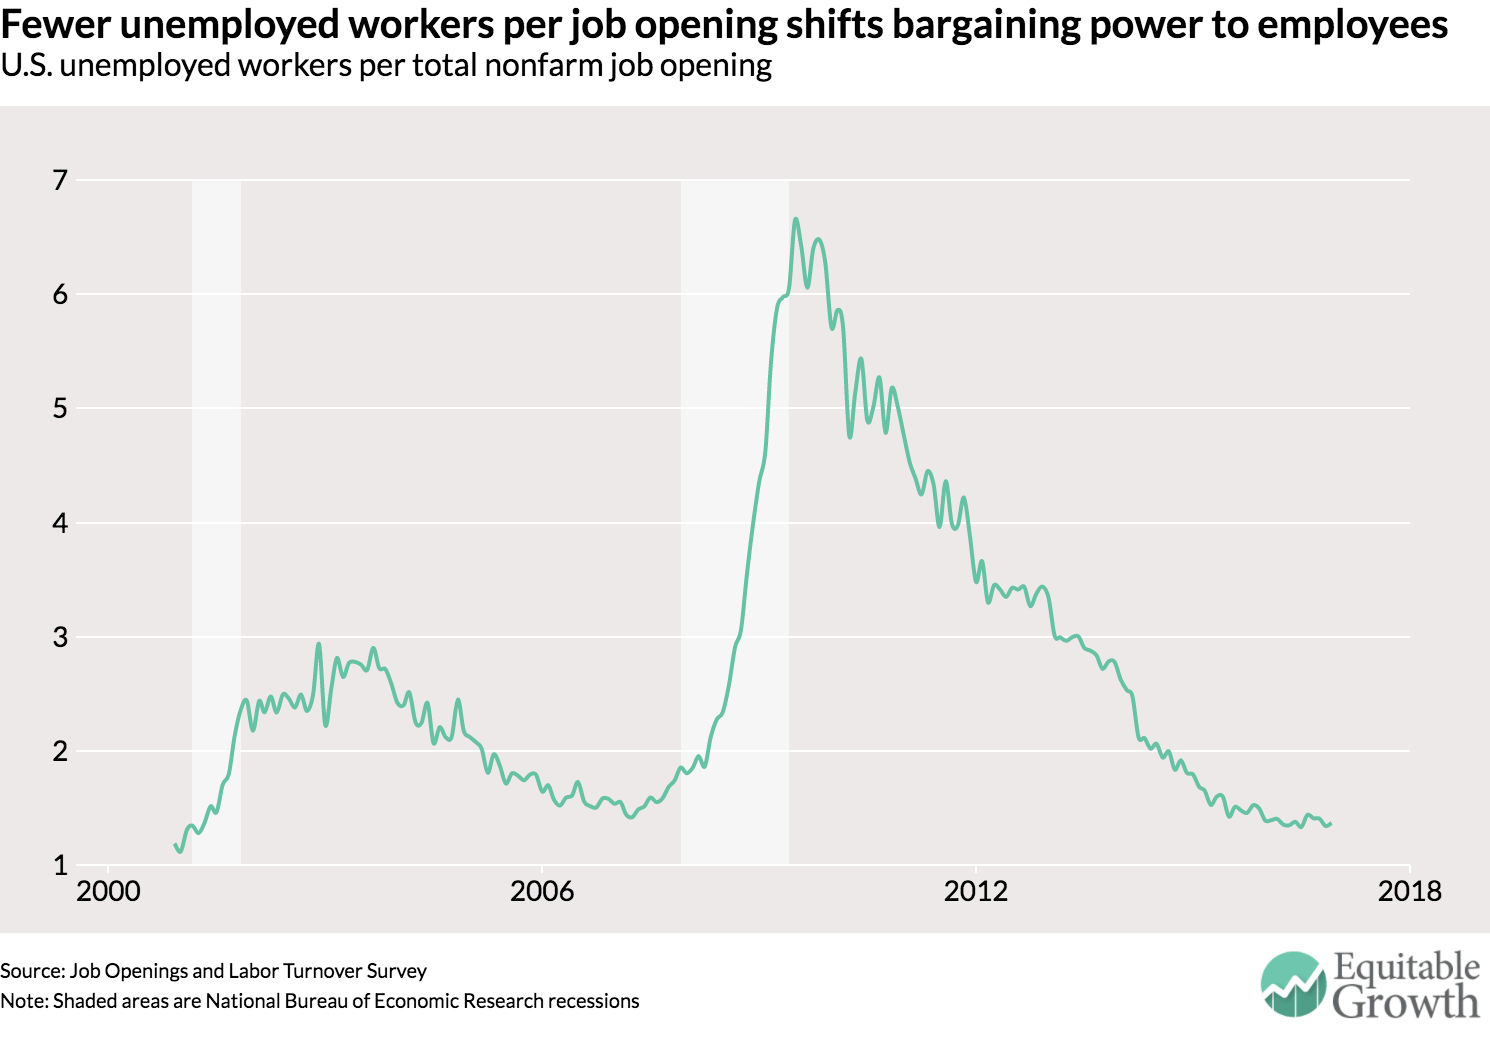
The decline in the unemployment-to-job-opening ratio has slowed in recent months. If this is due to an increasing labor force, then the slowdown might have a silver lining.

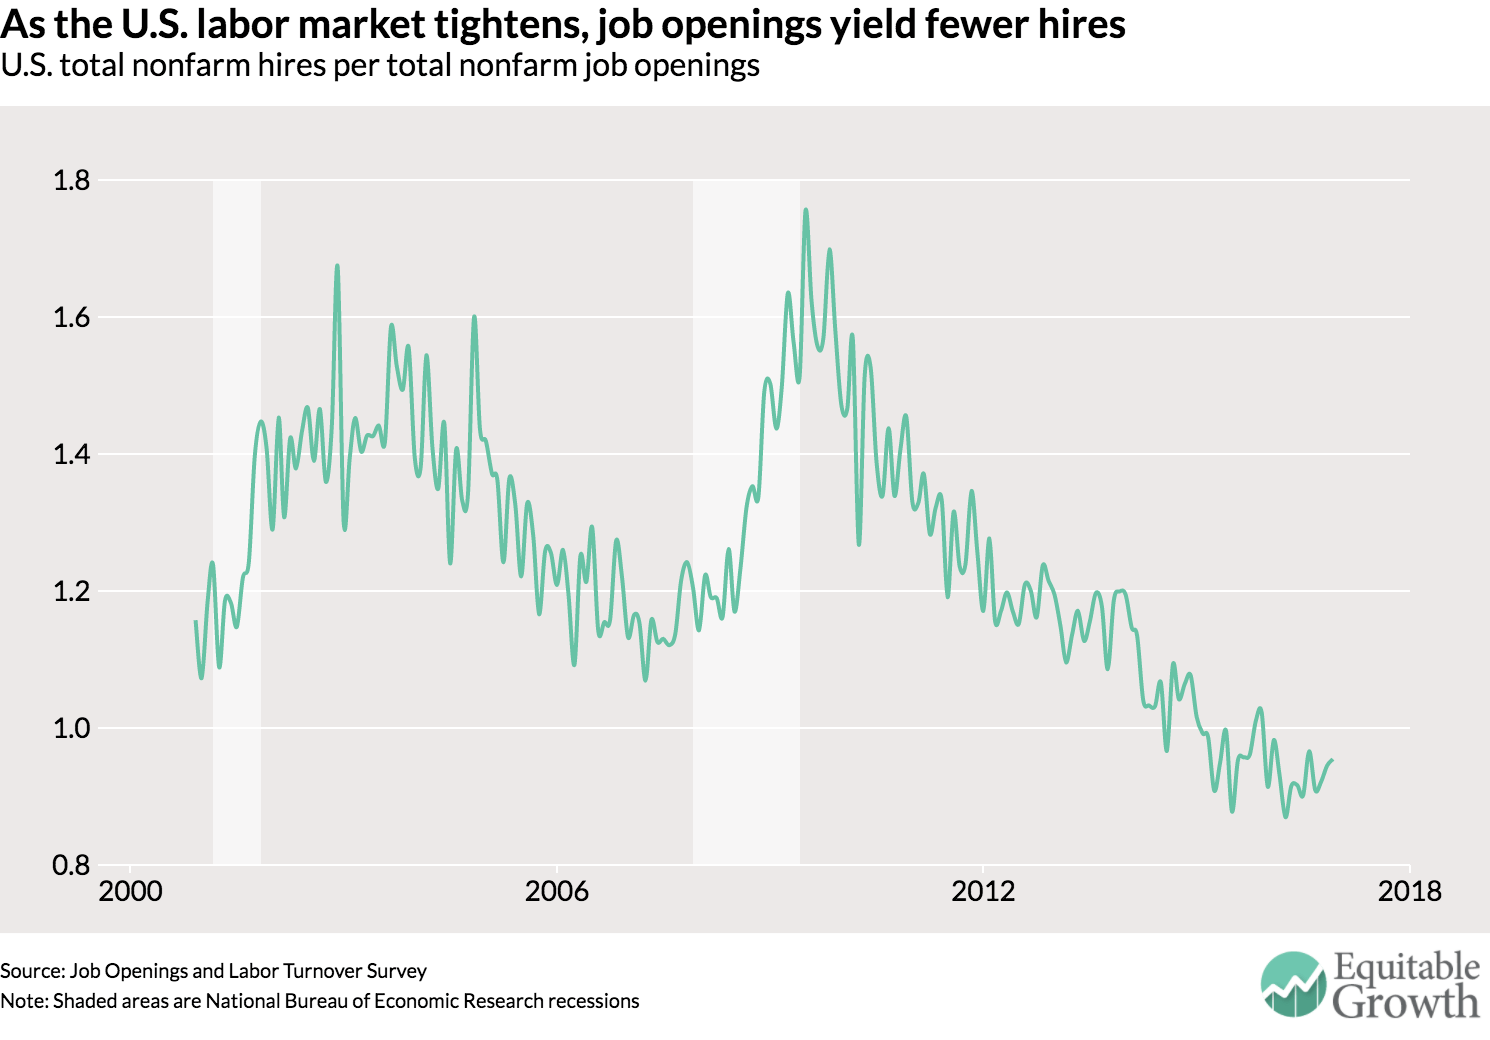
The vacancy yield was essentially unchanged in December, but the overall trend is downward as the labor market tightens. If job openings continue their strong growth, then the decline in the yield of few hires per job openings could continue for quite some time.

What’s behind the decline in U.S. interest rates?

Photo of the Marriner S. Eccles Federal Reserve Board Building in Washington, D.C.

There are many ways to think about secular stagnation, but one particularly useful way is to look at the natural rate of interest. Secular stagnation can be thought of as the idea that the natural rate of interest, or the interest rate at which the economy is at full potential, is permanently negative. The long-term decline in interest rates across high-income countries poses significant problems for macroeconomic policy if the Federal Reserve and other central banks can’t push interest rates low enough to drive the economy to potential during a downturn.

What’s behind the decline in interest rates? And could the trend be reversed anytime soon?

A new paper by economists Gauti Eggertsson of Brown University, Neil Mehrotra of the Federal Reserve Bank of Minneapolis, and Jacob Robbins of Brown University takes a look at secular stagnation and the forces behind declining U.S. interest rates.

The majority of the paper presents a model of the macroeconomy that allows for the natural rate of interest to be negative for an extended period. New Keynesian models, the kind mostly preferred by central banks, don’t allow for such a possibility. So let’s be clear that the results about the forces behind the decline in the interest rates are dependent upon this model being an accurate map of reality.

Using their model, Eggertsson, Mehrotra, and Robbins decompose the roughly 4 percent decline in the natural rate of interest since 1970. These factors all affect either the supply of savings or the demand for loans. The changes in the supply and demand end up changing the price of savings and the price of loans—the interest rate. They find four large forces that have affected the natural rate during the 45-year period: three that pushed the rate down and one that pushed it upward.

The first two factors are related to demographics. First, the decline in mortality helped push down the natural rate by about 1.8 percentage points from its 1970 level. As life expectancy increased, according to the paper’s model, then individuals had to save more for retirement, thus increasing the supply of savings. An increase in supply, all things being equal, will decrease the price of a loan—the interest rate. The second factor, also related to demographics, is the declining fertility rate in the United States as there are fewer births per woman. Fewer children reduces the demand for loans, which in turn depresses the interest rate. The three economists peg the influence of declining fertility at a 1.8 percentage point decline.

The third large factor behind declining rates is the decline in productivity growth. The rate of productivity increases have fallen significantly since the early 1970s, though there have been short periods of higher growth in the late 1990s. With slower productivity growth, households expect that income growth will be lower in the future (because their wages reflect that lack of productivity growth) and therefore save more. Again, an increase in the supply of savings leads to a decline in the interest rate: 1.9 percentage points in this case.

The one force increasing the interest rate over time in the model is the increase in government debt. More government debt, measured as a share of GDP, increases the interest rate as more government borrowing increases the demand for loans. The increase in demand is large enough that it pushed up the interest rate by a bit more than 2 percentage points since 1970.

Two other factors contribute to the changes in the natural rate: the declining labor share of income (a decline of 0.5 percentage points) and the declining price of capital goods (a decline of 0.4 percentage points).

Could any of these trends be reversed in the near future to boost interest rates? The authors look at how some of these factors would have to change in order to get the natural rate of interest up from roughly -1.5 percent to 1 percent, but those changes seem highly unlikely. Total factor productivity growth would have to accelerate from 2.4 percent despite the fact that sustained productivity growth of more than 2 percent hasn’t been seen since the 1970s. The fertility rate would have to jump by about 1.4 births per woman and the government debt would have to go from 118 percent of GDP to 215 percent.

In other words: Secular stagnation might be around for quite a time to come.

Should-Read: Thomas Black et al.: One Tiny Widget’s Dizzying Journey Shows Just How Critical Nafta Has Become

Should-Read: Thomas Black et al.: One Tiny Widget’s Dizzying Journey Shows Just How Critical Nafta Has Become: “Global trade involves a complex web of cross-border journeys, seamless and often invisible to American consumers…

…A single lowly capacitor, a pinkie tip-sized component that stores electrical energy…. We begin with a small Michigan company called Firstronic, which makes printed circuit boards for autoparts, such as automotive seat controls…. Firstronic… in Grand Rapids… buys the capacitor itself from… Centennial, Colorado… Arrow Electronics Inc., which imports the components from multiple suppliers in Asia. The capacitor is shipped to Ciudad Juárez, Mexico, where it is inserted into a circuit board. Then it heads to a U.S. warehouse just across the border…. The component then returns to Mexico, hauled to a Kongsberg Automotive factory in Matamoros. Kongsberg, a Norwegian company, assembles the circuit board into a seat actuator….

The control unit ships to… a Lear Corp. seat-manufacturing plant in Arlington, Texas…. Now traveling inside the finished seat, the capacitor is shipped a short distance to an auto assembly plant… the Ford Flex SUV at its factory in the Toronto suburb of Oakville…. The story of the little capacitor shows how intricately interconnected North American manufacturing operations have become…

Must- and Should-Reads: February 4, 2017


Interesting Reads:

Must-Read: Dan Nexon: The Trump Administration: It’s as Bad as it Looks

Must-Read: Dan Nexon: The Trump Administration: It’s as Bad as it Looks: “It will take about six minutes to watch Colin Kahl…

…former Deputy Assistant to the President and National Security Advisor to the Vice President, explain why:

Sean Spicer lied in his attempt to shift culpability onto the Obama Administration for the US raid in Yemen that killed an American serviceman and multiple civilians, as well as destroyed an MV-22 Osprey; and The conditions under which Trump authorized that raid—a dinner conversation with his son-in-law, the Defense Secretary, the Chairman of the Joint Chiefs of Staff, and a few others—was, shall we say, unusual for a major escalation in American military operations.

That six minutes is worth your time. There are real costs to having a President who is temperamentally, intellectually, and otherwise completely unqualified for his position. Those costs are magnified when his core advisors are total amateurs mainly interested in power, profit, or pushing extreme ideological agendas…

Must-Read: Jeff Engel: Robots Might Eat Your Job, But Being Human Could Get You A New One

Must-Read: But, unfortunately, teaching “creativity, empathy, teamwork, planning, problem solving, leadership, and so on” is very hard. And evaluating whether it is being successfully taught–whether the teaching of social engineering is any good–is even harder, in all likelihood because it may be easier to motivate the evaluators to give the teachers good scores than to motivate the students to learn…

Jeff Engel: Robots Might Eat Your Job, But Being Human Could Get You A New One: “Erik Brynjolfsson… ‘Will Robots Eat Your Job?’…

…The short answer is yes…. Automation has been transforming factories for years. But now, with advances in artificial intelligence technologies, automation is starting to also creep into fields that require less repetitive manual labor and perhaps seemed immune to this shift, such as law, healthcare, and journalism. “Machines are getting a lot better at many of these things,” Brynjolfsson said. “This a challenge we’re going to have to face, but I don’t think it’s a problem we have to face today…. There’s no shortage of work that can be done [only by humans] in the next 10 to 15 years.”… Educational institutions should focus instruction on areas where humans still have the advantage over machines. The examples he gave are mostly intangible characteristics and interpersonal skills: creativity, empathy, teamwork, planning, problem solving, leadership, and so on. “If we do that, I think we’ll have more people prepared to work alongside machines,” Brynjolfsson said. “Machines can help with a lot of that as well. There are educational technologies that can help identify the relative strengths and weaknesses of students and personalize things.”…

“We will get to a world where machines can do almost everything.” If handled in the right way, that “should be one of the best things that has happened to humanity”…. But it will require massive changes in how society operates… universal basic income or related programs so that people can sustain themselves. For now, Brynjolfsson wants to see leaders put more energy into solving more immediate issues, such as ensuring a skilled workforce and addressing stagnating wages…. “The most important thing we can do to address that is reinvent education and invest more in education.”