An update on the state of wealth inequality in the United States

The Federal Reserve yesterday released the 2016 version of its triennial Survey of Consumer Finances. The SCF reports data on income, assets, and debts for families in the United States. Below are four graphs on interesting trends in inequalities of wealth and net worth.
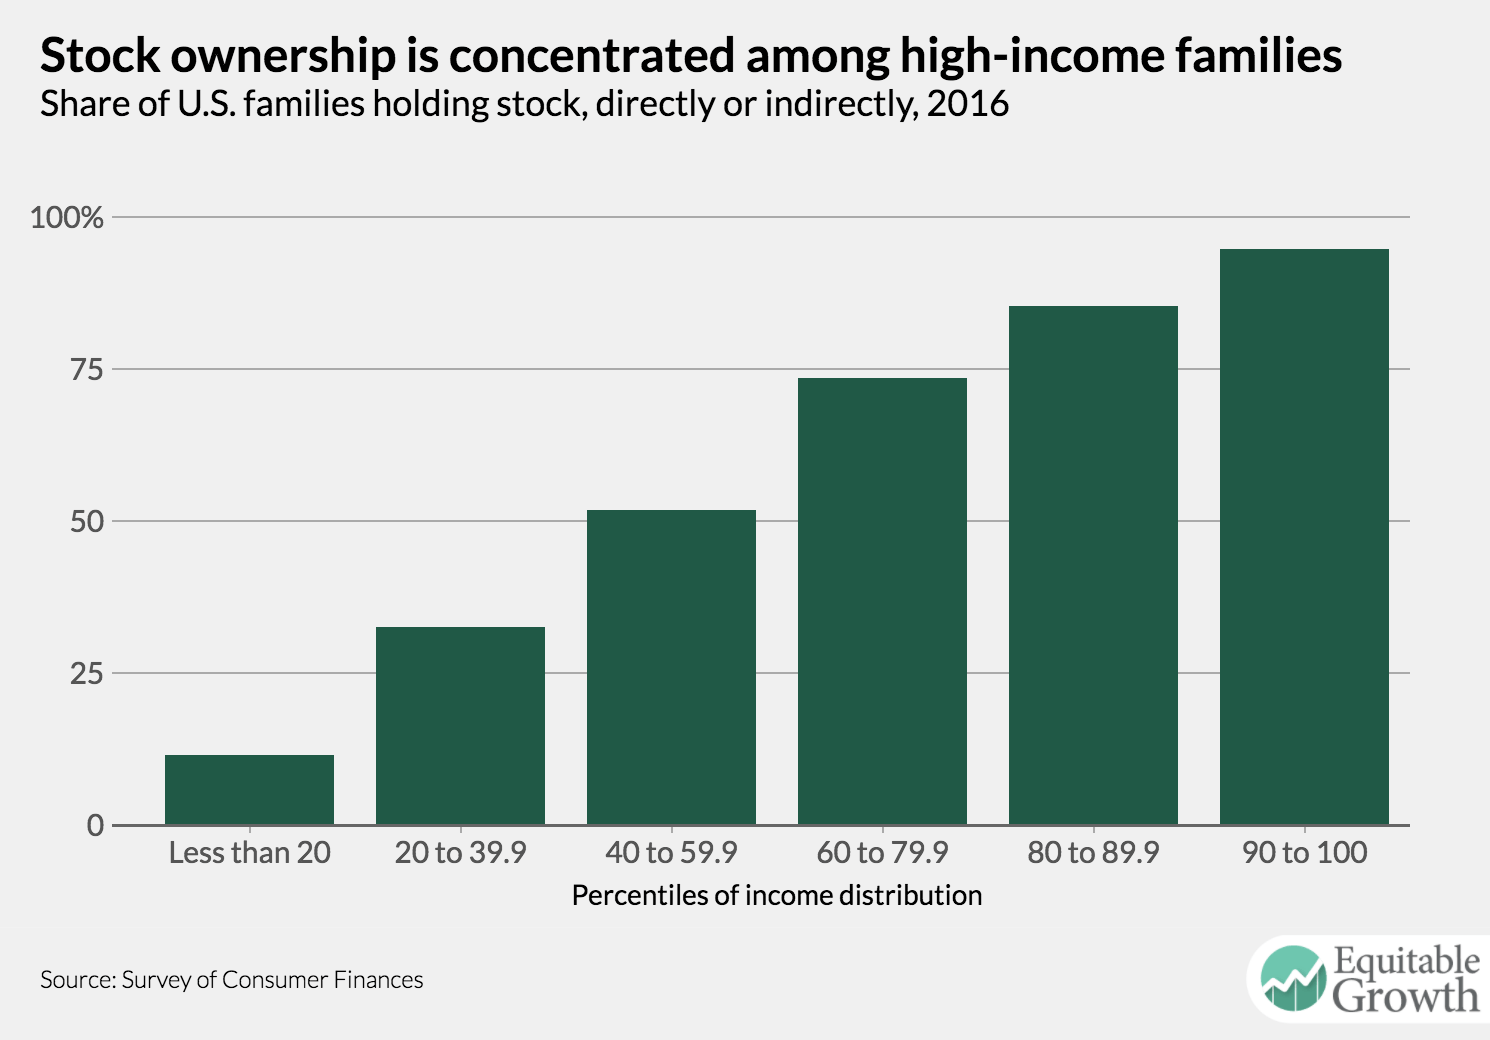
Figure 1
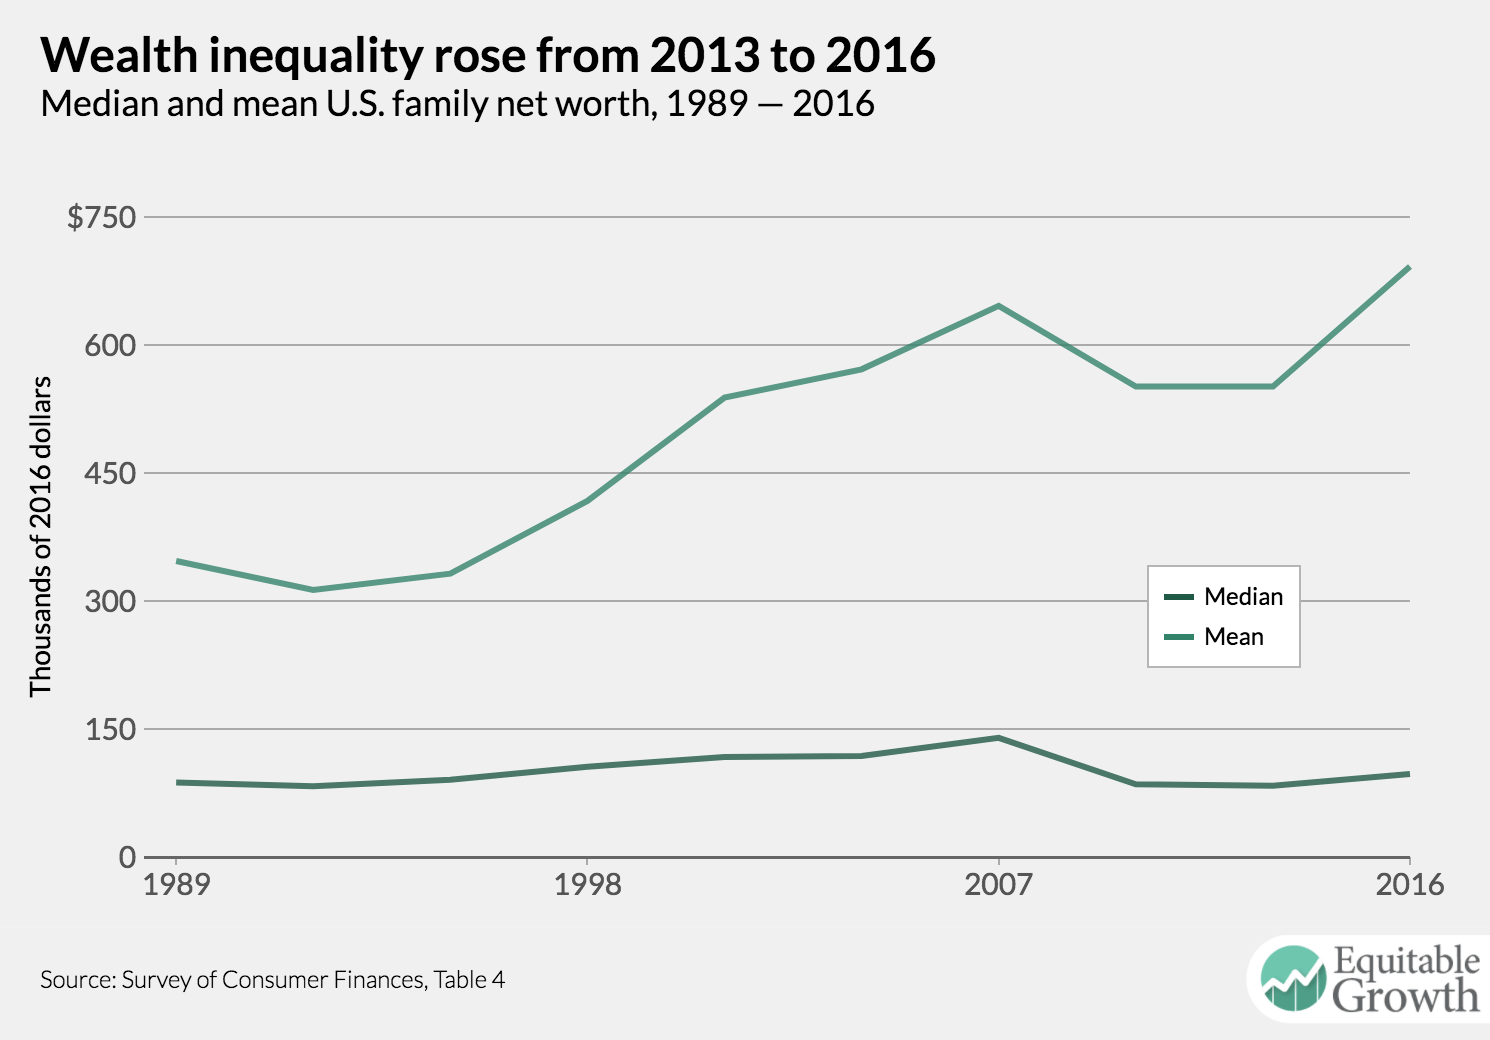
Figure 2
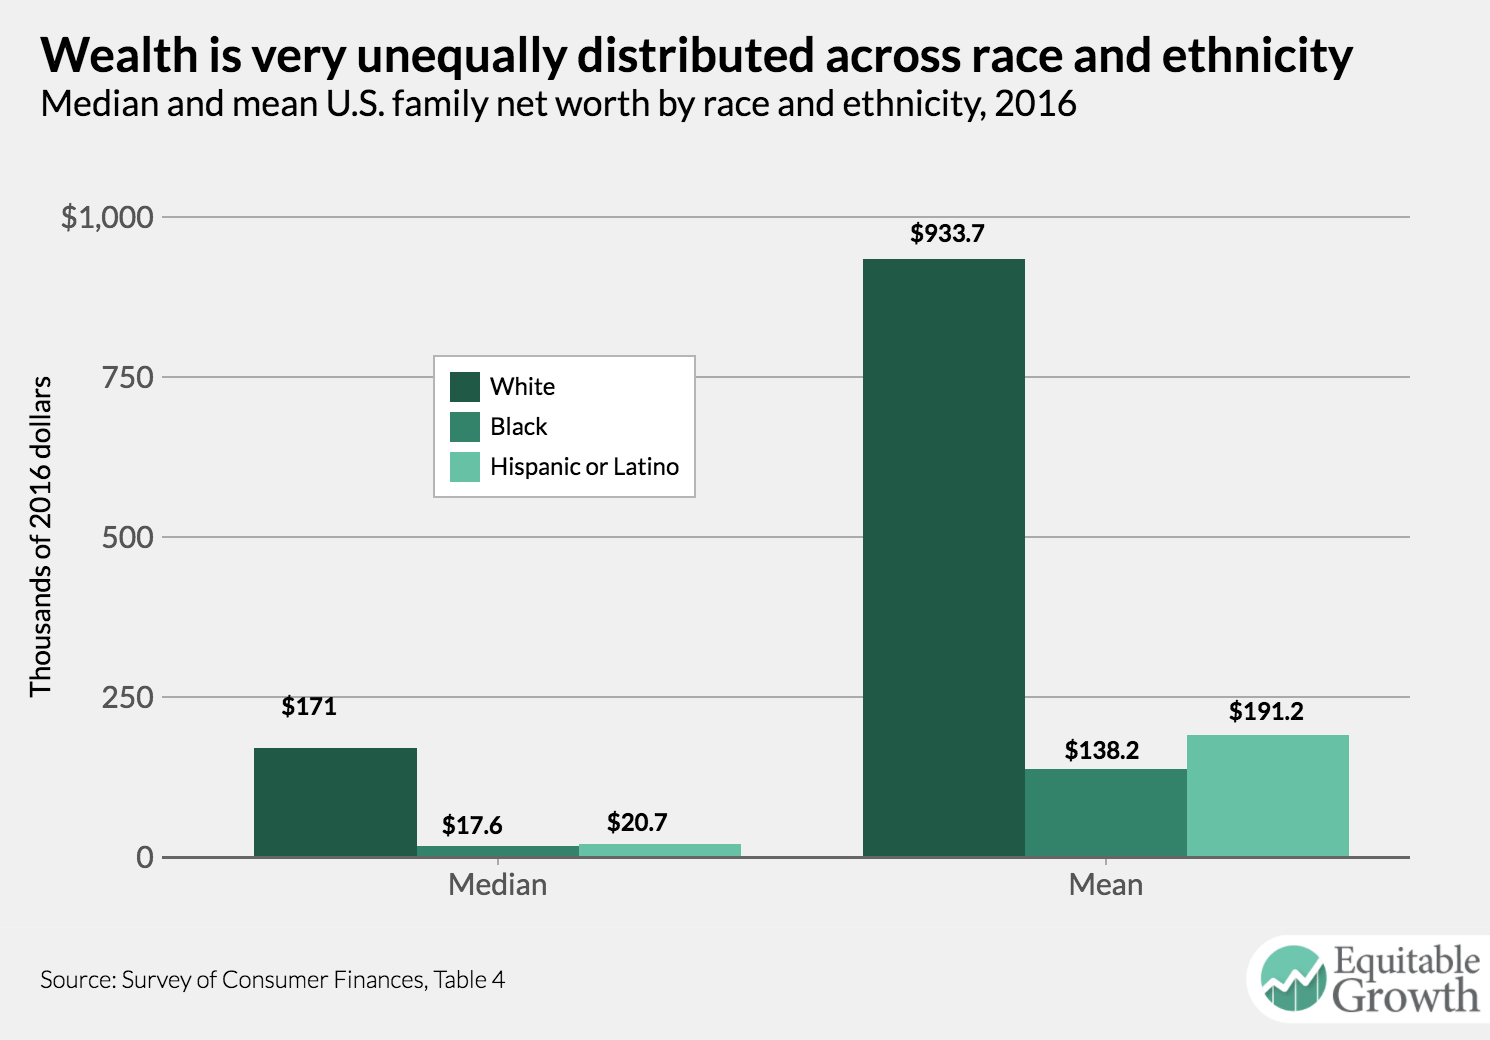
Figure 3
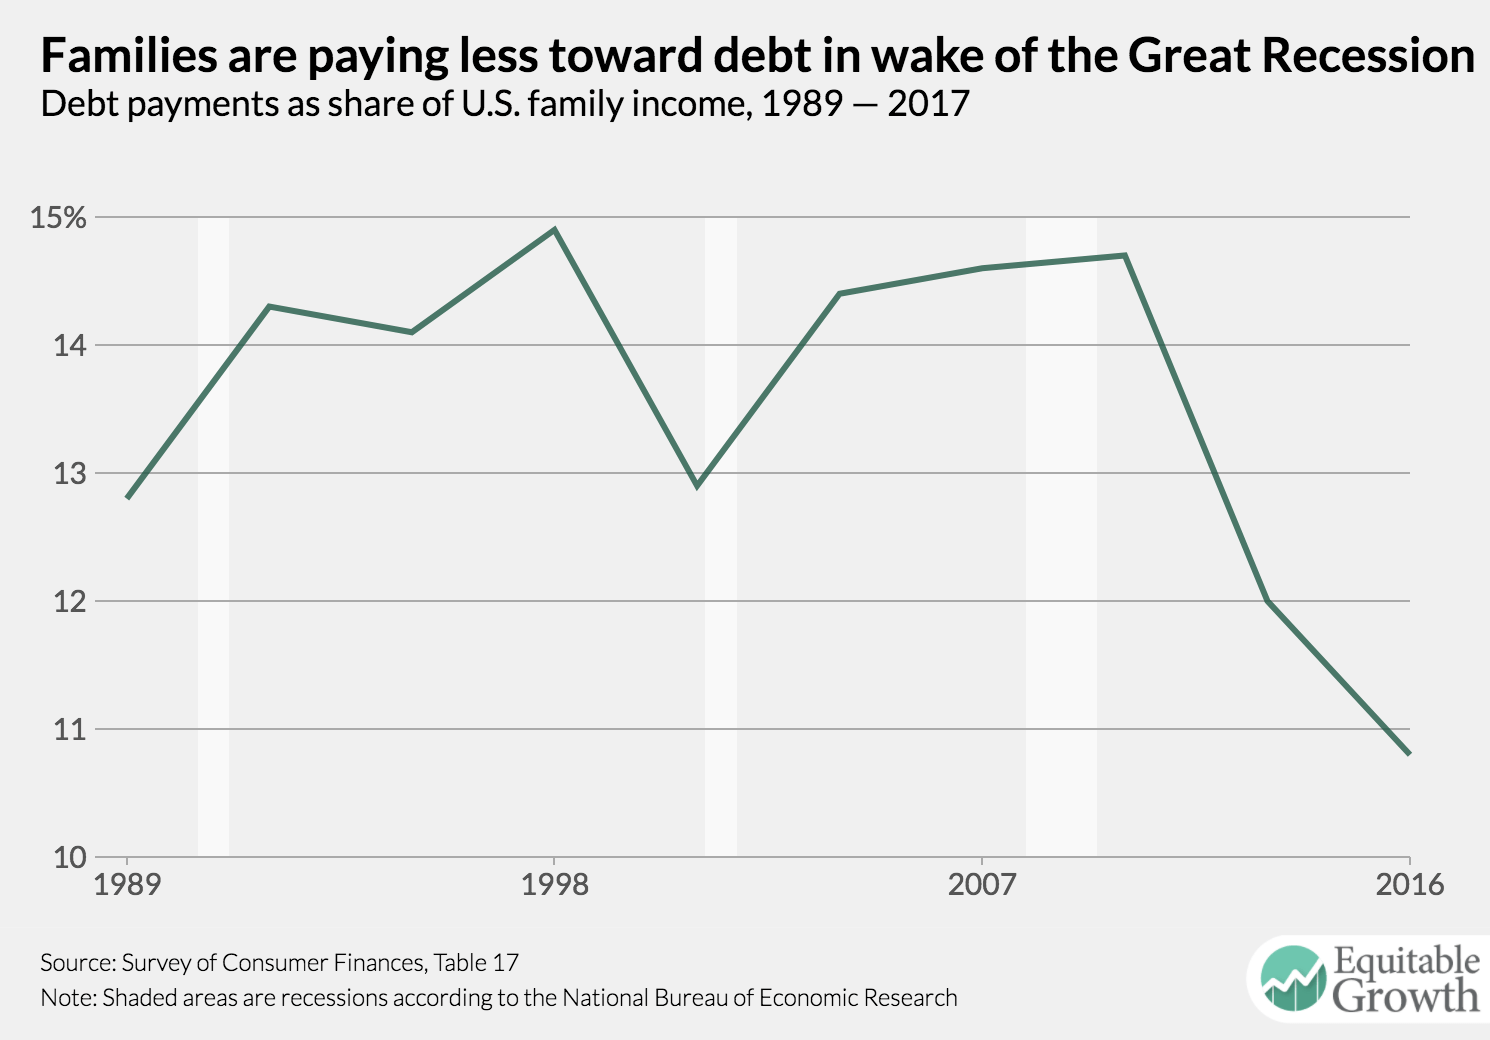
Figure 4