Accounting for capital gains in income significantly increases U.S. inequality

The Washington Center for Equitable Growth’s recently launched U.S. Inequality Tracker uses data from the U.S. Bureau of Economic Analysis to show how income and wealth inequality have evolved in the 21st century. Our analysis of the data through 2023 shows that income inequality has been relatively stable over this time span, while wealth inequality has grown in that same period.
But the Bureau of Economic Analysis does not keep track of capital gains in the U.S. economy, or increases in the value of an asset, such as stocks and property. When an asset is sold, the profits or losses on that asset are called realized capital gains, whereas when an asset increases or decreases in value but is not sold off, it is referred to as unrealized capital gains. Capital gains in the United States are large and are distributed very unequally along the income distribution, with the bulk of them going to the very top.
Indeed, we find that adding capital gains to the BEA income series shows that the share of income earned by the top 10 percent of households between 2002 and 2021 actually increased by 5 percentage points, rather than the 1.1 percentage points shown in the BEA data alone.
To reach this finding, we worked with a team of economists—the Federal Communications Commission’s Cole Campbell and the University of Illinois at Chicago’s Jacob Robbins and Sam Wylde—who recently put out a working paper tracking capital gains. Their team shared estimates of U.S. capital gains from 2002 to 2021 for three income groups: the bottom 50 percent of households, the upper 40 percent of households (those in the 50th percentile to 90th percentile), and the top 10 percent of households. Their measure, which they call pure capital gains, includes both realized and unrealized capital gains.
In 2021, pure capital gains on assets held by U.S. households came in at $16.2 trillion, making them the single largest component of income in that year. But capital gains are highly volatile because of conditions in the stock market and can sometimes yield enormous losses, particularly amid economic downturns. Adding capital gains to other forms of income can thus both increase and decrease inequality. During recessions, when asset values plunge, adding capital gains to income measures will tend to decrease income inequality, with the reverse happening during booms.
To create more stable and interpretable income trends, we used the 5-year running average of pure capital gains to make our calculations about their impact on income inequality. Yet even this measure is volatile, as shown in Figure 1. During the Great Recession of 2007–2009, for example, they reached lows exceeding -$2.5 trillion in 2017 dollars, while they reached highs of close to $5 trillion in 2022. (2017 is the index year for the Personal Consumption Expenditures Price Index, which is a key measure of U.S. inflation and the official deflator for BEA’s Personal Income series, which we use here.) (See Figure 1.)
Figure 1
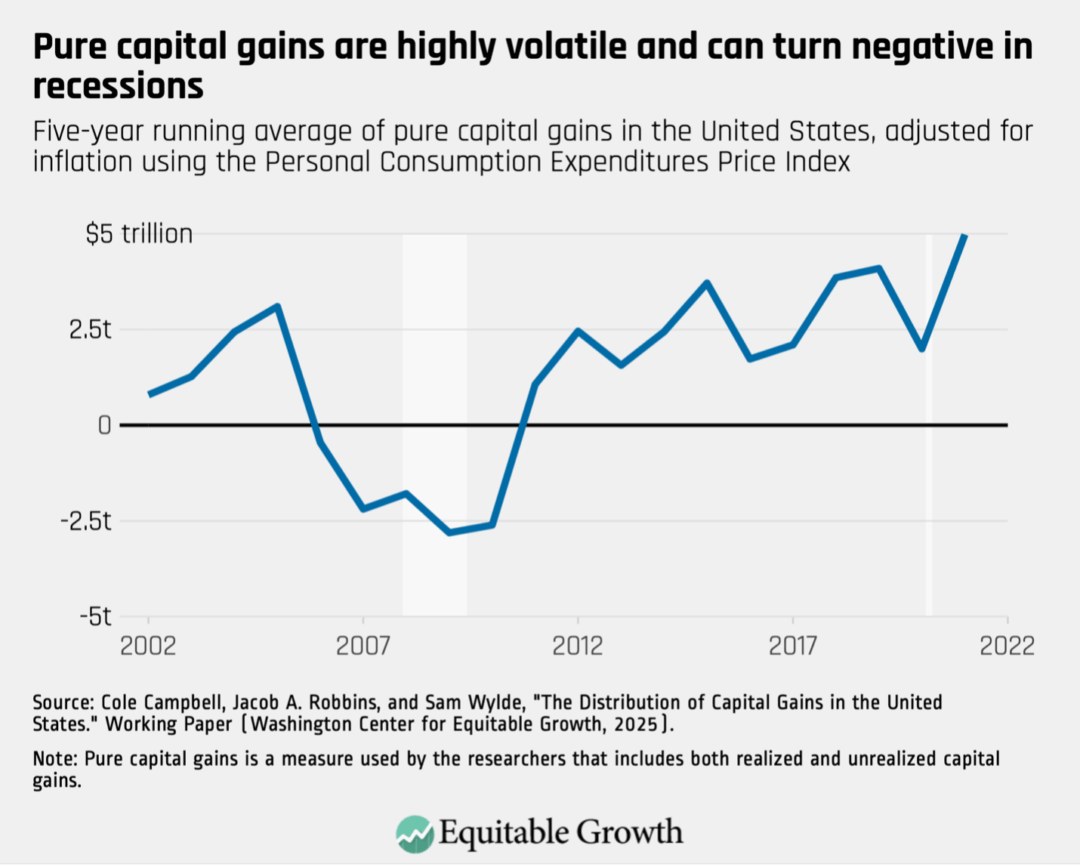
Figure 2 below shows the share of income earned by U.S. households in the top 10 percent over time, both with and without pure capital gains. To make the numbers comparable, we use a 5-year running average of other forms of income as well, which greatly reduces the variation in this series.
When capital gains are not included, the share of income earned by the top 10 percent increased 1.1 percentage points over the two decades studied, from 36.9 percent to 38 percent. With capital gains, the difference is more pronounced, with the share of income earned by the top 10 percent of households increasing from 37.1 percent in 2002 to 42.1 percent in 2021. (See Figure 2.)
Figure 2
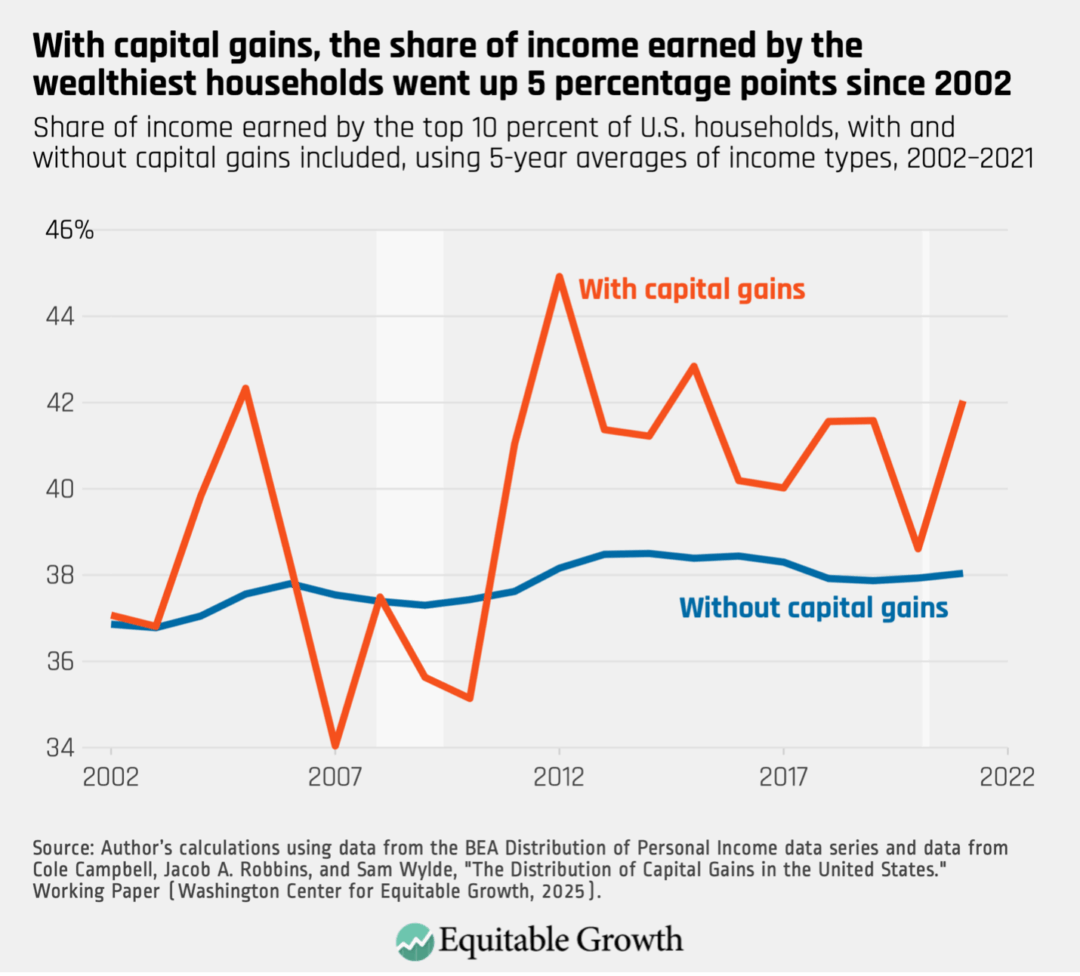
As Figure 2 shows, the series with capital gains included was quite volatile over this time, with the top 10 percent’s share dipping as low as 34 percent before bouncing back in the early 2010s. Unsurprisingly, this was a result of asset values crashing during the Great Recession.
These findings echo estimates from the Congressional Budget Office’s distribution of income report. This report, which is currently only updated through 2021, also tracks U.S. income inequality over time but uses a different income concept than the Bureau of Economic Analysis and includes realized capital gains. In the CBO data series on income after taxes and transfers, the top 10 percent’s share of income increased by 5 points between 2002 and 2021.
Overall, these findings reinforce that income inequality has been high but stable through the 21st century—but there are serious warning signs just beneath the surface. We pointed to two such warning signs in our initial analysis: First, income support programs have propped up U.S. households in a period of weak wage growth, and second, that these government transfers have been increasing as a share of income, implying that economic welfare has increased much more slowly for the bottom 50 percent than for the top of the distribution.
Rising levels of capital gains wealth is another warning sign. Capital gains significantly increase the wealthiest households’ share of income and are growing over time. All these warning signs suggest U.S. income inequality will rise further in coming years.
Did you find this content informative and engaging?
Get updates and stay in tune with U.S. economic inequality and growth!