
AI-related inputs drove U.S. businesses’ import growth in 2025

Key takeaways:
- U.S. imports of business inputs grew in 2025, driven largely by intermediate goods related to the build out of AI infrastructure, including computers, electronics, equipment, machinery, and metals. Excluding AI-related goods, the share of intermediate inputs coming from abroad has been essentially flat over the past decade.
- Whipsaw tariff policies have so far failed to change how U.S. businesses source inputs, with import shares steady and the overall level of imported inputs rising in 2025 despite record-high statutory tariff rates. Instead of responding to unpredictable policy pronouncements, business imports have historically shifted in response to economic fundamentals, such as the COVID-19 recession in 2020 and subsequent years of supply chain snarls.
- What this means for growth: Volatile tariffs are piling additional costs on U.S. businesses, delivering price increases for households and draining resources that firms could invest in new infrastructure and jobs. These costs come with no apparent upside for domestic supply chains—on average, U.S. businesses in 2025 increased their use of imported inputs.
No evidence tariffs re-shored business inputs in 2025
The enduring question of last year’s tariff rollercoaster is whether the economic pain was worth reshoring U.S. supply chains. A preliminary answer came in a September data release from the U.S. Bureau of Economic Analysis showing that U.S. businesses upped their use of imported inputs in 2025, driven in large part by AI-related intermediate goods. This early evidence is in line with new research finding largely negative economic effects of broad, indiscriminate tariffs.
The new BEA data also confirms the findings in earlier iterations of the Equitable Growth tariff model: manufacturing and other upstream economic sectors are more tariff-exposed compared to the average, with particularly high exposure for some subsectors of economic and national strategic significance. The following charts sketch these preliminary findings and illustrate the richness of publicly available federal data at a time when collection and dissemination are under threat. (See Figure 1.)
Figure 1
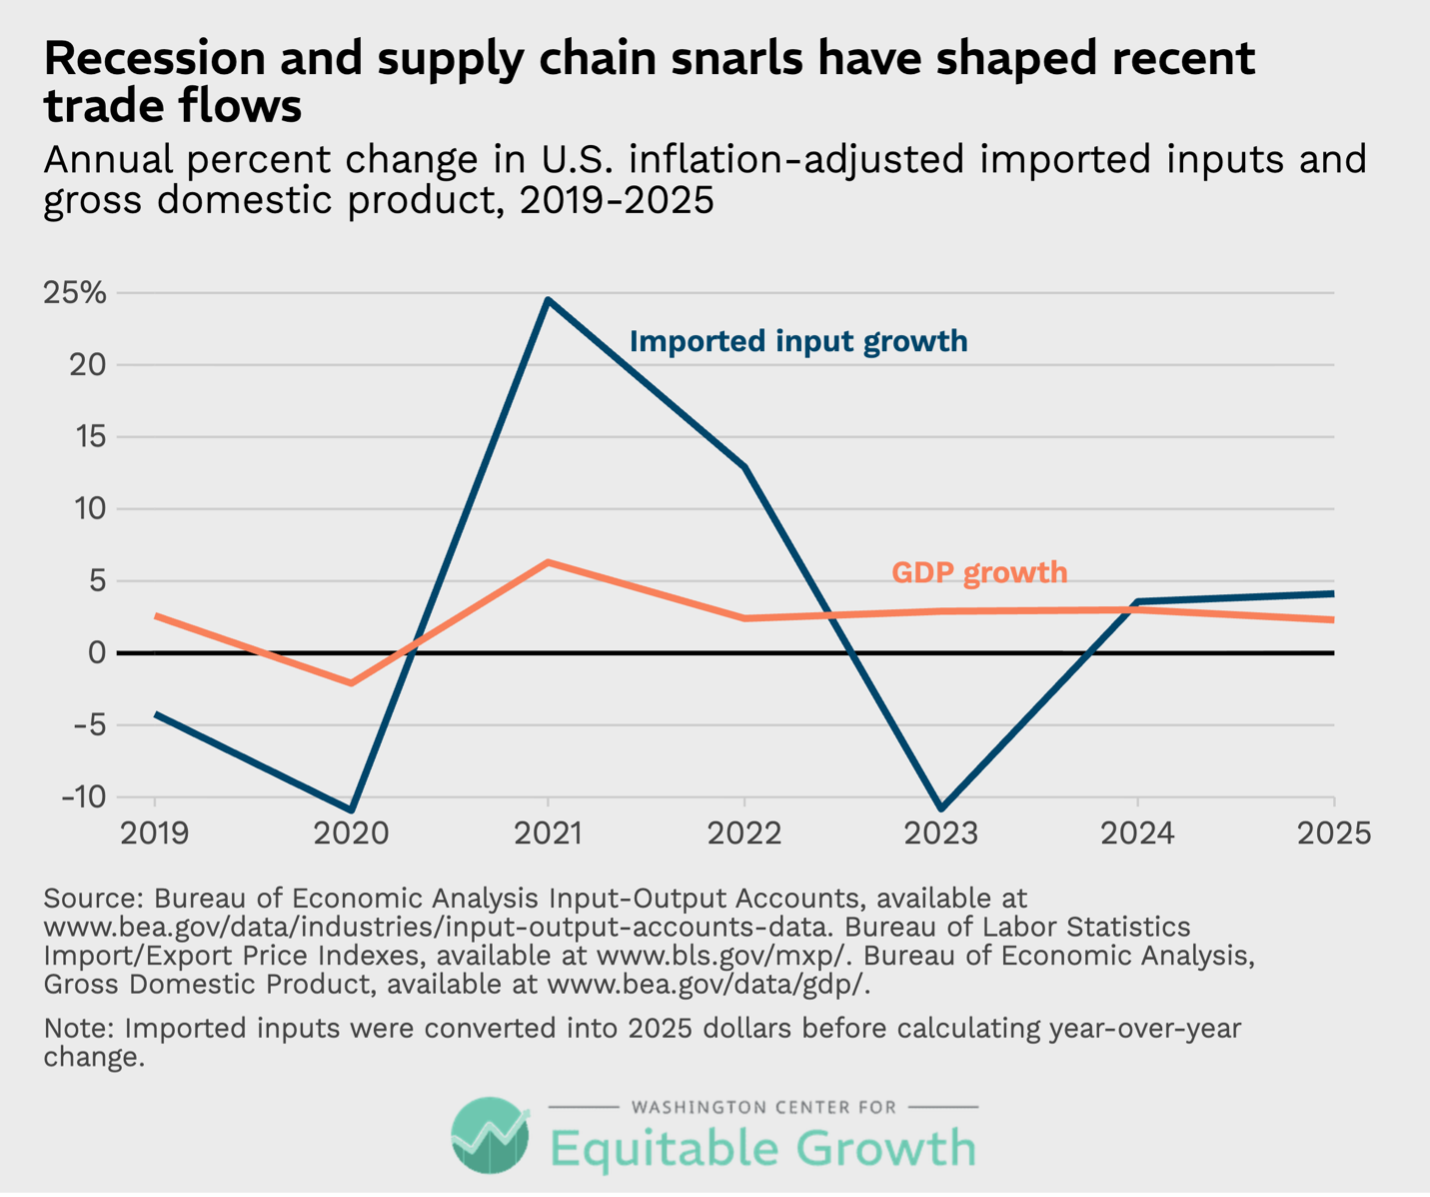
Over the past several years, U.S. business imports of inputs have been largely shaped by the COVID-19 recession of 2020 and subsequent years of supply chain snarls, with tariff policies in 2025 so far registering no discernable impact. Federal data show a trough in imported inputs during 2020, when supply chains shriveled amid the pandemic. Imported inputs, in inflation-adjusted 2025 dollars, saw wide swings in the years following the pandemic recession as supply chain complications developed amid an economic expansion. These data on inputs follow the general cyclical trend of imports falling during recessions and increasing during expansions. (See Figure 2.)
Figure 2
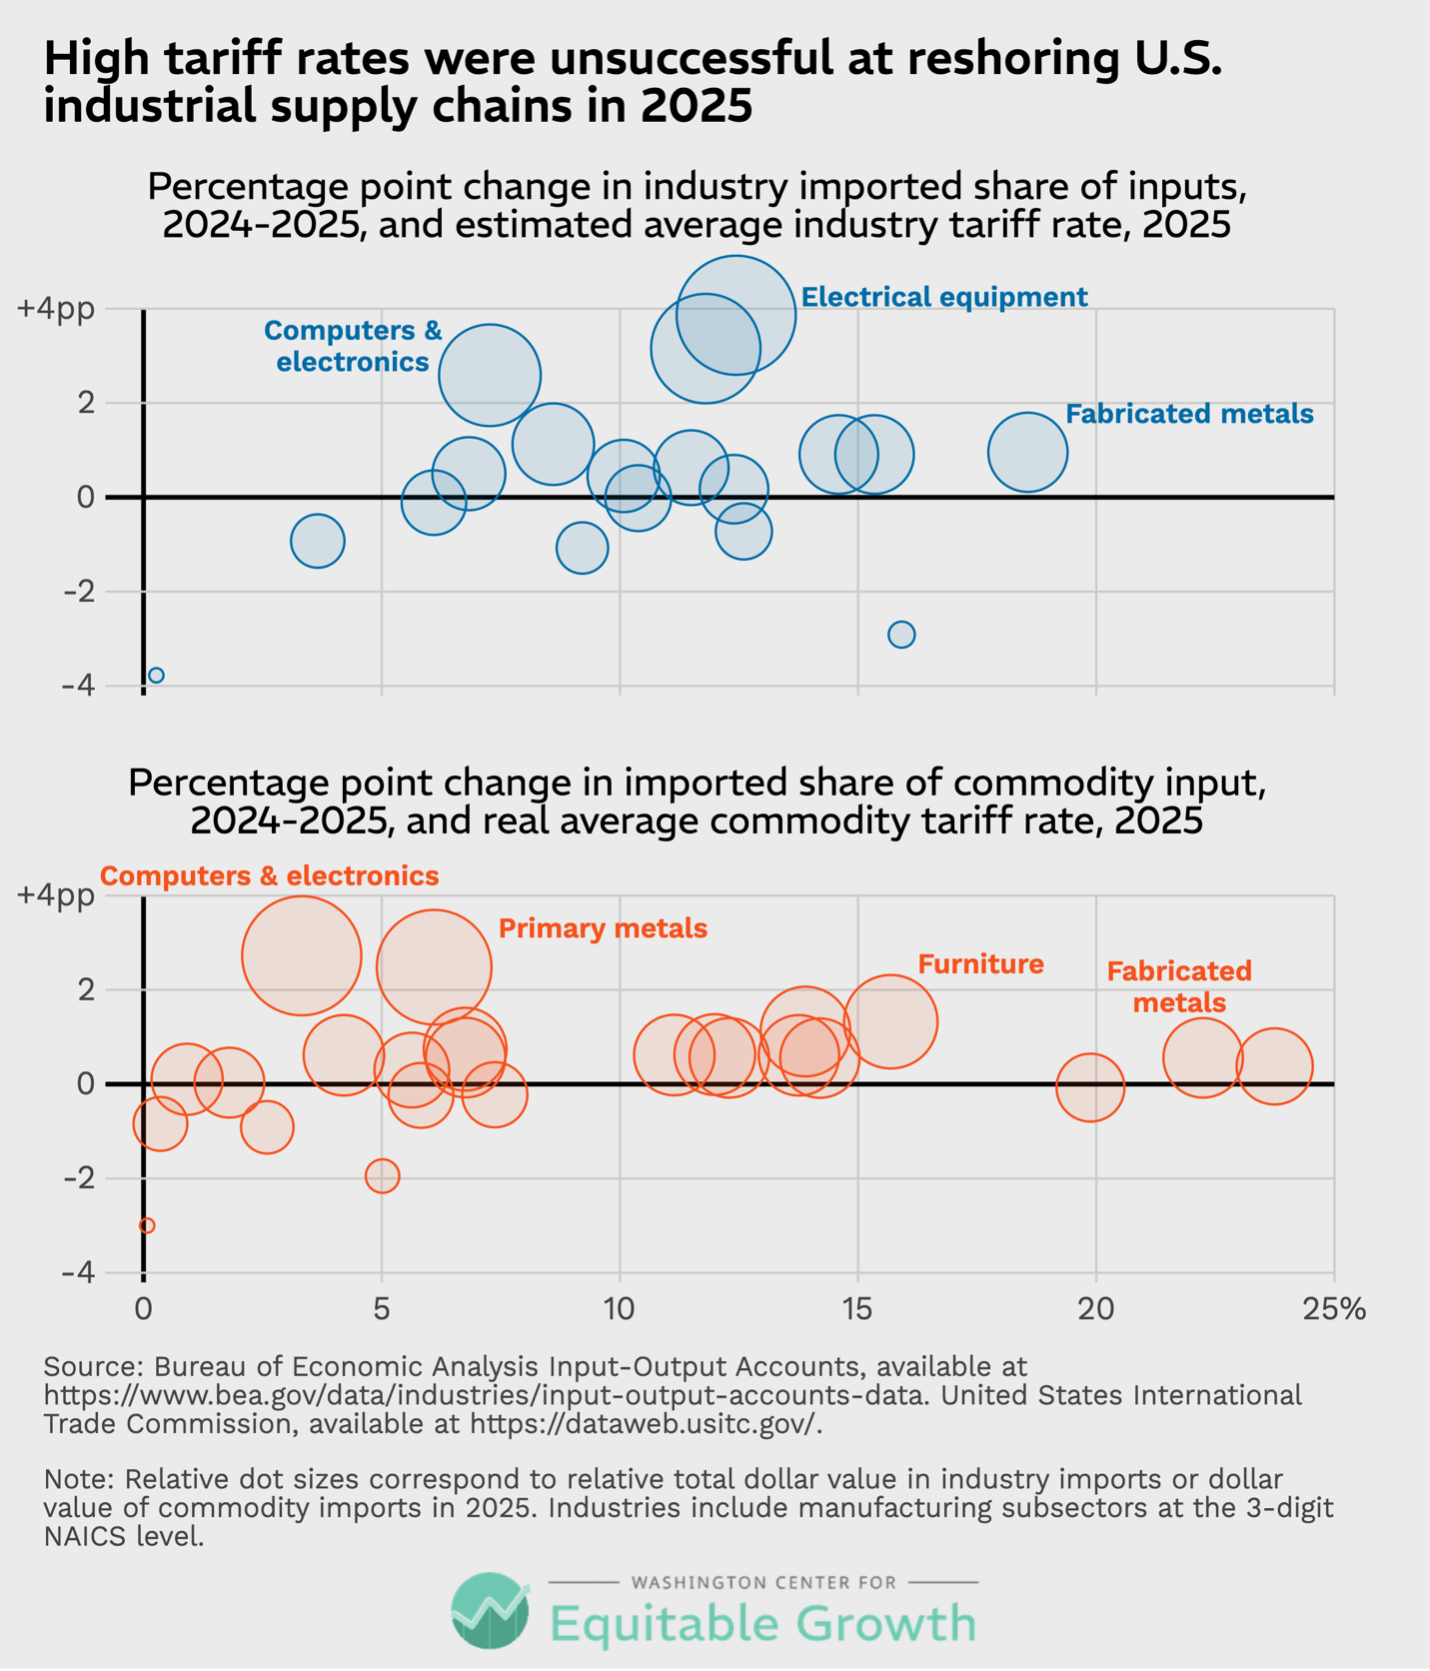
Tariffs are intended to incentivize businesses and consumers away from imports and toward alternative domestic sources of goods, a goal that so far appears unmet. In 2025, on average, there was no significant correlation between the tariff rate faced by a U.S. economic industry and the change in that industry’s imported share of inputs. If anything, the data shows a statistically insignificant positive relationship between tariff rates and import shares. This ambiguous relationship is true at the commodity level, too, where the Equitable Growth model directly calculates tariff rates, and at the industry level, where tariff rates are estimated as a function of industry exposure to various commodities.
Important month-to-month changes in import profiles in 2025 may have been flattened in the annual BEA data. It is possible, for example, that import shares surged in the first few months of 2025 as U.S. businesses prepared for an expected tariff hike before declining as tariffs came into effect. Annual data is not granular enough to capture this potentially meaningful month-to-month movement, but next year’s BEA data drop should help clarify the picture. (See Figure 3.)
Figure 3
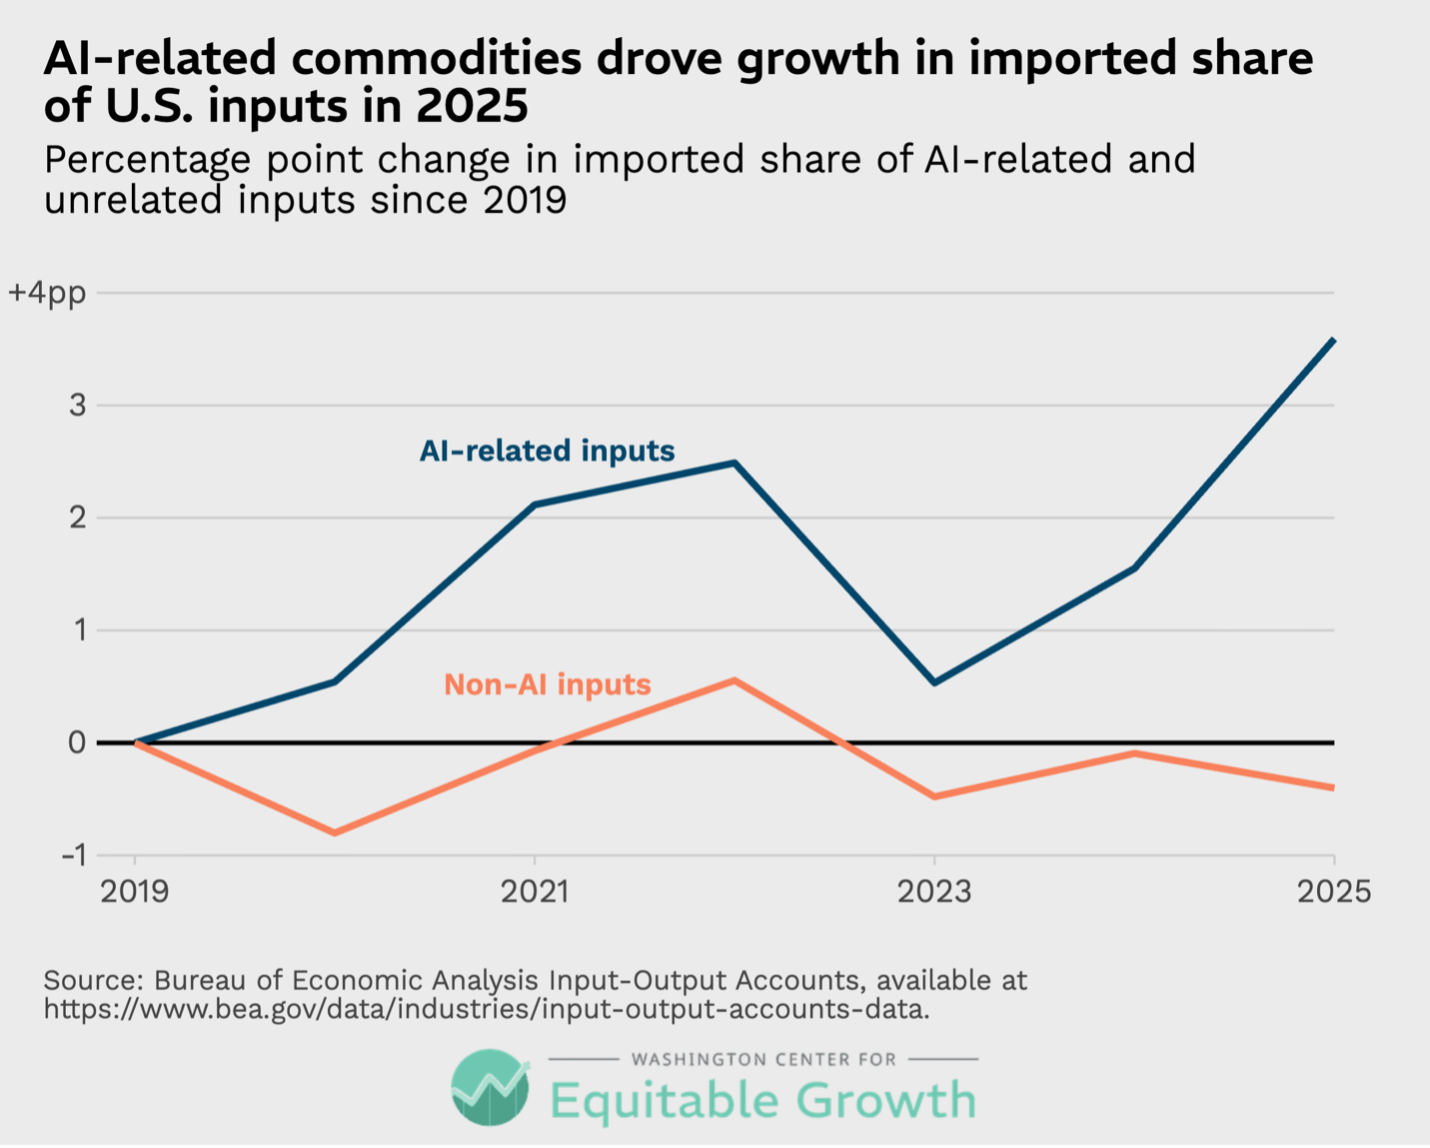
Separating intermediate imports into categories associated with the AI infrastructure build-out shows that, from 2024 to 2025, growth in business imports could be largely attributable to these categories. Stripping out computers, electrical equipment, machinery, and metals, import shares registered their smallest swing since 2019. Computers and primary metal goods (more upstream, raw metals imports) saw particularly large percentage point increases in import shares from 2024 to 2025, of 2.7 and 2.5 percentage points, respectively.
Import shares have been ticking up for a couple years for computers, electrical equipment, and machinery, without apparent regard for higher tariffs in 2025. Importantly, analyzing import shares rather than import values is one way to help control for mechanical price impacts on import values, which when measured in nominal dollar terms will ebb and flow along with inflationary pressures. Using the import share measure to control for inflation assumes import prices largely follow domestic prices for the same input. (See Figure 4.)
Figure 4
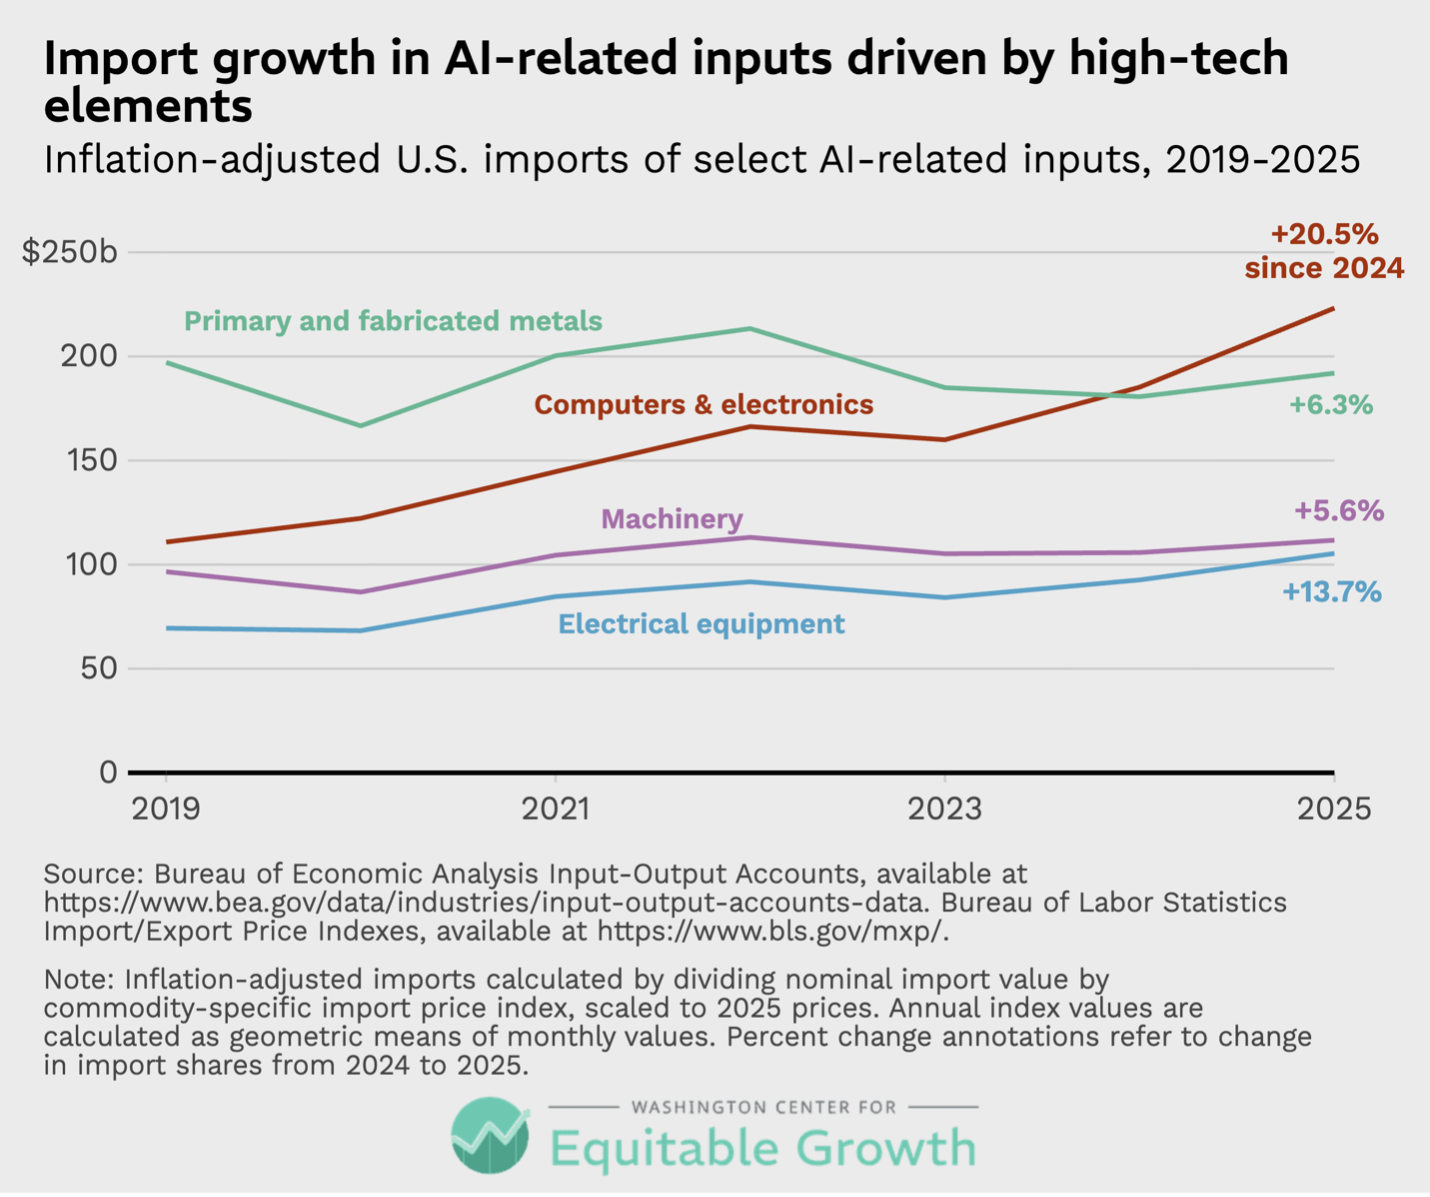
Import prices can also be directly accounted for by scaling import values with the import price index for each intermediate input, similar to the conversion to 2025 dollars in Figure 1. Adjusting for inflation, growth is particularly stark in the more high-tech segment of the broader AI-related import group. Inflation-adjusted computer imports have skyrocketed since 2019 and led the various AI-related inputs in year-over-year growth in 2025, though each of the five AI-related input categories registered inflation-adjusted import growth. (See Figure 5.)
Figure 5
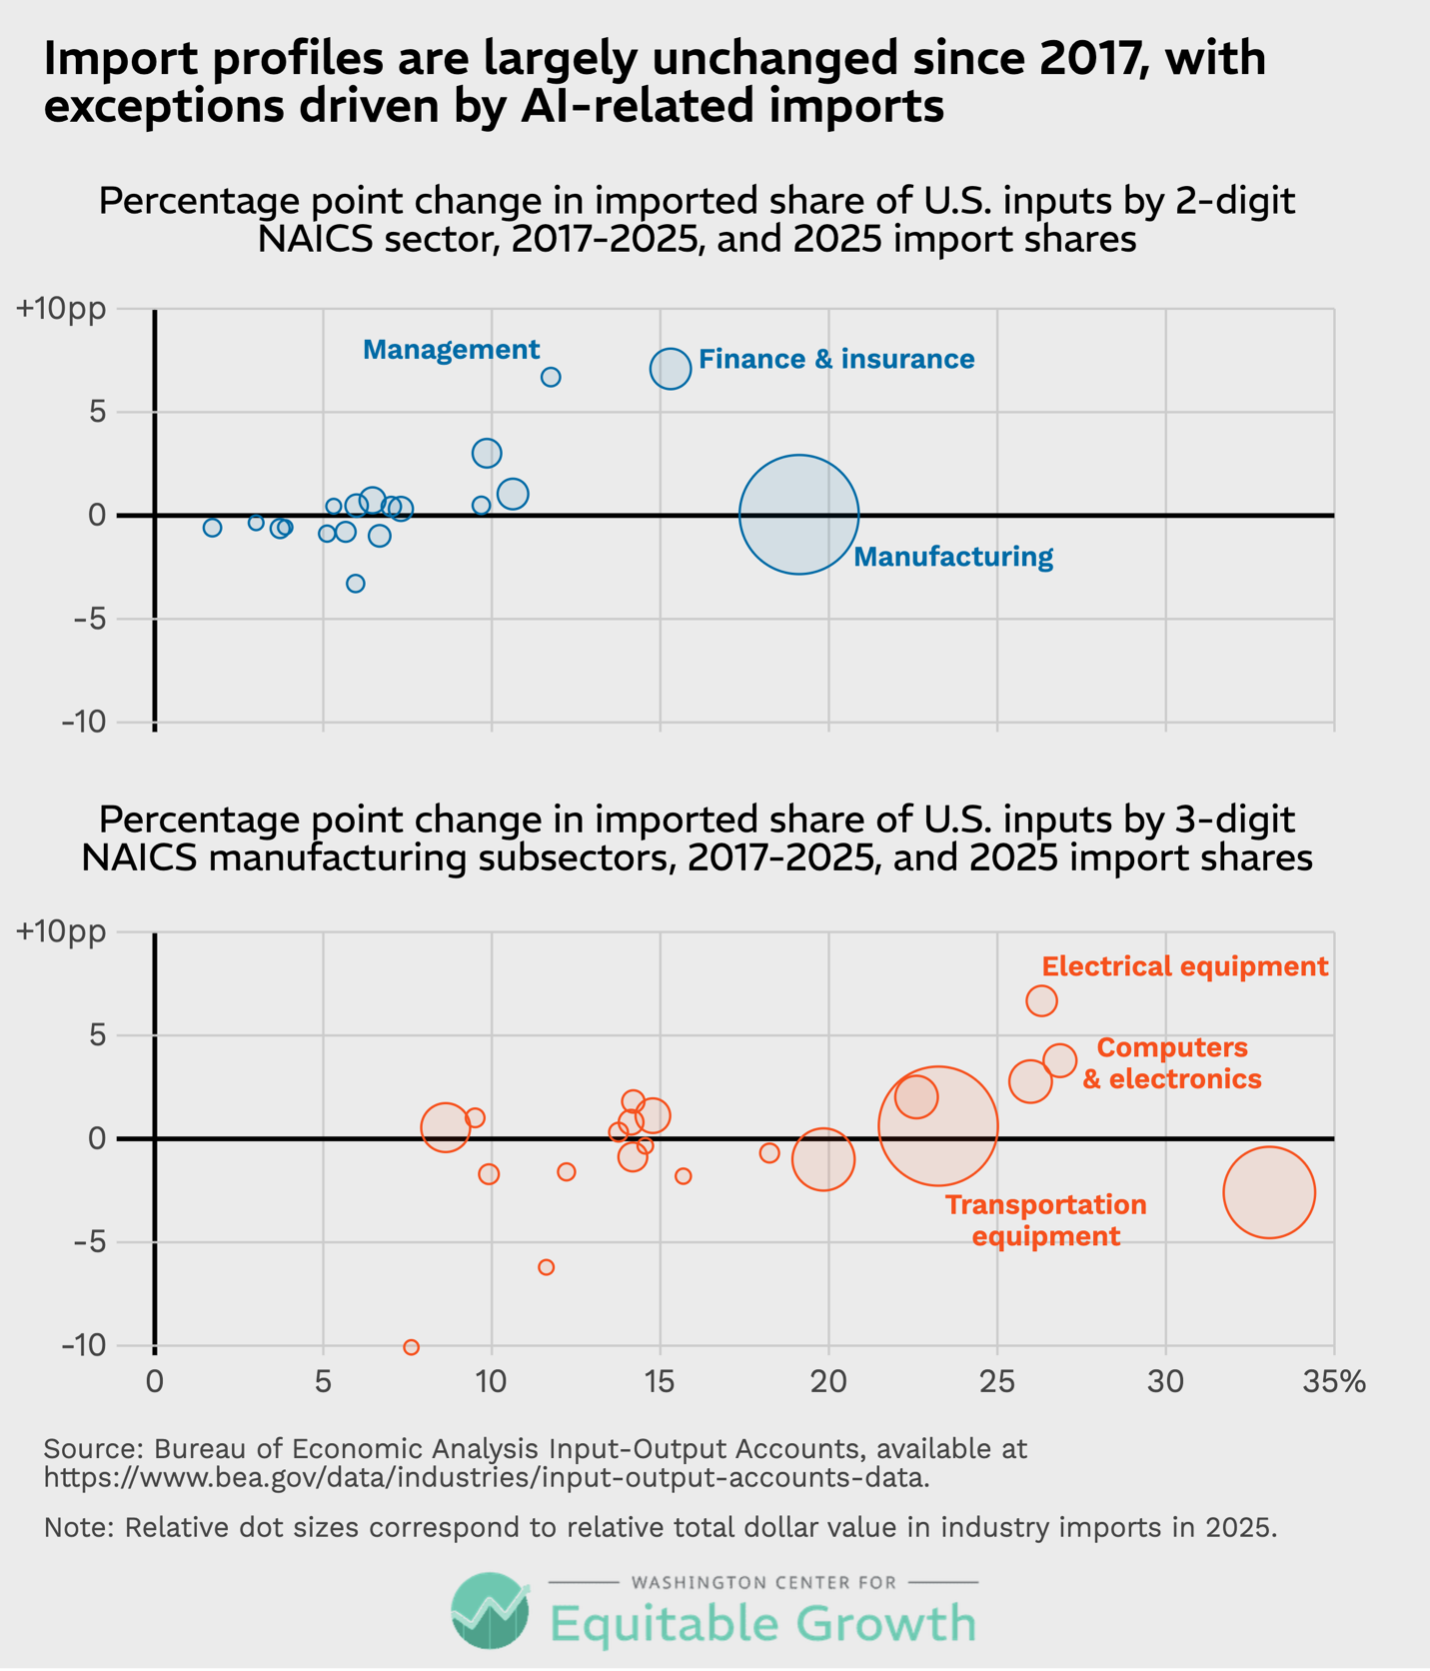
The annual BEA tables are useful to Equitable Growth’s tariff model to help correct for divergence over time from the detailed industry-commodity tables published every five years with a lag. Our model is currently structured around the BEA’s 2017 benchmark input-out account, showing highly detailed import relationships between U.S. economic industries and commodities. As the charts above suggest, the 2017 benchmark is still highly representative of today’s economy, with most changes in the share of sector and subsector imports hovering around zero. The notable exceptions—finance & insurance, management—are predictably due to large upswings in imports by those sectors of AI-related commodities. The large increases in AI-related inputs offset significant declines in imported energy products and other goods.
 post
 post

Conclusion
Altogether, these charts reveal a few important facts. Business imports move largely in response to fundamental economic conditions—recessions, booms, and physical supply chain barriers—and so far appear unresponsive to the unpredictable tariff policymaking of 2025. Recent imported input growth is largely driven by AI-related goods, suggesting businesses may be more interested in responding to economic motivations around the infrastructure boom rather than potentially transient tariff policies. More data is needed to understand the relationship between tariffs and imported inputs, and the proper funding of federal statistical agencies would make important information more accessible.
These publicly available data from the Bureau of Economic Analysis, the Bureau of Labor Statistics, and other data sources are foundational to Equitable Growth’s tariff model, and act as essential information inputs to countless other organizations like ours, as well as business and households interested in understanding how government policy will impact their lives and livelihoods. Some of these federal data are under potential threat, however, as statistical agencies are explicitly undermined and under resourced, complicating essential efforts to modernize data collection.
A recent U.S. Department of Commerce order restricting how some data products are disseminated is already impacting availability of crucial economic data. Equitable Growth’s model uses the County Business Patterns survey to help understand the economic structure of different communities across the United States, allowing us to map national-level estimates of tariff impact onto local-level distributions of employment across industry. The 2024 County Business Patterns update, due in the early summer, is still delayed due to the Commerce Department order. Ensuring reliable access to accurate federal information is a cornerstone of democracy and good governance.
Did you find this content informative and engaging?
Get updates and stay in tune with U.S. economic inequality and growth!



Stay updated on our latest research