
Applying a debt-to-wealth lens internationally reveals subtle differences between countries’ fiscal capacities

Key Takeaways
- When policymakers consider their nations’ capacities to service growing government debt obligations, the debt-to-wealth ratio is a useful metric to consider alongside the more familiar ratio that measures debt to Gross Domestic Product.
- Differences in the debt-to-wealth ratios in the United States, France, Japan, and the United Kingdom highlight similarities and differences in wealth as a source of additional government revenue.
- A low debt-to-top 0.1 percent wealth ratio implies that narrowly tailored taxes on wealth could raise substantial revenues, relative to the total size of government debt. These taxes could include net-worth taxes on appreciated capital assets, such as mark-to-market taxes on capital gains, or more effective estate or inheritance taxes.
- Other countries with comparable levels of debt are less able to raise money this way, because wealth inequality is lower in those countries. To raise similar revenues, they would have to levy broader-based taxes that would fall on a larger number of households.
- What this means for growth: The United States has a low debt-to-top 0.1 percent wealth ratio, which means policymakers can consider taxing wealth to lower the U.S. government debt and drive down bond yields while preserving critical government investments.
Overview
In late August, investor demand for government bonds weakened, sending yields (the interest rate governments must offer to attract investors) soaring. Yields on 10-year U.S. bonds, which were just 4 percent as recently as February, are now hovering around 5 percent. A similar dynamic played out among other major economies, including the United Kingdom, France, and Japan. While multiple factors may have contributed, among them rising prices, especially for oil—sparking renewed concerns about inflation—rising levels of government debt were frequently cited.
In a report released in July by the Washington Center for Equitable Growth, we showed that debt-to-GDP ratios, a common metric for assessing a country’s debt burden, fails to capture the true resources available to a nation to address rising government debt. In the case of the United States, debt-to-GDP recently topped 100 percent, a level last seen during World War II. But this ratio ignores the enormous amount of private household wealth that could also be called on to pay government obligations without cutting the valuable investments that the federal government makes in U.S. households. We argue that the debt-to-wealth ratio is a useful metric to consider alongside debt-to-GDP.
In this column, we show that this discrepancy between the traditional debt-to-GDP metric and the new debt-to-wealth metric we’re proposing is a common feature of large economies. Most countries have seen their wealth stock increase faster than GDP, leading to lower or steady levels of debt-to-wealth even as debt-to-GDP ratios rise. As we discussed in our previous report, there are several plausible and probably interrelated explanations for this increase in the wealth stock over the past half century, including rising asset prices, aging populations, low interest rates, and slow growth.
The debt-to-wealth metric also allows for easy analysis of how debt and wealth inequality interact. On this point, the United States is more of an outlier, with a huge amount of U.S. wealth concentrated in the hands of a very small number of people. This implies that the federal government could make significant progress toward lowering its debt load by taxing a relatively small and extremely wealthy slice of the U.S. population. As we will show below, other countries, with less concentrated wealth stocks, do not have this option.
Consider four countries that have similar debt trajectories as the United States. France and the United Kingdom both have debt-to-GDP ratios around 100 percent while Japan has a much higher rate of around 200 percent. With a few small exceptions, the general trend for all four countries has been swiftly increasing debt-to-GDP ratios in recent years, which has elicited alarm, including among bond investors. But all four nations have had much lower and more stable debt-to-wealth ratios over the same period. The United States, France, and Japan have seen virtually no change in their debt-to-wealth ratios between 2012 and 2024, even as their debt-to-GDP ratios have climbed significantly. Only the United Kingdom has seen its ratio rise in that period, from around 20 percent to 27 percent. (See Figure 1.)
Figure 1
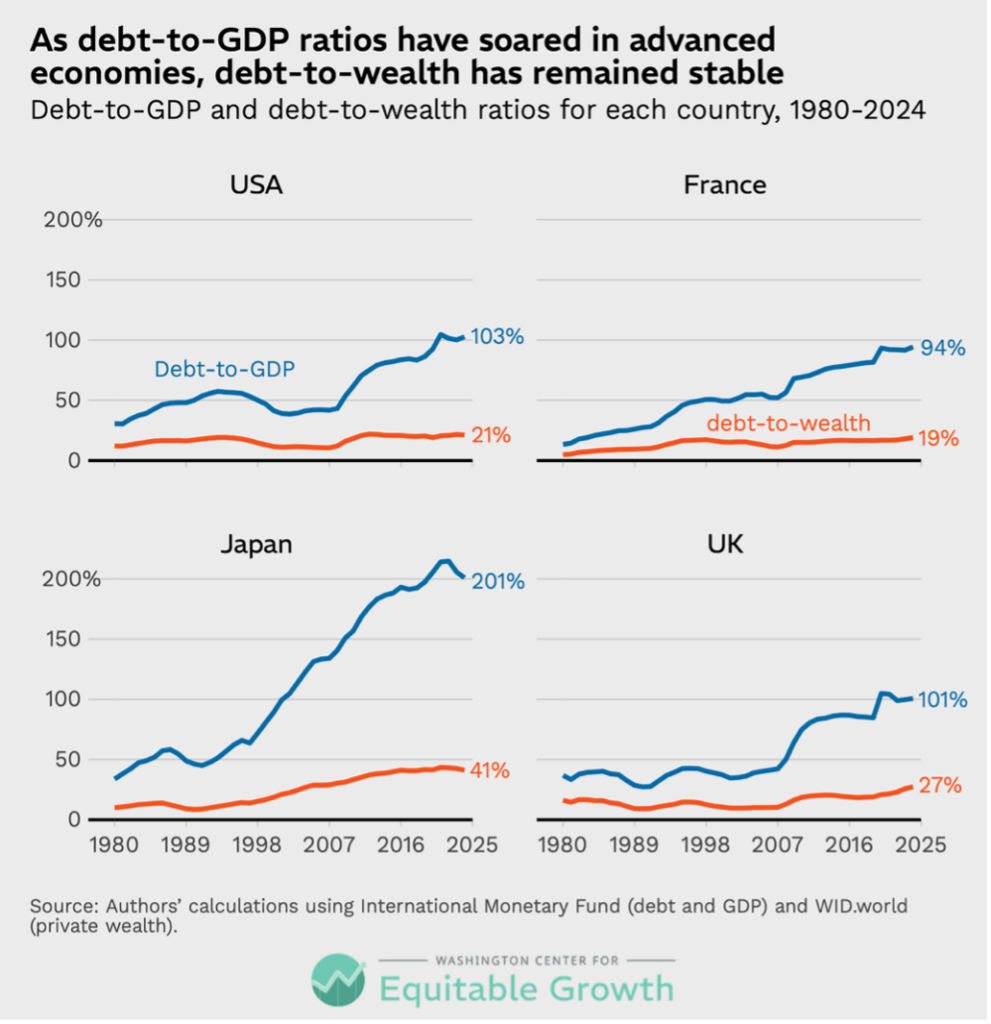
In all four countries, wealth has grown faster than GDP, keeping debt-to-wealth ratios in check even as debt-to-GDP rises. This trend also is evident in a much broader set of modern economies that we’ve excluded from this brief so we can focus on nations with comparable levels of debt to the United States and with pay-as-you-go public pensions similar to Social Security. (Social Security isn’t considered wealth at all in this analysis. By contrast, fully funded pension systems in some nations dramatically raise levels of wealth relative to pay-as-you-go systems.)
Although these four nations have similar wealth-to-GDP ratios and levels of debt, they differ significantly in how wealth is distributed. Wealth is highly concentrated at the very top of the distribution in the United States, with the top 0.1 percent of adults holding 18 percent of all wealth. By contrast, in France the top 0.1 percent hold 13 percent of wealth. In Japan and the United Kingdom the levels are10 percent and 7 percent, respectively.
Consequently, even though the United Kingdom and France have comparable levels of debt-to-wealth as the United States, each has higher levels of debt-to-top 0.1 percent wealth. The U.K ratio is nearly four times higher than the U.S. ratio. Japan’s ratio is similar to the U.K. ratio despite Japan holding far more debt relative to its GDP. (See Figure 2.)
Figure 2
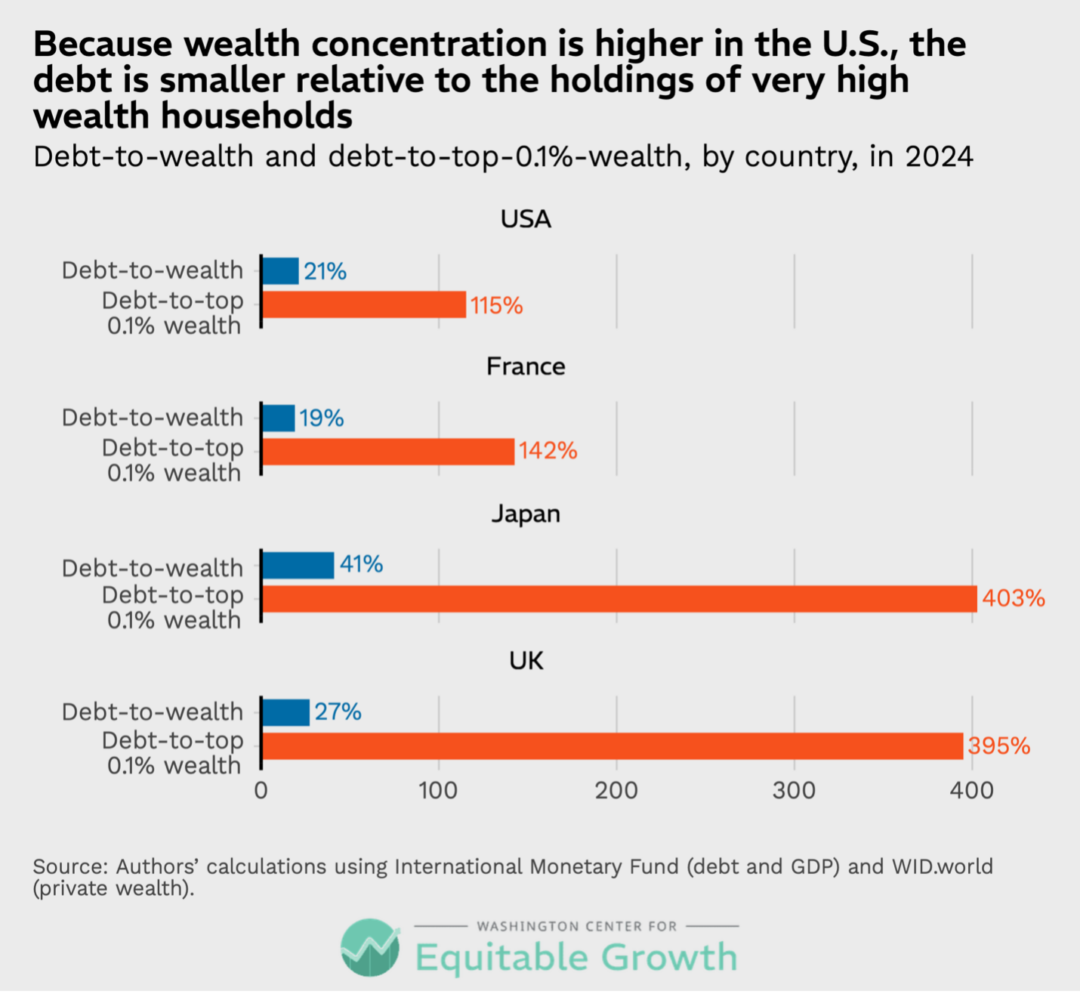
A low debt-to-top 0.1 percent wealth ratio matters because it implies that narrowly tailored taxes on wealth could raise substantial revenues, relative to the total size of government debt. These taxes could include not just net-worth taxes but any tax on appreciated capital assets, such as mark-to-market taxes on capital gains or more effective estate or inheritance taxes. While the United Kingdom and Japan would need broad wealth (or other) taxes to meaningfully address their government debt, the United States and France could raise significant sums purely from taxes on small slices of the population at the tippy top of their societies.
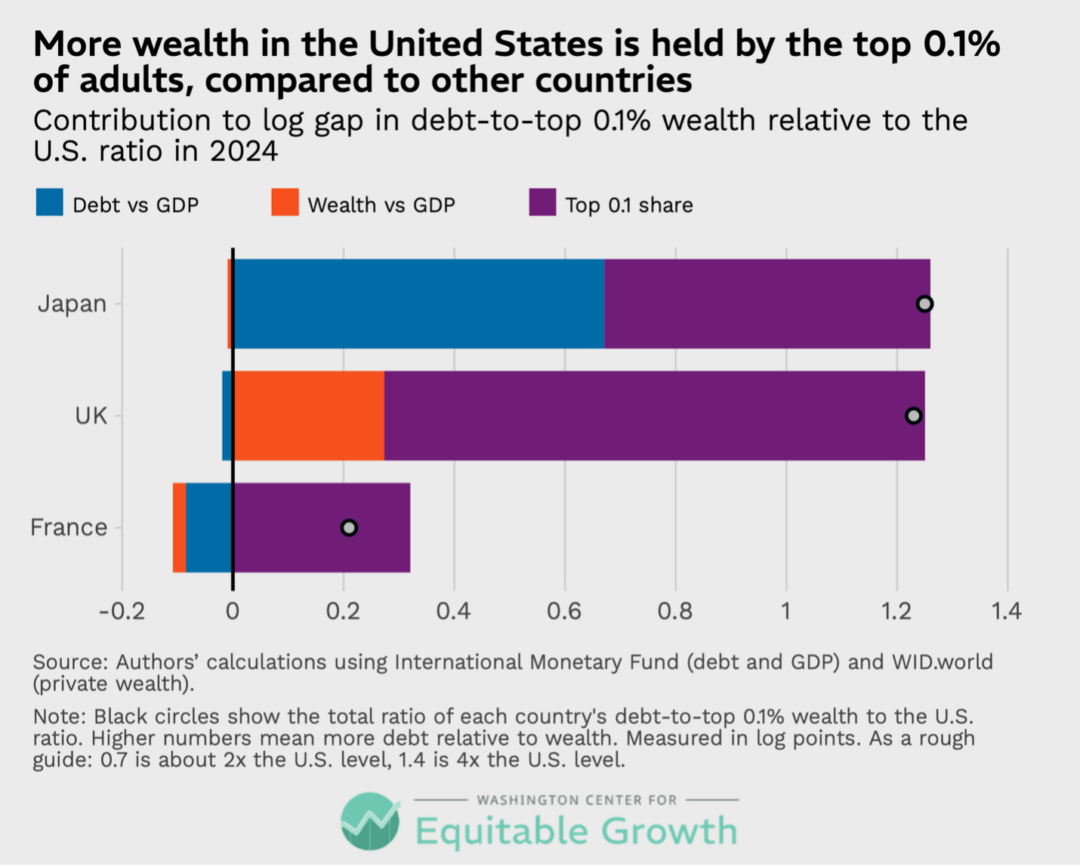
To see this more clearly, Figure 3 below decomposes the gap between the debt-to-top 0.1 percent wealth ratio in France, Japan, and the United Kingdom relative to the U.S. ratio. Japan has a ratio nearly four times the U.S ratio primarily because Japan has more debt (relative to its GDP) and a more equitable distribution of wealth. The United Kingdom has a high ratio relative to the United States because there is considerably less wealth in the top 0.1 percent and because the island nation has lower aggregate wealth relative to GDP. The small difference between the U.S. and France ratios is primarily because of higher wealth concentration in the United States. (See Figure 3.)
Figure 3
Conclusion
In all these cases, the traditional debt-to-GDP metric does not tell the full story. By using a debt-to-wealth lens, researchers, citizens, investors, and policymakers can better understand the true fiscal capacity of a country, including the extent to which taxes targeted at wealth can bring debt down to more sustainable levels. While economists don’t agree on exactly what is driving the recent run-up in government bond yields—to the extent that markets are internalizing a perceived increased risk that governments won’t repay their debts—a more nuanced understanding of each state’s fiscal situation, including their debt-to-wealth ratios, could prove helpful to those trying to more precisely calculate and price that risk.
 report
 report
 post
post
Did you find this content informative and engaging?
Get updates and stay in tune with U.S. economic inequality and growth!



Stay updated on our latest research