Factsheet: Defining top U.S. income and wealth thresholds for tax policy

Key takeaways
- Policymakers are increasingly interested in defining the upper echelons of the U.S. income and wealth distribution so they can develop and effectively target tax policies.
- Yet determining cut-offs for which households are in the top 1 percent and higher is imprecise and can vary based on source of the data used and other subtle definitional differences and methodological assumptions.
- What this means for growth: While there is strong evidence that targeted tax increases on the wealthy can improve federal and state fiscal conditions, combat inequality, and spur equitable growth, picking thresholds for income and wealth taxation is imprecise. Most proposals target very small slices of the U.S. population. How much revenue is generated and how the economy is impacted are both hard to predict and similarly imprecise.
Overview
Federal and state policymakers in the United States, responding to high levels of income and wealth inequality and shrinking tax revenues, are increasingly interested in proposals to tax households with very high income and wealth. In particular, the rise of the richest of the rich—not just the top 1 percent, but also the top 0.1 percent and 0.01 percent—has recently captured the imagination of policymakers, evidenced by state and federal tax proposals targeting this group.
An Equitable Growth report released today surveys the various ways that income and wealth are measured and how various research teams capture the threshold levels of income and wealth for identifying the top 0.1 percent and the top 0.01 percent—an important guide for correctly targeting these tax policies. But identifying these thresholds on a timely basis is a difficult task. Different methodologies, sources of data, and units of analysis can be confusing for policymakers, advocates, and citizens who want to understand how much of the population is included in these top thresholds.
 report
 post
post
Defining extreme wealth is more complicated than it looks
August 13, 2026
This factsheet provides evidence-backed intuition for approximating top thresholds for both wealth and income in the United States based on the findings of the accompanying report. Let’s turn first to identifying U.S. wealth cut-offs.
Measuring the distribution of wealth in the United States
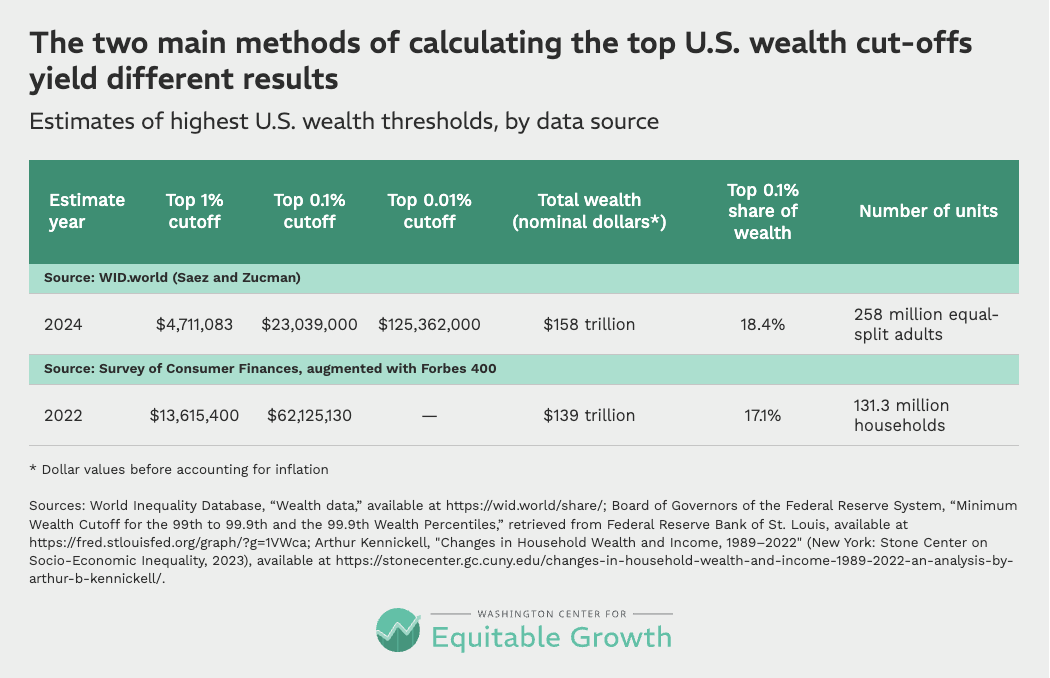
There are two common methods for measuring the distribution of wealth in the United States. The Survey of Consumer Finances is a triennial survey that selects a disproportionately large number of high-wealth households as respondents, making it possible to report wealth thresholds for the top 0.1 percent. The most recent SCF data were released in 2023 looking at U.S. wealth in 2022. The threshold for a household to be part of the top 0.1 percent in that vintage of the survey was about $62 million.
A second popular method of measuring wealth is to capitalize income observed in tax data. If, for example, interest income of $200 is observed on a tax return and the approximate rate of return for the reported type of bond is 5 percent, then this implies that the bond is worth $4,000. This method was used by University of California, Berkeley economists Emmanuel Saez and Gabriel Zucman to create their data on wealth inequality since 1913.
Whereas the Survey of Consumer Finances analyzes households, Saez and Zucman focus on the so-called equal-split adult. That is, they start with tax units—which consist of individuals who file their taxes together (generally, a set of spouses and their dependents, though tax units are not necessarily households or families)—then determine the total wealth of the tax unit, and then split it equally between spouses. As such, they analyze 258 million adults, whereas the Survey of Consumer Finances analyzes 131 million households. This accounts for much of the difference in top 0.1 percent thresholds between the two datasets, but certainly not all.
The two different methods identify similar levels of total wealth in the United States in the 2020s but find different levels of wealth concentration. Saez and Zucman’s data series allows visibility into even higher cuts of the distribution, like the top 0.01 percent—a group of just 26,000 U.S. adults who each hold at least $125 million of wealth. (See Table 1).
Table 1
When tax policy modeling organizations such as the Tax Policy Center or the Yale Budget Lab consider potential wealth taxes, they typically use the Survey of Consumer Finances to determine how much wealth will be taxed because it is much simpler than trying to capitalize income. Despite using the same data source, these organizations’ revenue scores still come out quite differently because of behavioral assumptions about tax evasion and tax avoidance among those at the top of the distribution in each organization’s model. Rates of evasion and avoidance depend on how high proposed taxes are and typically range from 10 percent to 40 percent—or even higher in some cases.
Some proposed wealth taxes specifically target billionaires. This strata of wealth is poorly represented in the Survey of Consumer Finances, but Americans for Tax Fairness tabulates U.S. billionaires’ wealth with data from the Forbes 400, a list of the 400 wealthiest Americans and U.S. families produced by Forbes magazine yearly. In 2025, it found 959 billionaires in the United States.
Policymakers who wish to understand the distribution of wealth can also reference the Federal Reserve’s Distributional Financial Accounts, which draw on the Survey of Consumer Finances and the Financial Accounts of the United States to create up-to-date estimates of the concentration of wealth, as well as Equitable Growth’s Inequality Tracker, which visualizes the components of wealth reported in the Distributional Financial Accounts.
Measuring the distribution of income in the United States
The picture for income is a bit more complicated. In large part, this is because definitions of income often vary. Whereas most people may simply think of their incomes as their total wages for the year, economists and tax modelers typically add in other components, including the employer’s share of payroll taxes and 401(k) retirement savings accounts, and occasionally add in noncash benefits such as employer-provided health care. It is also common to equivalize income, which is an adjustment economists make based on the size of households—on the assumption that larger households can save money due to their economies of scale.
Although tax modelers’ income calculations are informative in certain circumstances, the simplest way to examine the income distribution is to use the IRS’s Statistics of Income Division tables. These provide statistics on Adjusted Gross Income found on annual tax return forms. Although these data are somewhat dated—the IRS just recently released figures for 2023, for example—they are based on real tax data, use an income definition that is comprehensible to most people, and show income thresholds into the very high end of the income distribution.
UC Berkeley’s Saez releases income data based on these IRS data and adds U.S. households that do not file tax returns. This makes the percentile thresholds for income more accurate, as the IRS’s thresholds are based on only the disproportionately high-income subset of the population that is required to file taxes. According to Saez’s data, $2.9 million of income, including realized capital gains, qualified a tax unit for the top 0.1 percent in 2022. (See Table 2.)
Table 2
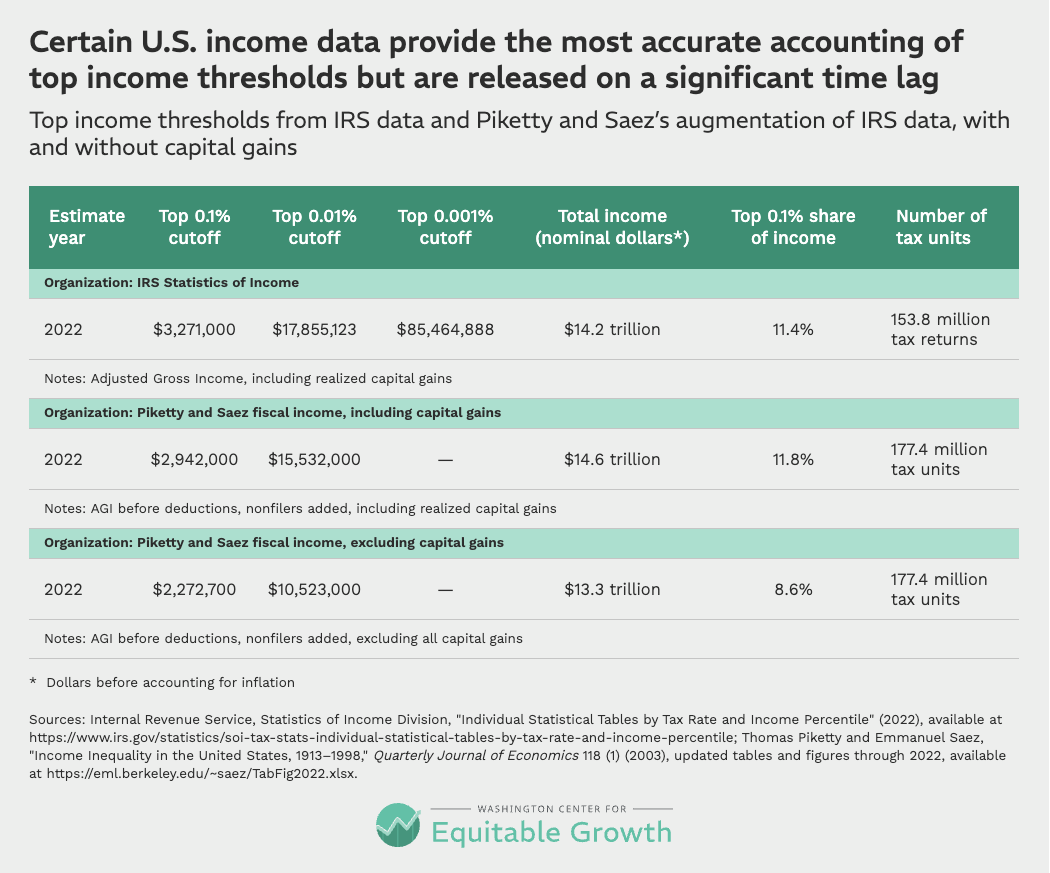
Including realized capital gains makes the incomes of very-high-income households volatile because households in the top 0.1 percent often see huge differences in their realized capital gains income from year to year. Realized capital gains tend to increase consistently during economic expansions and drop suddenly during economic recessions.
This makes thresholds at the top prone to rapid shifts. A threshold that captures 0.1 percent of U.S. households in one year might capture far fewer households the next year if realized capital gains income drops. Unrealized capital gains are also volatile and are rarely measured directly, although there have been recent attempts. Including unrealized capital gains in income would tend to push top incomes, and top income thresholds, higher.
As with wealth, some of the differences in revenue scoring by tax policy modelers are due to differences in behavioral assumptions rather than differences in income data. But unlike in the wealth context, modelers use different definitions of income and some equivalize income, sometimes leading to major differences in basic distributional information. This is a large part of why defining top income thresholds is complex.
Policymakers should be cautious when thinking about top income thresholds because the volatility of realized capital gains can lead to large changes in thresholds from year to year. Saez’s updated tabulations of income provide the simplest reference point for policymakers who want to understand the distribution of Adjusted Gross Income.
Conclusion
Estimates describing the distribution of income and wealth at any point in time in the United States can vary—sometimes significantly. There are two main reasons why this is the case. First, the method of measuring income and wealth and the data used to do so differ. And second, these thresholds also are impacted by the business cycle, inflation, or even changing patterns of household formation.
Still, understanding these discrepancies allows tax policymakers to make informed policy-design decisions on how to target the small slices of the U.S. population who hold the most income and wealth. Targeted tax increases on the wealthy can improve federal and state fiscal conditions, combat inequality, and spur equitable growth.
Did you find this content informative and engaging?
Get updates and stay in tune with U.S. economic inequality and growth!




Stay updated on our latest research