Personal Income in the United States nudges up in May but is down 0.76 percent in the past 6 months

Key Takeaways:
- Personal Income in May nudged up 0.23 percent but has fallen in 4 of the past 6 months. It has fallen faster for lower-income households over both the past 6 months and the past 3 months.
- Declines in income are concentrated in falling government transfers, a direct result of the expiration of Affordable Care Act health care subsidies and cuts to the Supplemental Nutrition Assistance Program and Medicaid in the One Big Beautiful Bill Act enacted by the Republican-led U.S. Congress and signed into law by President Donald J. Trump in 2025.
- U.S. households overall appear to be managing declining incomes by saving less of their monthly paycheck.
- What this means for growth: U.S. incomes are likely to continue declining due to rising inflation and falling wage growth. Households can draw on credit to continue consuming, but without significant relief from inflation, households will eventually have to dial back spending, and Gross Domestic Product growth will suffer.
Overview
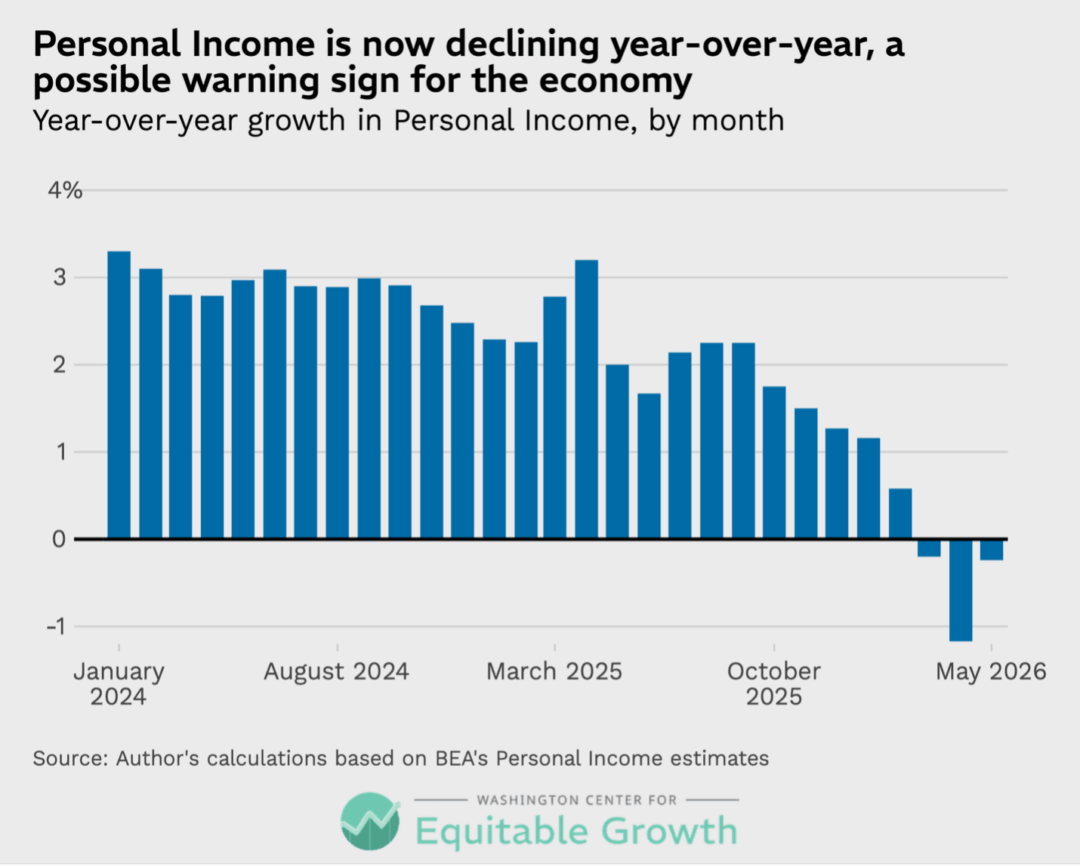
According to today’s release of Personal Income estimates from the U.S. Bureau of Economic Analysis, U.S. household incomes have fallen 0.76 percent in the past 6 months, with month-to-month declines in 4 of the past 6 months. Personal Income is an aggregate economic concept that is often ignored in favor of its big brother, Gross Domestic Product. But while GDP growth has shown some signs of weakness lately—growing just 0.5 percent in fourth quarter of 2025 and 2.1 percent in the first quarter of 2026 at annualized rates, compared to 2.8 percent in 2024—Personal Income has turned negative, a possible warning sign for the U.S. economy. (See Figure 1.)
Figure 1
Falling Personal Income could become a significant drag on the U.S. economy if it leads to households cutting back on consumption. Whether falling incomes lead to falling consumption depends on how the decline in incomes is distributed, which components of income are declining, and what other resources households have available to them.
Income losses over the past 3 months also have been highest for lower-income households. This, combined with a falling savings rate, suggests that while there is no imminent threat to economic growth, U.S. households may struggle if inflation continues and inflation-adjusted incomes keep declining.
How do falling incomes impact U.S. households across the income distribution?
Personal Income is a National Income and Product Accounts metric that measures U.S. household income and consists of wages and salaries, income from private business, rental income, interest and dividend income on assets, and government and nonprofit transfers to households. Personal incomes in the United States have been weakening for months but are now turning sharply negative in the face of energy-price inflation and declining government transfers due to the One Big Beautiful Bill Act enacted in 2025 by the Republican-led U.S. Congress and signed into law by President Donald J. Trump, which cut government transfer programs such as the Supplemental Nutrition Assistance Program and Medicaid and allowed enhanced Affordable Care Act health care subsidies to expire.
Since Personal Income consists entirely of income earned by households, it is the correct concept to use to understand household income inequality. The U.S. Inequality Tracker uses the Bureau of Economic Analysis’ Distribution of Personal Income dataset to track changes in inequality over time. The most recent release of that detailed distributional data provides estimates through the end of 2024. So, to estimate how households at different points in the income distribution are faring right now, I apply the 2024 estimates of the Distribution of Personal Income components to current estimates of aggregate income by component. In other words, my estimates assume that income inequality is unchanged since 2024.
According to my estimates, year-over-year declines in Personal Income have hit high-income households in the United States the hardest. But over the past 6 months, the pain was broadly shared in the bottom 90 percent, and in the past 3 months, U.S. households below the median have seen their incomes drop the fastest. (See Figure 2.)
Figure 2
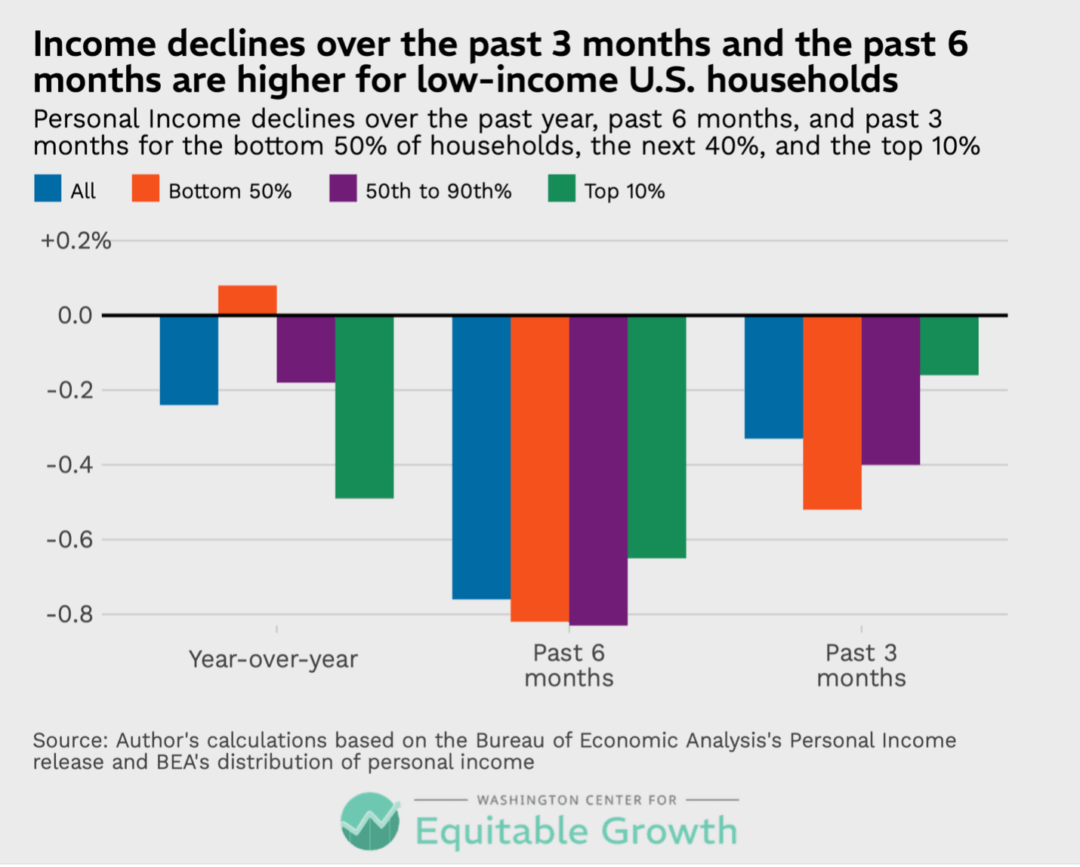
Declines have shifted toward the bottom 50 percent of U.S. households because transfer payments from the government have gone down significantly in 2026, and the bottom 50 percent of households are far more reliant on these transfers than other income groups. The primary cause of falling transfer payments is the end of enhanced Affordable Care Act subsidies, which caused many Americans to drop their ACA health insurance altogether and raised prices for those who remain enrolled in Obamacare. Declining transfers is also a consequence of cuts to SNAP benefits and Medicaid, although these cuts will mostly take effect later this year or in early 2027.
Asset income has declined quickly, too, although this income is concentrated among the top 10 percent of households (which earn 77 percent of all asset income in the United States) and does not include capital gains on financial assets. Business income, which is highly concentrated in the top 10 percent of households, has seen the largest gains over the past 3 months. (See Figure 3.)
Figure 3
How are falling incomes felt by different U.S. households?
It is important to think about how these declines are felt by actual U.S. households. Consider first that some households may not alter their patterns of consumption much because of expiring ACA subsidies, even though it is recorded as a decline in overall household income. Households that continued ACA marketplace coverage but are now receiving lower subsidies and must pay the difference will experience the expiration as a loss of income equal to the lost subsidies. Households that ended their ACA coverage as a result of the expiration of the ACA subsidies have lost a service, not income, and may even have more income available for consumption now because whatever part of ACA premiums were not subsidized for them is now unspent each month.
Similarly, even though there has been a significant decline in dividend and interest income earned from financial assets over the past 3 months, the stock market itself has been appreciating. Personal Income does not include any form of capital gains, so it excludes this appreciation entirely. Households that hold equities may, in fact, feel richer, even if their incomes from interest and dividends have declined, because their equity wealth has increased significantly this year. These households probably will not reduce consumer spending.
Declines in compensation are the most likely to lead to declines in consumption, and so far, U.S. wages have declined slowly. This decline may accelerate, however, as nominal wage growth continues to slow and inflation picks up.
How will falling incomes impact GDP growth?
Falling incomes will impact economic growth when and if they lead to falling consumption by U.S. households. Right now, real personal consumption expenditures after accounting for inflation are growing around 2.1 percent year-over-year, a bit slower than they were in early 2025 and most of 2024. This is hardly cause for alarm. In part, this reflects the factors detailed above—namely, that much of the decline in transfers is in-kind, and U.S. households with stock market holdings feel richer.
But there are other reasons Personal Income tends to only be weakly correlated with consumption. First, consumers may have savings to draw on that allow them to increase consumption even when their incomes are falling. It can be difficult to know exactly how much money U.S. households may have squirreled away. This was a primary concern of economists and policymakers in 2022, when inflation was surging but U.S. households had fat bank accounts from enhanced COVID-era economic stimulus programs. The most recent monthly savings rate, however, has declined to 3 percent of monthly disposable income, which suggests that U.S. households are saving less of their paychecks to offset declining real incomes. The last time the savings rate was 3 percent or lower was in June 2022, at the height of post-COVID inflation.
Second, consumers could be relying more on credit. There is little evidence of this in the data. The Federal Reserve reports that the rate of delinquency on credit cards is less than 3 percent. While that is a little elevated, compared to the pre-pandemic period, it is a relatively low rate by any other standard. Similarly, while payments on debt have increased modestly as a percentage of incomes, they are still relatively low. That suggests U.S. households have credit available to cushion falling incomes.
If incomes continue to decline, however, something must give. Either consumers will increase their use of credit, spend down savings, or reduce consumption. Although the current picture is not very worrying, it depends critically on the forward trajectory of incomes. Government transfers will continue to decline as cuts to Medicaid and SNAP benefits increase in late 2026 and into 2027. If inflation continues to rise, real wages will dip further, and, at some point, this will put stress on households. A final risk is a correction in the stock market that reduces household wealth and makes people with stock holdings feel poorer.
Conclusion
While it is not yet time for policymakers to panic, declines in Personal Income are a sign of stress for the U.S. economy. These declines contrast with other metrics, such as GDP growth and unemployment, both of which still indicate a stable and slowly expanding economy.
The U.S. economy has weathered small dips in Personal Income in the past, but there is reason to be alert to risks this time. The harmful consequences the Iran war show few signs of abating anytime soon, which will keep energy prices elevated for the foreseeable future and could spill over into other goods. And government transfer income is almost guaranteed to continue its downward trajectory due to cuts enacted in the One Big Beautiful Bill Act in 2025. While the U.S. labor market appears healthy, nominal wage growth continues its slow descent from high post-COVID levels.
All of these will eventually strain U.S. household budgets, absent some change, and falling Personal Income will start to drag GDP down with it.