Benchmarking the U.S. economy that President Donald Trump is set to inherit

Overview
When President Donald Trump takes the presidential oath of office again on January 20, he will be inheriting a very different economy, with a very different outlook, than the one he left for President Joe Biden four years ago. Almost immediately after President Trump’s inauguration next week, important questions will arise about how to measure the success of the U.S. economy and the effect of the new administration’s economic policy interventions.
Evaluating future economic performance under a second Trump presidency demands both an evaluation of the current state of the U.S. economy as the next administration takes the helm and a sense of the economic expectations going forward. Concrete benchmarks such as these should serve as yardsticks for the U.S. economy over the next four years.
This issue brief presents a number of these benchmarks for evaluating the economy under the second Trump administration. It surveys the latest actual data, as well as forecasts from credible private and public sources, and comes to four main conclusions:
- While the U.S. economy still has challenges, especially lingering inflation and poor consumer sentiment, many important economic metrics are outperforming the 2008 cycle (the most recent nonpandemic business cycle and the cycle in which the first Trump administration began), and some are even at historical highs.
- Some measures have already met goals set by the incoming administration, even before Inauguration Day. Real Gross Domestic Product growth, for example, has averaged 3 percent over the past two years.
- Expectations are for output growth to moderate to trend next year, inflation to take roughly two years to fully return to the Federal Reserve’s 2 percent target, and the unemployment rate to remain roughly at current levels.
- Economic forecasts even one year or two years out are highly uncertain.
First, let’s turn to what the data say about the current state of the U.S. economy.
Current U.S. economic data show strength
Broadly speaking, the data indicate that the U.S. economy in the later part of 2024 was in a strong position. Growth in output, measured by real GDP, and nonfarm productivity were above estimates of trend, employment levels were at near-historic highs, and real wage and income growth was positive. Though inflation was not yet fully back to the Federal Reserve’s inflation target of 2 percent, it was generally thought to be in the “last mile,” or the phase when inflation declines tend to slow as inflation approaches 2 percent. The risk of inflation reaccelerating, however, remains a concern. And some measures of labor market momentum, such as quits and hires, softened in recent quarters off of their prior strong reads.
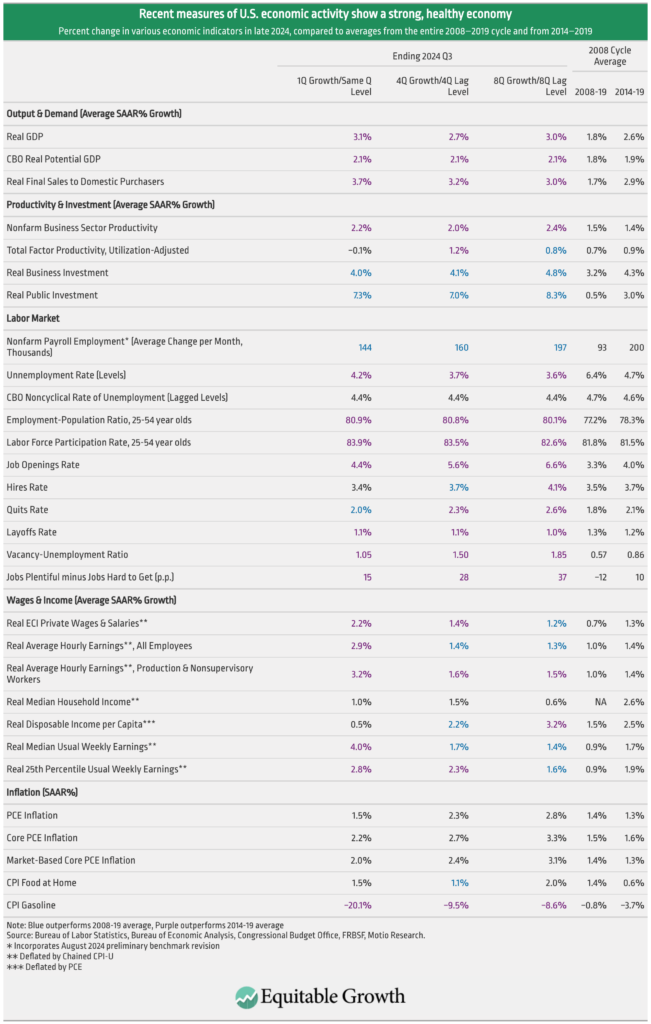
Table 1 below summarizes recent U.S. economic data and contrasts it with the performance over the 2008–2019 business cycle, which includes the Great Recession of 2007–2009 and the subsequent recovery prior to the onset of the COVID-19 recession in 2020. Numbers in blue are metrics that outperformed the average over the entire previous business cycle, while numbers in purple indicate metrics that outperformed the second half of the previous cycle, from 2014 to 2019, when the Great Recession recovery accelerated. (See Table 1.)
Table 1

As a caveat, economic aggregates are, by their nature, summary statistics that do not represent all lived experiences. Indeed, by definition, half of people are above and below the median. No one economic measure or set of measures perfectly encapsulates all the positives and negatives of the U.S. economy. With that said, were one to compare U.S. outcomes in 2025 and 2026 to those coming out of 2024, Table 1 gives a sense of what the most prominent metrics look like at the end of President Biden’s term in office.
Let’s now dive into some highlights from these data.
Output
Real GDP in the United States has grown at an average annualized rate of 2.7 percent over the four quarters ending in the third quarter of 2024 and by 2.9 percent on average over the prior eight quarters.
This is notable for a few reasons. First, the incoming Trump administration has set a goal for 3 percent growth, yet the economy of late is already performing in the vicinity of 3 percent. Second, private-sector expectations in 2022 were broadly for little to no growth the following year, which clearly turned out to be inaccurate.
As Table 1 shows, this year’s average GDP growth is not only faster than the average over the entire 2008–2019 Great Recession business cycle, when it was 1.8 percent, but also is faster than the average GDP growth over the latter half of the Great Recession recovery from 2014 to 2019, when it was 2.6 percent. Similarly, it is faster than the Congressional Budget Office’s latest estimates of potential GDP growth of 2.1 percent.
Productivity
The surprisingly high growth in U.S. output reflects upside surprises to both productivity and labor supply growth, but the productivity surprise has been the bigger recent driver. Over the past two years, productivity has averaged 2.4 percent annualized, versus 1.5 percent in the previous cycle, as seen in Table 1. Some of this strength reflects pandemic trend normalization, but this cannot account for all the surprise growth in productivity since the level of U.S. nonfarm business productivity is now above the Congressional Budget Office’s pre-pandemic projections.
As Table 1 shows, two key drivers of productivity growth are business and public investment. Real private nonresidential fixed investment has grown faster in recent quarters than the Great Recession average: It grew 4 percent over the past year, compared to 3.2 percent annualized between 2008 and 2019. Real public investment has even more significantly outpaced the previous cycle, with 6.8 percent growth over the past year versus 0.5 percent annualized over the Great Recession cycle.
The labor market
The U.S. labor market at the end of 2024 is the subject of much debate among both policymakers and workers themselves. On the one hand, many “level” measures of employment and labor utilization are at healthy, and even historic, reads. For instance, the employment-to-population ratio and the labor force participation rate for prime-age workers—25- to 54-year-olds, who tend to have the strongest ties to the labor market since they are the least likely to be in school or to retire—were both the highest in the third quarter of 2024 that they had been since the beginning of 2001.
Similarly good, the pace of nonfarm payroll employment growth (the most widely-followed measure of new jobs added to the labor market) averaged 144,000 per month during the third quarter of 2024—higher than the 2008 cycle average, despite being temporarily affected by labor strikes and October’s hurricanes in the South. And although the unemployment rate has risen recently from its cycle lows of around 3.5 percent, it is still around levels economists deem sustainable.
On the other hand, different measures of the labor market, especially “momentum”measures that look at trends in the labor market, are weaker or less extraordinary. Rates of hires, quits, and job openings are still broadly better than their 2008–2019 averages but have lost ground in recent quarters, which has been one of the rationales for the Federal Reserve’s decisions to cut interest rates. The job vacancies-to-unemployment ratio, at 1.05, is similarly tighter than the previous cycle’s average, signaling a strong labor market in which there is a job opening for almost every unemployed worker, but it has softened over the past two years.
For their part, U.S. consumers seem to be noticing the soggier labor market data. Nonprofit economic forecaster The Conference Board’s “Labor Market Differential,” which takes the share of survey respondents who sees jobs as plentiful and subtracts the share of respondents who sees jobs as hard to get, is still positive but at only half of the net share of two years ago.
Nevertheless, the current slow-hiring labor market is also a low-firing one, with the layoff rate near all-time lows.
Wages and income
Inflation-adjusted measures of wage growth, which had been negative for much of the COVID-19 pandemic, turned positive over the past two years as inflation fell while nominal income growth remained stable. In particular, real earnings measures have been positive in recent quarters, reflecting a combination of the tight labor market and strong productivity growth mentioned above. This is true of hourly measures (average hourly earnings), weekly measures (median usual weekly earnings), low-wage measures (25th percentile usual weekly earnings), and compositionally adjusted measures (the Employment Cost Index).
At the same time, real median household income—which is a broader measure of income that includes both wage and capital income, as well as some transfers such as Social Security—has generally grown more slowly than wages alone in recent quarters, albeit still positively.
Inflation
The Federal Reserve has an inflation target of 2 percent annualized growth in the personal consumption expenditures, or PCE, price index. Falling energy prices helped pull headline PCE inflation down to 1.5 percent annualized in the third quarter of 2024 alone. Over the past year, inflation has remained above but close to the Fed’s target: 2.3 percent headline PCE, 2.7 percent for PCE excluding food and energy (a measure of trend inflation that excludes volatile food and energy categories), and 2.5 percent for market-based PCE excluding food and energy (further excluding volatile financial services and other imputations).
Recent inflation reads are consistently above 2008–2019 cycle averages, though it is important to note that the Federal Reserve has been criticized for letting inflation come in too low during the previous cycle at the expense of the labor market.
Current U.S. economic expectations and forecasts
All of the recent data surveyed in Table 1 are unlikely to endure at the same pace going forward. For instance, average productivity growth of more than 2 percent over the past two years has been a welcome surprise, yet it is not clear that underlying potential productivity has risen in tandem with actual productivity. Indeed, the Congressional Budget Office estimates that potential productivity is currently only 1.3 percent. As such, a reasonable expectation could be for productivity to revert back to trend over time—although, of course, trend estimates themselves are prone to error.
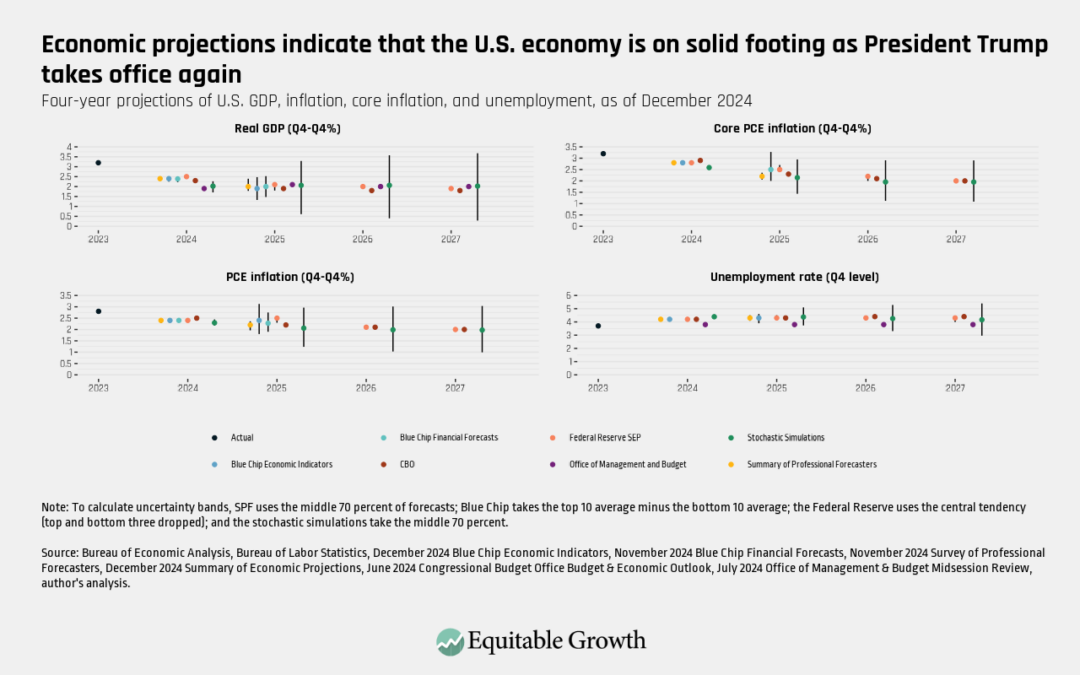
As policymakers and researchers set benchmarks for economic performance over the next four years, therefore, in addition to looking at recent actualdata, it is useful to also review current expectations and forecasts of where many of these indicators will go as we head into 2025 and beyond. (See Figure 1.)
Figure 1

As Figure 1 shows, the forecasts—from seven private- and public-sector sources, along with a stochastic simulation I performed to map near-term uncertainty—paint a consistent picture of how observers expect the U.S. economy to evolve over the next few years.1 (See endnote for a description of the sources and the stochastic simulation.)
Output
Private forecasters see real GDP growth of roughly between 1.5 percent and 2.5 percent over 2025 (measured between Q4 2024 and Q4 2025), with virtually all the forecasters converging on a central estimate of 1.9 percent to 2 percent. This would be a meaningful step down from 2024’s growth rate—broadly seen as coming in at 2.4 percent—and a reconvergence of the economy with trend.
Interestingly, the Philadelphia Fed’s Summary of Professional Forecasters sees the balance of growth risks as weighted more to the upside than downside (meaning there is slightly more of a chance that their central estimate is too low, rather than too high), whereas Blue Chip forecasters are much more symmetric in their assessment of the risks around growth. The Federal Reserve, meanwhile, sees slightly more downside risk against its median forecast for 2025.
Likewise, the simulations I performed are symmetric around 2 percent growth beginning in 2025 but do see a roughly 15 percent risk of 3.5 percent growth over 2025, 2026, or 2027—and about the same risk of 0.5 percent real growth in those years.
Unemployment
Private-sector forecasters see the unemployment rate at the end of 2025 anywhere from 3.9 percent to 4.6 percent, centered around 4.3 percent, implying an essentially flat unemployment rate all throughout 2025.
At the same time, the median participant in the Federal Open Market Committee—the Federal Reserve entity that sets the federal funds interest rate—sees 4.3 percent unemployment at the end of 2025, only slightly more of an increase than the private sector and a near-convergence with the CBO estimate of the noncyclical rate. Rates then tick down in 2026 and 2027, respectively.
The simulations I ran suggest that risks around these outcomes are wide, with the 70 percent confidence band in 2025 between 3.7 percent and 5.1 percent unemployment.
Inflation
The Blue Chip Economic Indicators forecast shows a wide range of disagreement over inflation outcomes in 2025, with PCE inflation ranging from 1.8 percent to 3.1 percent, centered at 2.4 percent. This represents essentially no headline disinflation, compared to 2024. The forecast also has core PCE inflation almost as tenacious, only falling to 2.5 percent in 2025 from 2.8 percent in 2024. The Federal Reserve’s SEP has similar levels of PCE and core PCE inflation in 2025.
It is important to note that these Blue Chip and Federal Reserve forecasts, published in December 2024, may incorporate expectations of the incoming Trump administration’s proposed policies, including around introducing broad new tariffs and plans for sweeping deportations of undocumented immigrants, both of which are generally expected to put upward pressure on prices in the United States.
Other private forecasters generally came in lower on inflation. The median Summary of Professional Forecasters headline PCE projection for 2025 was 2.2 percent, while the Blue Chip Financial Forecasts has a median of 2.3 percent for 2025. Both forecasts also have core inflation at 2.2 percent and 2.1 percent, respectively; both of these composites were published in November 2024.
Conclusion
The incoming Trump administration is taking the helm of a U.S. economy largely on solid footing—one with near-3 percent real GDP growth and greater than 2 percent productivity growth, positive real wage growth, high employment levels and low layoffs, and inflation that is largely seen to be in its last mile and expected to moderate over the next couple of years. The evolution of the U.S. economy over the next several years therefore should be measured against this extraordinary starting point and the expectations of observers currently living through it.
End Notes
1. Four of these sources—the Blue Chip Publications’ Economic Indicators and Financial Forecasts, the Summary of Professional Forecasters from the Philadelphia Fed, and the Federal Reserve Summary of Economic Projections—are composites of multiple individual forecasts. These measures show bands around each point that capture roughly the central 70 percent of individual forecasts. Two sources—projections from the Congressional Budget Office and the current administration—are only reported by their sources as single-point forecasts, without uncertainty bands. Yet even showing a range of composite forecasts likely does not fully capture uncertainty; for example, the spread of forecasts will appear tight if individual forecasters herd their modal values among one another, even if each forecaster in actuality sees a wide range of possible outcomes. To better illustrate near-term economic uncertainty, I add my own stochastic simulation using the Federal Reserve’s workhorse FRB/US model. In essence, the exercise models the U.S. economy over the next four years, randomly shocks it either positively or negatively based on historical experience, repeats the process thousands of times, and shows the middle 70 percent range for the metrics of interest. More specifically, I used the October 2024 public release of FRB/US, which is calibrated to the September 2024 Summary of Economic Projections. The only policy modification I made to the October 2024 baseline is a reduction in personal tax rates beginning in 2026 roughly commensurate with the magnitude of full extension of the Tax Cuts and Jobs Act. The simulations use VAR expectations and assume the Federal Reserve reaction function follows a conventional Taylor 99 rule; fiscal policy and the neutral rate of interest are exogenous. I run 10,000 simulations beginning in 2024 Q4. The shocks are randomly drawn from the 1970 Q1 to 2019 Q4 period. Note that this exercise does not constitute an official Federal Reserve forecast.


