Evening Must-Read: Paul Krugman: Inflation, Septaphobia, and the Shock Doctrine

Paul Krugman: Inflation, Septaphobia, and the Shock Doctrine: “The bad news from Europe is a reminder that the basic insight…

…some of us have been trying to convey, mostly in vain, ever since 2008 remains valid: the great danger facing advanced economies is that governments and central banks will do too little, not too much…. Yet the power of the hard money/fiscal austerity orthodoxy (yes, market monetarists want one without the other, but they have no constituency) remains immense. Why?… The one percent (or actually the 0.01 percent)… have much more to gain from asset appreciation than they have to lose from the small chance of runaway inflation. In fact, if you compare stock prices in the US, with its aggressively easing Fed, with Europe, you can see the difference…. An alternative is selective historical memory. Some time ago Kevin Drum suggested that it’s all about septaphobia, fear of the 1970s…. Finally, there’s the notion that it’s implicitly about politics: crises are a chance to force “reforms” that strip away worker protections and the welfare state, and any suggestion that technical solutions, monetary or fiscal, could do the job is rejected. The thing is, it sure looks like a form of false consciousness on the part of elite. But I’m still trying to figure it out.

Reversing inequality at the bottom: The role of the minimum wage

There are many factors affecting the growth in wage inequality in the United States over the past four decades. When it comes to workers on the bottom rungs of the income ladder, one important factor is the minimum wage.

The federal minimum wage reached its high-water mark in 1968, when it stood at $9.59 per hour in 2014 dollars, declining to a still-respectable $8.59 by 1979. During the 1980s, however, the real (inflation-adjusted) minimum wage declined substantially. And over the past 20 years, the minimum wage has largely treaded water, reaching a historical low of $6.07 per hour in 2006 just before the last federal increase in 2009. The minimum wage now stands at $7.25 per hour in today’s dollars.

The failure of the minimum wage to keep up with inflation means that, for workers earning the minimum wage, each hour of labor purchases less goods and services today than it did in the past.

Minimum wage workers are not only (contrary to popular belief) teenagers and young adults whose low wages are supplemented by their families. In fact, between 1979 and 2011, the share of low-wage workers—defined as those with wages of $10 or less in 2011 dollars—under the age of 25 years of age fell to 35.7 percent from 47.1 percent.1 Instead, minimum wage workers are increasingly adults who must rely exclusively on their meager earnings to support basic household consumption. The decline in the value of the minimum wage affects female workers in particular, as they tend to be paid lower wages.

Low minimum wages are also problematic when they deviate too far from the median wage because that means minimum-wage earners are falling farther behind
on the income ladder. This is why economists often use the ratio of the minimum to the median wage. The so-called 50/10 wage gap—the median wage earner compared to those with earnings in the bottom 10 percent of the income ladder—captures this type of wage inequality over time. Since 1979, around a third of the changes in the 50/10 wage gap have been driven by changes in the minimum wage.

There are two main reasons to pay attention to this measure. First, a comparison of the minimum wage to the median offers us a guide to how many workers are affected by a particular minimum wage increase, and what level of minimum wage the labor market can bear. When this ratio is low—say around 0.2—the policy is not raising wages of many workers. In contrast, a high ratio—say around 0.8—indicates a highly interventionist policy where the minimum wage is dramatically compressing differences in wages for nearly half the workforce.

Second, the median wage provides a reference point for judging what is a reasonable minimum wage level. No one expects that the minimum wage should be set equal to the median wage, but fairness concerns matter when the minimum wage falls below say, one-fourth or one-fifth of the median wage.2

A natural target is to set the federal minimum wage to half of the median wage for full-time workers. This target has important precedence historically in the United States. In the 1960s, this ratio was 51 percent, reaching a high of 55 percent in 1968. Averaged over the 1960–1979 period, the ratio stood at 48 percent. Today, the ratio stands at 38 percent. Raising the federal minimum wage to around $10/hour would restore the value of the minimum to around half of the median full-time wage, yet efforts at raising the minimum wage have largely stalled in a deeply divided Congress despite widespread political support around the country.

This federal inaction has led to a flurry of activities at the state and local level. States have stepped in during periods with a stagnant federal minimum wage in the past, especially the 2000s, but for the first time in U.S. history we have many major cities establishing citywide minimum wages for all (or most) private-sector workers. The growing list of cities with such a policy now includes Albuquerque, Chicago, San Francisco, San Diego, San Jose, Santa Fe, Seattle, and Washington, DC. Other cities such as Los Angeles and New York are actively exploring possibilities.

This push to increase minimum wages in big cities coincides with organizing by workers in fast-food chains in major metro areas. The target minimum wage in most of these areas is substantially higher in nominal (non-inflation-adjusted) value— with $15/hour a focal point for these campaigns. The confluence of these factors raises the possibility of substantially altering wage standards in the U.S. labor market.

How should we think about these sizable increases in the minimum wage? First, we should be careful not to overstate the size of the increases or the levels of the minimum wages because the cost of living and overall wage levels vary tremendously by region. Setting the minimum wage to half the full-time median wage would produce $10/hour policy nationally, but much higher figures in major metro areas such as Washington, DC ($13.51), San Francisco ($13.37), Boston ($12.85), New York ($12.25), and Seattle ($11.85).

Moreover, these higher nominal wages are usually phased in gradually. In Seattle, the hourly minimum wage will eventually rise to around $14 in 2014 dollars. This constitutes around 59 percent of the median full-time wage in that metro area, which is certainly higher than historical standards but not outlandishly so.

So what we do know about the impact of minimum wages over the past few decades and the importance of particular channels for the higher, local wage standards? First, most careful recent work points to relatively small impact on employment—be it for sectors such as restaurants or retail or for groups such as teens.3 As a result of wage increases and small impact on employment, family incomes rise at the bottom. A 10 percent increase in the minimum would reduce the poverty rate among the non-elderly population by around 2 percent, and generally raises family incomes for the bottom 20 percent of the family income distribution.4

It is possible that the much larger increases in minimum wage may induce greater substitution of low-skilled labor with automation, or with fewer but more high-skilled workers? If this is true then we would expect evidence of growing “disemployment” (workers out of a job due to lack of skills or education) from these higher city-wide wage standards. Yet recent research also identifies some additional benefits that may be more important than larger wage increases. A growing body of research shows that while the impact on employment stock is small, there are larger reductions in employment flows or turnover.5 The reduction in turnover provides additional evidence that search frictions in the low-wage labor market are quantitatively important and offer some clues as to the way cost increases may be absorbed.

Given the cost of recruiting and training new workers, for example, reduction in turnover can be expected to offset about a fifth of the labor-cost increases associated with minimum wage hikes in this range. I think the large city wide increases will provide us with some additional evidence on this topic. In particular, I believe it should be possible to assess whether the lower turnover regimes lead to substantially different training policies as would be predicted by some models incorporating “search friction”—things that prevent or make it more difficult for workers to find the kind of jobs they want.6 Moreover, it will be interesting to see whether change comes from the extensive margin (growth in high-training/low-turnover firms) or the intensive margin (change within firms).

The nature of high-cost metro areas means that a substantially higher minimum wage may allow more lower-wage workers to live closer to their place of work (inside the city) and reduce commute time. The labor-supply effect from this “in-migration” also can reduce recruitment costs and improve the quality of the service work force.

These additional channels will be useful to keep in mind in future research. Evidence also suggests that, in part, cost increases associated with a higher minimum wage are passed on to customers as price increases, especially for industries that employ high levels of low-wage labor. The best evidence suggests that a 10 percent increase in minimum wage would raise fast food prices by around 0.7 percent.7 There are reasons to believe that the higher income customers inside major cities are better able to absorb price increases without cutting back on demand. Limited evidence from San Francisco tends to confirm this observation.8

Finally, there is some evidence that low-wage workers substantially increase consumption in response to wage hikes.9 Daniel Aaronson and Eric French at the Federal Reserve argue that the higher marginal propensity to consume among low-wage workers is likely to lead to some short-term increases in economic growth from a minimum wage increase.10 My reading of the evidence is that it is somewhat difficult to accurately assess the importance of this channel, in part because the relatively small number of minimum wage workers makes any aggregate demand effect fairly small. But I do think that the size of increases and possible in-migration of low-wage workers into urban areas may increase the local demand impact of a city wage standard.

Minimum wage policies are a powerful lever for affecting wage inequality in the bottom half of the labor market. Modest increases in minimum wages can raise the bottom wage, and family incomes, without substantially affecting employment. But minimum wages are limited in their reach, and cannot be expected to solve all our problems when it comes to wage inequality. At the same time, the much higher wage standards being implemented in some of the cities offer the possibility of taking this policy “to scale.”

Along with this greater promise, however, come added risks. The reality is that we do not know very well how these policies will affect the local economy. Future researchers would do well to utilize the careful identification strategies that have been the hallmark of recent minimum wage research to study these high city wide minimum wage increases. Doing so will deepen our understanding of the functioning of the low-wage labor market, and help us gauge the proper scope of this important public policy.

Inequality and the wellbeing of the poor in the United States

How does the rise in economic inequality affect workers and their families at the bottom of the income ladder? To begin to approach an answer to such a question, it is important to first understand the facts on the ground. What have these workers and their families experienced over the past several decades? A common but deeply flawed measure of their wellbeing over the years is the official poverty rate, which fluctuates over a fairly narrow band but remained essentially flat since President Lyndon B. Johnson’s declaration of the War on Poverty in the mid-1960s.11

This is not the forum to rehearse the litany of reasons why the official poverty rate is fundamentally flawed. But perhaps its biggest shortcoming is that it doesn’t count the many resources directed toward low-income families when measuring income. These resources include in-kind benefits such as supplemental nutrition assistance (what we used to call food stamps) and housing assistance, but also after-tax benefits such as the Earned Income Tax Credit and the Child Tax Credit.

When these resources are properly accounted for in a poverty measure, my colleagues and I at Columbia University demonstrate that poverty rates fell by about 40 percent over the past half century, from 26 percent in 1967 to 16 percent today.12 We have made more progress than we thought in fighting poverty in the United States since the 1960s. That is the good news. The bad news is that the declines I note above have come entirely because of the work of government policies and programs—not because low-income workers and families have succeeded in the workplace.

Indeed, aside from the latter half of the 1990s, low-income workers and families generally fared poorly relative to their more advantaged peers in the middle class and especially compared to the wealthy in terms of income growth. Absent resources from government programs, poverty (properly measured) would have actually increased between the 1960s and today—from 27 percent to 29 percent, equal to about 37 million people.13

Focusing exclusively on numbers and percentages surrounding a specific poverty line, however, obscures other trends in income and the wellbeing of the poor. Recent data that my colleagues and I are collecting for a new longitudinal study of New York City residents tells us that actual levels of material hardship—the inability to meet one’s routine expenses—are actually quite a bit higher than poverty rates, even as properly measured. This means we need to think about those at the bottom of the income spectrum as not just those who fall below some predetermined poverty line but also those who find themselves consistently struggling to keep pace with what it costs to get by in contemporary society.

So a key question is whether the run-up in income inequality over the past five decades is a driving force of the economic woes of the less fortunate or simply another measure of it. The poor are doing better than in the past thanks to government programs that help alleviate poverty and give them the opportunity to climb the bottom rungs of the income ladder, but at the same time we know the fortunes of those at the top are far outpacing those at the bottom.

If, as some contend, the wellbeing of the poor is dampened by the rise in inequality, then we are justified in attempting to reduce income inequality in order to improve the lots of the less fortunate. But if the two are merely jointly determined—say by the rising returns on a better education that are (partially) the result of market forces—then reducing income inequality by itself is likely do little to improve the long-run wellbeing of the poor aside from helping the poor to get by and consume more from their income.

What do we know about whether rising income inequality in the United States reduces the wellbeing of the poor? Unfortunately, not very much. Cornell University economist Robert Frank argues that as inequality rises we see a pattern of so-called “expenditure cascades” as people further down the economic ladder essentially try to consume enough to “keep up with the Jones’” just above them.14 University of Chicago economist Marianne Bertrand finds that rising inequality leads to reductions in disposable income further down the income ladder, though she is not explicitly focused on the wellbeing of the poor.15

But these studies spark very provocative questions. Does increased inequality not only lead to an increase in consumer prices but also changes in consumption patterns in a way that causes income to not go as far for the poor as it might? And do these processes have actual negative effects on the overall wellbeing of the poor? Identifying such effects using common econometric methods, however, remains challenging.

So it is still an open question whether rising levels of inequality harm less-skilled and lower-earning families. Even if government programs and policies keep disadvantaged individuals and families afloat, sociologists still might question whether income that comes once a year in the form of tax refunds or once a month in the form of a Supplemental Nutrition Assistance Program card is as useful as income from a regular paycheck, which provides benefits both remunerative and potentially cumulative, given that over time, that job may turn into a career.

What is ultimately most important is not whether people have enough resources over the course of a year to meet a somewhat arbitrary line of what experts think they need. Rather, we need to know whether people are truly able to harness their resources to meet both their daily and monthly expenses while simultaneously investing in their own and their children’s future.

In short, understanding whether and how economic inequality affects those at the bottom of the income spectrum is central to the success and wellbeing of our nation.

Our future depends on early childhood investments

It is startling to think that even before a child sits down on her first day of kindergarten and reaches for her crayons, we can already reasonably predict what she will earn as an adult. Research shows that early language development, understanding of math concepts, and social emotional stability at age five are the greatest predictors of academic success in school. In fact, skills learned before age five can forecast future adult earnings, educational attainment, and employment.16

These findings have real implications for our economy. Human capital—the level of education, skills, and talents of our workforce—is a main driver of economic growth, so in order to ensure we have a healthy workforce and thriving economy in the decades to come, we must begin by developing human capital during early childhood.

Yet rising economic inequality and unstable economic growth define our society today. Children have different enrichment experiences during this critical time period based on where their families sit on the income ladder. About half of children In the United States receive no early childhood education.17 These different experiences translate into a growing educational achievement gap between poor and rich children.

One study—often referred to as the famous “30 million word gap” study by University of Kansas child psychology professors Betty Hart and Todd R. Risley—finds that children living in poverty hear 30 million fewer words by age four than higher-income children.18 On average, a child from a low-income family knows 500 words by the age of 3, compared with 700 words for a child from a working-class family and 1,100 for a child from a professional family.19 Research by Stanford University infant psychology professor Anne Fernald and her colleagues found that by even age two, there is a six-month gap in language proficiency between lower-income and higher-income children.

In short, the educational achievement gap between poor and rich children begins well before kindergarten.

How can we better prepare our nation’s youngest generation for success? According to University of Chicago economist James J. Heckman, educational and enrichment investments during early childhood yield the highest return in human capital compared to other investments over time.20 Why? Because as the brain forms, children learn cognitive skills such as language and early math concepts as well as “soft” skills such as curiosity, self-control, and grit. Both skillsets are critical for later academic and workplace success. By the time a child enters Kindergarten, the gap in school readiness is large and well established, growing by less than 10 percent between Kindergarten and high school.21

School readiness is enhanced by what happens in preschool, but the two factors that most explain the achievement gaps are parenting styles and home-learning environ-ments.22 Yet many parents are unaware of the importance of early brain development and of the tremendous impact they can have in building their young child’s brain and early vocabulary with simple actions such as talking, reading and singing.

Even if parents are aware of the importance of these activities, they may have difficulty carving out time at home with their children as they juggle jobs and their children’s needs. Today, more children than ever are raised in single-parent families or in homes where both parents work. Parents today are constantly balancing work and family care often without access to family-friendly workplace policies to balance the two.

To be sure, if parents are unable to provide enriching home experiences then children can gain valuable developmental and learning support in quality child care and preschool settings. Yet many simply cannot afford childcare. In 2011, the average cost for a 4-year-old in professional childcare ranged from about $4,000 to $15,000 a year.23 Such costs put a major strain on family budgets, especially for low-income families, which spent nearly a third of their income on childcare (30 percent) in 2011, compared to middle- and higher-income families, which spent less than one-tenth (8 percent) of their income.24

What’s more, low-income families who do strain to pay for child care often find that the care they can afford is, at best, a safe place for their child to stay while they are at work rather than an enriching environment for their young child to learn critical skills. Sadly, these families often discover that the affordable childcare provider offers poor or mediocre support to help their child in the critical stages of early childhood development.25

In order to have a productive workforce and thriving economy tomorrow, we need to invest in our children today. There are viable policy solutions that could expand early childhood education and enrichment opportunities to all, rather than a select few at the top. First, voluntary home visits by child development professionals could increase awareness among working-class parents of how they can foster their children’s development at home, such as talking, reading, and singing to their children before bedtime.

Second, it is important to expand access to high-quality, affordable early child-hood education. These programs better prepare children for school, putting children more than a year ahead in mathematics and other subjects.26 Low-income families would greatly benefit from expanded access to quality childcare, Early Head Start, and high-quality preschool programs.

Lastly, parents can only be better first teachers of their children if they have the time to be with their children. Policies such as workplace flexibility, paid family and medical leave, and paid sick days could help all working parents better manage work and family obligations and spend more time with their children. Today, professional workers are the most likely to have access to these policies, often considered additional employee “perks” by employers.

The importance of investing in early childhood matters for our overall economic competitiveness. The United States should be making smart economic investments in early childhood to ensure that all children have an equitable start before their first day of school. For the American Dream to shine well into the 21st century, it is no exaggeration to say that every American, young and old, needs our youngest ones to be the best and the brightest as adults no matter their family background and income level.

One nation under worry

As study after study shows, the rich are doing better than the rest of us. But surprisingly, they don’t always presume that their wealth will protect them or guarantee their children’s futures. In talking with families across the class spectrum about how they coping in an uncertain age for my new book, “Cut Adrift: Families in Insecure Times,” I learned that even the affluent families don’t think they have enough and strive to attain more.27 In contrast, the working- and middle-class families I spoke with realize they can’t do much to improve their situations so they lower their expectations and try to get by on less.

This is the new face of economic inequality in the United States today. Most every-one is dealing with economic insecurity, yet the ways in which families on different rungs of the income ladder are doing so may be fueling greater economic inequality.

Take Paul Mah, a technology executive with assets of more than $1 million. “We are probably in the top 1 percent of all American households,” says Mah, “so I can’t complain, but I still don’t feel rich.” Only accumulating millions more, he says, would enable him to stop feeling anxious about his financial future and the prospects of his children.

In contrast, Laura Delgado, a struggling single mother of three who works as a cashier, has zero savings, but in many ways is less concerned. “Having nothing isn’t always a bad thing,” she says, noting that things could always be worse. To cope with her financial trouble, Delgado scales back her definition of security to just the basics (food, shelter, clothing) and filters out bad news by always trying to look on the bright side of things. Her approach enables her to control the anxiety she feels about her difficult economic situation.

These are just two of the emotional stories behind the statistics documenting that we live in precarious times. As Americans scramble to hold on to jobs, deal with pay cuts, afford rising college tuition, fund retirements, manage debt, weather the costs of medical emergencies, and give their children an edge in an increasingly competitive world, there are deep psychological reverberations—for us all.

Of course these reverberations look and feel differently for different groups of Americans. As economic insecurity grows—a reflection of the many changes and challenges in our economy today—so too has the divide in our country between the haves and the have-nots. This means families face different obstacles and can overcome them, or not, depending on the resources at their disposal.

Like Laura Delgado, many middle- and working-class families I talked with are so beaten down that they are letting go of their dreams for a better life. Instead, they try to make the insecurity they face more tolerable. When Laura must choose whether to pay the power bill or put food on the table for example, she makes light of the lack of heat in her home by telling her kids it’s just “camping.”

Affluent families respond differently. Rather than trying to adjust to greater inse-curity, they seek to protect their families by continuing to climb the wealth-and-income ladder. Security for some of the wealthiest families I talked with meant accumulating a net worth of more than $10 million. Such eye-popping definitions of security leave many affluent families more worried at times than their less fortunate compatriots further down the ladder.

In our go-it-alone age, we all adopt ways of coping—ways of thinking and feel-ing—that help us navigate through choppy and dangerous waters. These different approaches to managing insecurity reveal that in hard times the divisions among us are not just economic, they are also emotional.

Emotional disparities like these have real consequences. As the rich push for more and everyone else tries to accommodate to less, we actually make inequality worse. Because we treat economic insecurity as a personal problem rather than a social problem that we can solve collectively, we are unable to muster the will to stop it.

What the wealthy know and believe about economic inequality

The wealthiest one percent among us in the United States are pulling away from everyone else, a trend documented by numerous economists and highlighted often by the media. Despite all this attention on inequality, there is a dearth of empirical research on what the wealthy know and believe to be true about this trend.

Recent research on social stratification and mobility in our country examines the beliefs of ordinary Americans about the growing wealth and income gaps, but few academics are talking directly to the wealthiest Americans about their own per-ceptions. It is notoriously difficult to interview wealthy subjects. It is hard to find them, given their scarcity in the population. Once you identify possible subjects, it is hard to gain their cooperation, particularly when discussing topics they find uncomfortable, such as income and wealth inequality.

How the very affluent view economic inequality is important because what they know and think influences how they interact with our political leaders responsible for translating these views into public policies. If policymakers respond disproportionately to the affluent and the majority of the wealthy do not favor government programs to ameliorate inequality then it is especially important for scholars and policy experts to learn what ideas and preferences the wealthy embrace. In contrast, if the majority of the very affluent favor steps to rectify the wealth and income gaps, then policymakers can consider enacting programs that are favored more by the general public.

I study wealthy Americans to find out what they believe about income and wealth inequality.28 My data come from two sources. The first is the Survey of Economically Successful Americans and the Common Good, or SESA, which was pioneered by Northwestern University political science professor Benjamin Page and Vanderbilt University political science professor Larry Bartels and funded by the Russell Sage Foundation.29 NORC at the University of Chicago conducted the survey in 2011. Respondents had an average of $14 million in household wealth (median of $7.5 million), making the sample representative of the wealthiest one-to-two percent of Chicago-area residents.

Most national surveys with representative samples capture very few respondents from the top of the wealth distribution. While it targets the Chicago metropolitan area, SESA is among the very few data sets on the wealthy and includes questions on a variety of topics, from economic mobility to taxes, retirement, philanthropic and charitable volunteering and giving, and other areas. As a survey, however, SESA was limited in the depth to which respondents could answer any particular question.

Upon reviewing the original survey sheets with interviewer notations in the margins, I found that the wealthy were eager to express more nuance than closed-ended survey responses provided. To complement the survey data with more detail, I am compiling a second source of information by conducting in-depth interviews with economically successful Americans from across the country. These interviews focus much more specifically on subjects’ beliefs about economic inequality and mobility, politics, and public policy.

As of August 2014, I have conducted 89 interviews ranging from 45 minutes to three hours in length. I spoke with top income earners and top wealth holders, who I recruited based on the chain-referral method. Although my sample
is not statistically representative, this methodology has allowed me to collect data on the beliefs of wealthy Americans from different geographic regions and backgrounds. Interview respondents had an average of $8.2 million in household wealth (median of $4.7 million). The interview sample was not as wealthy as the SESA sample overall, but more than half of my interviewees were within the top one percent of the income or wealth distributions. Interview subjects were from 18 different metropolitan areas across 15 states and the District of Columbia and worked in a variety of occupations and industries.

Despite the methodological differences, the interview questions that duplicated SESA questions yielded very similar patterns of answers. My research is on-going, but I have some preliminary results to share, with the important caveat that I am continuing to analyze my data and hope to conduct approximately ten more interviews.

The wealthy are aware of economic inequality and recognize that it has grown in recent decades. In the SESA data and my own in-depth interviews, the vast majority of respondents knew that income inequality is larger today than it was 20 years ago. They also tended to express a desire for a lower level of income inequality. Approximately two-thirds of respondents believed that income differences in our society are too large.

The wealthy also recognize that the distribution of wealth across society is very skewed. In fact, they tend to overestimate the proportion of wealth held by the top one percent. Based on the SESA data and my preliminary interviews, the median perception of the respondents so far was that the top one percent hold approximately half of all U.S. wealth. (According to New York University economist Edward Wolff, the wealthiest one percent held a 35 percent share of the country’s household net worth, as of 2007.30) In my interviews, I also probe subjects about how large a share the wealthiest one percent “ought” to hold. Only about two-fifths of interview respondents believed that the wealthiest one percent ought to hold less.

In short, both survey and interview respondents tended to agree that income inequality is too high. But my interview data show that the wealthy did not necessarily believe that there should be less wealth inequality.
As much as the wealthy appear to be aware of growing economic inequality, they did not necessarily favor any kind of public intervention to remedy or ameliorate the trend. In fact, the wealthiest SESA respondents favored cutting back federal government programs such as Social Security, job programs, health care, and food stamps. Only 17 percent of SESA respondents thought that the government should “redistribute wealth by heavy taxes on the rich.”

Among my interviewees, very few were in favor of raising taxes to redress economic disparities, although a minority supported public intervention in the form of job training and other programs aimed at increasing economic opportunity. In general, many interview subjects were very pessimistic about the future of inequality trends and did not foresee any slow down in the growing bifurcation between the wealthy and the rest of society.

As a group, then, the wealthy are well informed about current events and public affairs, according to my preliminary interviews and the SESA data. They pay attention to the news and are very politically active, so understanding and considering their preferences are important. My preliminary findings indicate two emerging patterns: The wealthy know that economic inequality is rising, but they do not agree that anything should or can be done to reverse the trend. My analysis is at an early stage, and much more research must be done in this arena in order to inform a productive dialogue between scholars and policymakers.

Income inequality affects our children’s educational opportunities

One of the clearest manifestations of growing economic inequality in our nation today is the widening educational achievement gap between the children of the wealthiest and the children of everyone else. At first glance, this sounds like an obvious outcome. After all, wealthier families are able to afford expensive private schools, or homes in wealthy public school districts with more educational resources.

But a closer look at this education achievement gap over the past 50 years or so shows that the gap only began to widen in the 1970s, right about the time that wealth and income inequality in our nation also began to grow. The past 30 years have seen a sustained rise in inequality in wages, incomes, and wealth, leading to more and more income and wealth accruing to those at the top of the economic ladder, pulling the rich further away from those on the other rungs.31

At the same time, the growing educational gap became ever more apparent. In the 1980s, the gap between the reading and math skills of the wealthiest 10 percent of kids and poorest 10 percent was about 90 points on an 800-point SAT-type scale.32 Three decades later, the gap has grown to 125 points. This widening gap is largely due to differences in how well prepared children are for school before they enter kindergarten or even pre-kindergarten.33 In this era of economic inequality, wealthier parents have far more resources, both in terms of time and money, to better prepare their children to succeed in school and later in life.

This widening educational achievement gap may threaten our future economic growth. With only a select few individuals receiving the best education and enrichment, we are not effectively developing the economic potential of our future workforce. To grow our economy we must provide educational and enrichment opportunities for children across the income spectrum, rather than only a select few at the top.

Wealth and income largely define the educational gap today, more so than race and ethnicity. In the 1950s and 1960s, the opposite was true. Back then, racial discrimination in all aspects of life led to deep racial inequality. Economic inequality, in contrast, was lower than at any time in U.S. history, according to extensive research done by economists Thomas Piketty at the Paris School of Economics and Emmanuel Saez at the University of California, Berkeley.34 But anti-discrimination and civil rights legislation and school desegregation led to improved economic, social, and educational conditions for African Americans and other minorities beginning in the late 1960s. As a result, the gap today between white and black children is about 70 points on an 800-point SAT-type scale, 40 percent smaller than it was in the 1970s, and about half the size of the gap between rich and poor children, but still unacceptable.35

The growth of the socioeconomic achievement gap appears to be largely because more affluent parents are increasingly investing more time and money in their kids’ educational enrichment—and at earlier periods in their children’s lives—than hard-pressed low-income and middle class families.36 Indeed, surveys show that the amount of time and money parents invest in their children has grown sharply over the past four decades among both affluent and non-affluent parents. But the increase in these investments has been two to three times greater among high-income families.37 Economists Richard Murnane of Harvard University and Greg Duncan at the University of California-Irvine find that between 1972 and 2006 the amount high-income families spent on their children’s enrichment activities grew by 150 percent, while the amount spent by low-income families grew by 57 percent.38 In part, parents are spending more on their kids because they understand that educational success is increasingly important in today’s uncertain economic times, a point that sociologist Marianne Cooper at the Clayman Institute makes in her recent book “Cut Adrift.”39 But low- and middle-income families can’t match the resources—both the money and flexible time—of the rich.

As a result, rich and poor children score very differently on school readiness tests before they enter kindergarten. Once they are in school, however, the gap grows very little—by less than 10 percent between kindergarten and high school.40 Thus, it appears that the academic gap is widening because rich students are increasingly entering kindergarten much better prepared to succeed in school than low- and middle-class students. To be sure, there are important differences in the quality of schools serving low- and high-income students, but these differences do not appear to be as salient as the differences in children’s experiences prior to kindergarten.

The socioeconomic education gap is likely to affect us for decades to come. Think of it as a leading indicator of disparities in civic engagement, college enrollment, and adult success. Indeed, family income and wealth have become increasingly correlated with a variety of positive adolescent activities, such as sports participation, school leadership, extracurricular activities, and volunteer work, according to research conducted by Harvard University political scientist Robert D. Putnam and his colleagues.41

Not only are the children of the rich doing better in elementary and high school than the children of the poor, they also are cornering the market on the seats in the best colleges. In a study that I conducted with several of my graduate students, we found that 15 percent of high-income students from the 2004 graduating class of high school enrolled in a highly selective college or university compared to only 5 percent of middle-income graduates and 2 percent of low-income graduates.42 Because these colleges provide educational opportunities and access to social networks that often lead to high-paying jobs, children from low-income families risk are being locked out of the upper end of the economic spectrum. For low-income children, the American Dream is further out of reach.

This is bad news for our future economy and society because we need well-educated workers in order to sustainably boost economic productivity and grow the economy. So how can we prepare every child, not just those most affluent ones, to be productive members of society? First of all, we must acknowledge that educational problems cannot be resolved by school alone. The achievement gap begins at an early age. To close it, we must invest in children’s early childhood educational opportunities. This means investing not only in preschool but also in parents. Specifically, we need to:

  • Invest in high-quality early childhood education programs (pre-schools, day care) and make them affordable for all families.
  • Invest in programs that help parents become their children’s first and best teacher.
  • Provide policy solutions to help all parents have the time to be teachers through paid leave, paid sick days, workplace flexibility, and income support programs that ensure that families can focus on their children even in hard economic times.

In short, we can narrow the socioeconomic education gap through public policies that help parents of all incomes provide enriching educational opportunities for their children in the way that only affluent parents can do today.

Economic inequality and growth in the United Kingdom: Insights for the United States

After an extraordinarily long and deep economic downturn, the United Kingdom is finally enjoying belated but comparatively strong growth. The current recovery is jobs-rich, with employment growth massively outperforming expectations relative to gross domestic product. That’s the good news. In stark contrast, however, pay growth remains unprecedentedly weak and productivity has plummeted. Real (inflation-adjusted) wages have fallen for six years straight, with even nominal wages growing at less than 1 percent in recent months—the lowest increase ever recorded.

This apparent collapse in the link between economic growth and real wage gains is more extreme than anything we have seen before. But the trend has not emerged completely out of the blue. Even as the U.K. economy continued to grow steadily prior to the financial crisis and global recession in 2007-2009, workers across the earnings distribution experienced a major slow-down in wage growth.

This unhappy story about the weakening relationship between wages and growth is all too familiar in the United States. But the U.K. experience is different in important respects—and potentially offers some relevant insights for U.S. policymakers to ponder.

First, let’s look at what happened. The simple ratio of GDP growth to growth in median wages in the United Kingdom weakened markedly in the period from 2003-2008 compared to the 1990s and 1980s. In those earlier decades, wage inequality grew sharply—those at the top pulled away from the middle, and the middle pulled away from the bottom—but pay was rising across the board. In contrast, a big deceleration in the growth rate of earnings characterized the early 2000s. For the first time, median pay trailed way behind growth in real GDP per capita.

Between 1977 and 2002, average annual real wage growth for workers at the median was around 2 percent, but from 2003 to 2008 it fell to around 0 percent to 1 percent (depending on the measure of inflation used). This stagnation happened even while real GDP per capita had an average annual growth rate of 1.4 percent. The squeeze was broadly felt: the only earners on the income ladder who experienced stronger growth were those near the bottom rungs (buoyed by increases in the minimum wage) and those at the very top (especially due to bonus payments in finance).

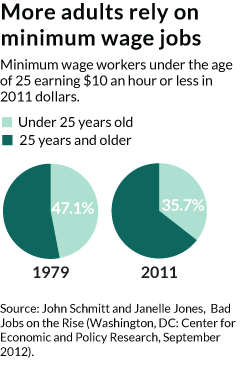
In the wake of the financial crisis of 2008 and amid the Great Recession of 2007-2009, the fall in real wages (around 8 percent) has also been relatively evenly spread across the earnings spectrum, though it is far bigger if we include the self-employed (who are excluded from official data). Younger workers have suffered the most, while older workers have been the least affected.

Wages, however, don’t give the full-picture when it comes to living standards. If we look at household income growth, from 1994-95 to 2011-12, the bottom half of households took just 16 percent of pre-tax growth. Upper-middle households
(those in the 50th to 90th percentiles) took 45 percent of household income pre-tax growth (44 percent post-tax), proportionate to their population share. The richest 10 percent of households took 38 percent of pre-tax growth (29 percent post-tax) while the richest 1 percent took 14 percent pre-tax (9 percent post-tax).

In short, redistribution boosted the bottom half ’s share of income growth from 16 to 26 percent.

Why has the link between economic growth and wages weakened? The share of GDP flowing to the wages of those on the low and middle part of the income spectrum has fallen markedly since the mid-1970s, from 16 percent to just 12 percent—a decline of 25 percent.43 In simple accounting terms, this relationship depends on three factors:

  • How much of GDP growth goes to profit rather than labor?
  • How much of that share of economic growth goes to labor in the form of non-wage benefits and how much actually gets paid out to workers in wages?
  • Of this wage share, how much reaches low- and middle-income earners?

It is often assumed that the United Kingdom and the United States alike face a long-term decline in the labor share of GDP as more of our national incomes are sucked up into corporate profits due to a mix of changing globalisation, technology, increased financialisation and, relatedly, deregulation spurred by the impact of big money on democratic politics.
From the U.K. perspective, there has been a slight shift in this direction over time, though it is an issue that is often overstated. Changes in the U.K.’s labor share of national income accounted for only a fifth of the cleavage that had opened up between pay and productivity since the early 1970s. The decline in the labor share of income has been less marked than in the United States.44

Another U.K. perspective is that workers’ wages have primarily been under pressure because of the rising burdens on employers to provide more non-wage compensation such as higher national insurance and pension contributions. These employment costs have certainly risen, but again they can be overstated, with such increases accounting for a bit over a quarter of the gap between productivity and pay. That said, it is true that the rising cost of non-wage compensation appears to have played a more important role in the period of wage stagnation from 2003 in the United Kingdom.

But by far the most important factor explaining the declining share of the cake going to the bottom half of U.K. workers since the 1970s has been rising wage inequality, although this played a smaller role in the immediate pre-crisis period of 2003 to 2008.

How these three trends are likely to evolve over the next decade and beyond is far from clear. The intellectual zeitgeist expects there to be a redistribution of income over time from labor toward capital due to the “rise of the robot” (technology replac-ing workers) and French economist Thomas Piketty’s now famous observation that “r >g” (returns on capital are greater than the returns on economic growth).

Equally troubling is the outlook for non-wage costs. The tricky balancing act over the past decade of securing adequate pensions savings for an aging society and pro-tecting the wages of today’s workers in the United Kingdom is unlikely to go away. Similarly, most projections anticipate that, following the recent downturn period where wage inequality remained fairly level, it is now likely to increase again as the highest earners pull away from the rest.

Yet the idea that resumed growth is pre-destined to mean ever higher inequality is bogus. It was not long ago, after all, that the United Kingdom experienced broadly shared eco-nomic growth. So what observations can we make based on the U.K.’s experience?

First, standing still takes a lot of effort when the ground is shifting. A rising minimum wage and aggressive use of tax-credits made a significant and positive difference in the United Kingdom, but policymakers were pushing against the grain and didn’t do enough to confront the structural economic challenges such as inadequate business investment, lack of employee bargaining power, and weak demand for skilled labor.

Second, successive waves of “welfare reform,” together with the long-term decline in labor union collective bargaining, appears to have shifted the wage-unemployment relationship since the early 2000s. Wages have become significantly less responsive to falling unemployment than was the case in the 1980s and 1990s.45 At the same time, and despite the gains from the minimum wage, working poverty has become far more pervasive. Arguably, these shifts put even more onus on aggressive monetary and fiscal policy to help generate a tight labour market and wage growth.

Third, the U.K.’s policy on the minimum wage was a success but we shouldn’t rest on our laurels. The Low Pay Commission, the body that oversees the minimum wage, is widely judged to have been highly effective if perhaps too cautious. The wage gap between the bottom and middle of the distribution has fallen (slightly) since its introduction. Fifteen years ago the whole notion of the minimum wage was highly partisan. Now each of the political parties jockey for position on this issue.

The Low Pay Commission’s blend of operational independence, technical expertise, and social partnership (employer and union representation) has worked well. And this flexibility has been an advantage; in the UK context, linking the national mini-mum wage to inflation would be a mistake. But there is now a sense that we need to revise our minimum wage framework to reflect learning over 15 years and to inject more ambition into the process.46

Finally, policy wonks need to think hard about the political economy of tax credits. Most experts think tax credits increased the incentive to work (boosting single-parent employment rates in particular), helped bring about a major fall in child poverty, and shored up the post-tax transfer share of income going to the bottom 50 percent of society. Yet the rapid expansion of the policy (around 8 in 10 families with kids were eligible in 2010) raced ahead of popular support, making it surprisingly easy for the current governing coalition of Conservatives and Liberal Democrats to cut them. Tax credits have been characterised as “welfare” for the work-shy, whereas “tax-relief ” is generally perceived more positively.
So what is the outlook for wage inequality in the United Kingdom? Broad-based economic growth is very unlikely to return by chance. Securing such an outcome will require a number of elements, including:

  • A more aggressive strategy for raising the wage floor during the current period of economic recovery, drawing confidence from growing research about the capacity of buoyant labour markets to absorb steady minimum wage rises
  • Tackling the extraordinary rents that have accrued to small numbers in the finance sec-tor over the past decade as the link between run-away rewards, financial instability, and fiscal retrenchment is all too clear (and is toxic for those on low and modest incomes)
  • Ditching the notion that increasing payroll taxes (on employees and employ-ers) are a politically cute way of raising extra revenue (not least when large and regressive tax-reliefs remain untouched)
  • Boosting the woefully inadequate business and public investment as there is no other path to higher labor productivity
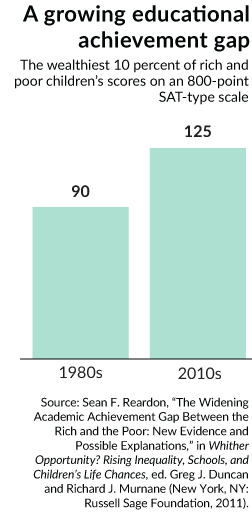
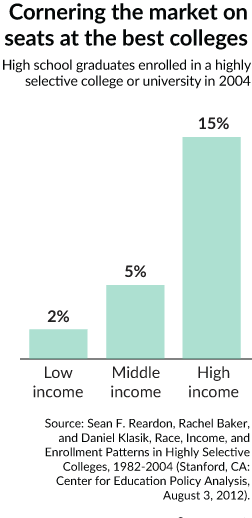
  • Remedying perennial weaknesses in U.K. education policy, especially the awful wage and productivity returns to many low and intermediate level vocational qualifications (respectively, the qualification level that a 16 or 19 year old is expected to attain)

This last point is key. Education may not be the panacea that political leaders claim it to be, but the wage-penalty arising from poor quality sub-degree level vocational qualifications in the United Kingdom is particularly punitive.

More speculatively, there is a desperate need for experimentation with new labor mar-ket institutions that could offer employees some greater form of bargaining power, but in a manner that is compatible with the realities of a relatively flexible, heavily service-dominated economy. This is pretty much a policy void in the United Kingdom today.

Recreating more equitable, broad-based economic growth requires as prerequisites a tighter jobs market together with a higher wage floor. But to restore the link between economic growth and wage growth also will involve bold policy experimentation in pursuit of higher wages for those on the low- and middle-income rungs on the economy in the United Kingdom.

#FF America’s Best, Most Substantive, and Most Accurate Center-Left Polemicist Is… Jonathan Chait: Monday Focus for September 1, 2014

A Baker’s Dozen of recent keepers:

  1. Keystone Fight a Huge Environmentalist Mistake
  2. Why I’m So Mean
  3. Wasting Away in Hooverville
  4. Greg Mankiw Loves One Percent, Doesn’t Know Why
  5. Fear of a Female Fed Chief
  6. Why Is Obama Caving on Taxes?
  7. The Lonely Death of the Republican Health Plan
  8. What Caused The Deficit?
  9. The Morality Of Political Hostage-Taking
  10. Paul Ryan Is Making Things Up Again

And three that require excerpting:

(11) Jonathan Chait: Why Washington Accepts Mass Unemployment: “The recovery looks safe for those of us…

…who are not already screwed. That, sadly, has come to be the primary focus of our economic policy. In the years since the collapse of 2008, the existence of mass unemployment has stopped being something the economic powers that be even pretend to regard as a crisis… viewed… from a perspective of detached complacency….

There are signs we’ve hit bottom. Nothing to worry about here. Why risk the possibility of a small outlay merely to provide relief to hundreds of thousands of desperate people? This is such a perfect statement of the way the American elite has approached the economic crisis. They concede that it is a problem. But there are other problems, you know.

It’s important to respond to arguments on intellectual terms…. Yet it is impossible to understand these positions without putting them in socioeconomic context…. For affluent people, there is essentially no recession…. Unemployment is also unusually low in the Washington, D.C., area….

For millions and millions of Americans, the economic crisis is the worst event of their lives. They have lost jobs, homes, health insurance, opportunities for their children, seen their skills deteriorate, and lost their sense of self-worth. But from the perspective of those in a position to alleviate their suffering, the crisis is merely a sad and distant tragedy.

(12) Jonathan Chait (2013): World’s Wrongest Man Ventures Latest Prediction: “Michael J. Boskin–former George W. Bush economic adviser, Hoover Institute fellow…

…and staunch advocate of conservative anti-tax doctrine appears… to warn that the Democratic president’s economic policies will lead us to misery…. Four years ago, Boskin penned a Journal op-ed whose thesis was captured in the headline, “Obama’s Radicalism Is Killing The Dow”…. His career is a mighty testament to the power of enduring, invincible wrongness. In 1993… Boskin… accused Clinton’s administration of ‘fundamental distrust of free enterprise’… made… predictions:

The new spending programs will grow more than projected, revenue growth will be disappointing, the economy will slow, and the program will reduce the deficit much less than expected.

Boskin repeated his prophecies of doom in a summerlong media blitz… labeled Clinton’s plan ‘clearly contractionary’, insisted the projected revenue would only raise 30 percent as much as forecast by dampening the incentive of the rich, insisted it would ‘take an economy that might have grown at 3 or 4 percent and cause it to grow more slowly’, and insisted anybody who believed in it would ‘Flunk Economics 101’….

Boskin… spotted a brilliant new economic mind in Texas governor George W. Bush:

These people were immensely impressed with him, how quick he was to pick stuff up. His instincts were all very good, very much market-oriented; that created a very, very favorable impression.

Boskin… insist[ed] that George W. Bush’s tax cuts would reduce revenue by far less than the official forecasts predicted…. In addition to being in thrall to a rigid and disproven ideology, Boskin suffers from unbelievably bad timing. Any investors who have actually put real money on the line after listening to him deserve the punishment they’ve received.

(13) Jonathan Chait (2012): Sally Quinn Forced to Dine With Non-Fake Friends: “Pretty much the entire journalistic world…

…has made fun of Sally Quinn’s weekend Washington Post essay declaring the End of Power, further abuse may seem unnecessarily cruel. And yet even the fulsome stream of disparagement… has not adequately conveyed the full…. Her essay broadly belongs to a particular genre that I think of as a cargo cult of bipartisanship focused on dinner parties… she adds her own uniquely mortifying touches. Her mourning of the decline of the Georgetown dinner party sweeps together such disparate trends as the appearance of a Kardashian at the White House Correspondents’ Dinner, Citizens United, hard times at newspapers, and the appearance on the scene of ’25-year-old bloggers’. The result of all these baffling developments is that Quinn now has to have dinner with actual friends….

When assessing Quinn’s sense of the Lost Eden of Washington, we should also have a firmer sense of what the culture was actually like. Here is one scene from Quinn’s inculcation into the Washington elite:

Washington writer Sally Quinn told of a 1950s reception where: ‘My mother and I headed for the buffet table. As we were reaching for the shrimp, both of us jumped and let out a shriek. Senator Strom Thurmond, grinning from ear to ear, had one hand on my behind and the other on my mother’s. As I recall, we were both quite flattered, and thought it terribly funny and wicked of Ol’ Strom’.

Once Washington was a happy place where a girl and her mother could be groped simultaneously in good fun by a white supremacist. Sadly, it has all been ruined by Kim Kardashian and Ezra Klein.