What happened to the job ladder in the 21st century?
The job ladder, Veer.com
A few weeks ago, we published an analysis showing that the lowest-paying industries saw the largest increases in workers with a college degree between 2000 and 2014. Today, we follow that up by showing that the pattern is similar among young workers ages 19 to 34 (as opposed to workers with a college degree), but with one big difference—the oil, gas, and mining resource extraction and refining industries, which pay relatively well, saw a substantial increase in the share of young workers hired.
Considered alongside our previous results, this new analysis implies that resource extraction and refining industries provided an outlet for young workers without college degrees to attain well-paying employment. These industries profited from the development of hydraulic fracturing and other new technologies, as well as a worldwide boom in demand for natural resources that seems to have reversed since late 2014.
Figure 1
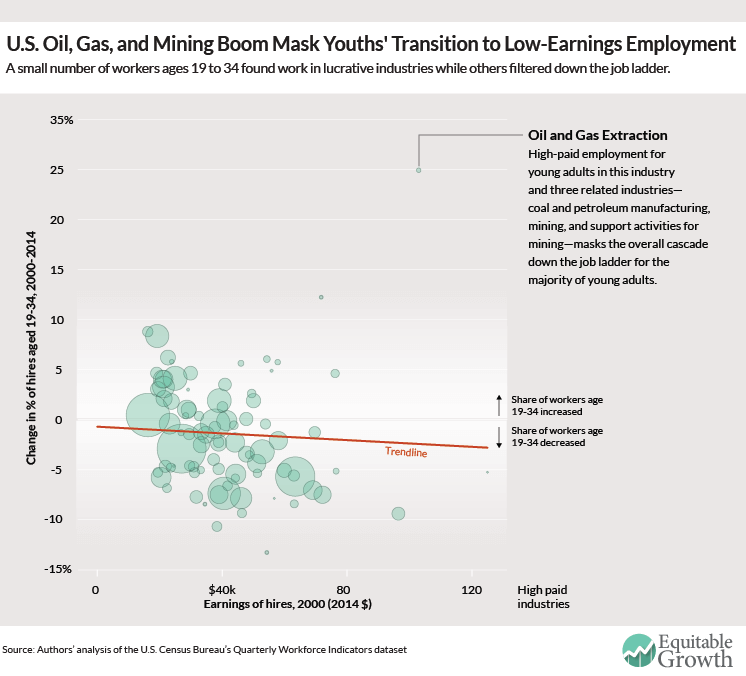
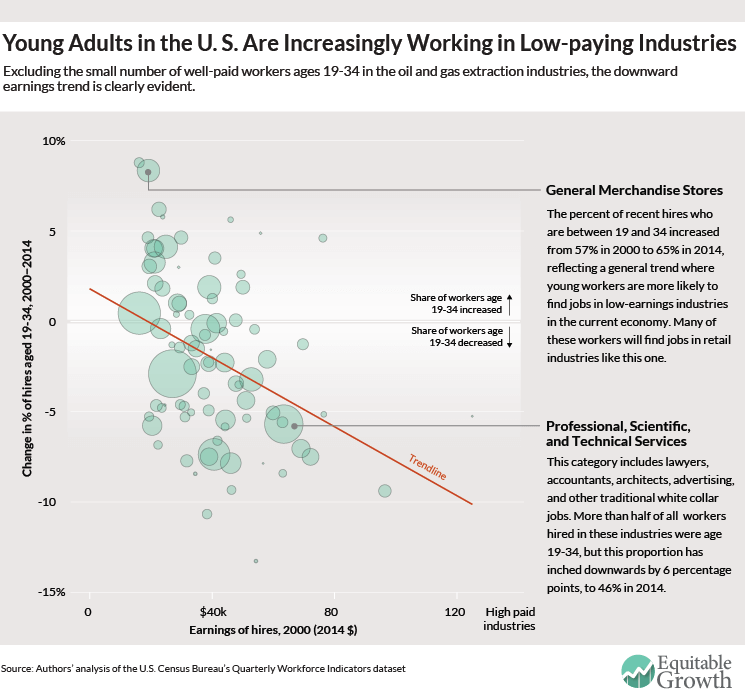
But these young adults working in the high-paid extraction and refining sectors obscures the larger picture of the U.S. job ladder: Outside those industries, young workers are increasingly being hired into low-paying ones. That is important to document because, as we discussed in our previous column, the education level for most workers in the U.S. Census Bureau’s Quarterly Workforce Indicators database is imputed rather than observed directly—and that imputation is potentially faulty since it is based on the 2000 Census. In contrast, the age of workers is observed directly for the vast majority of workers.
Figure 2
Looking at the share of young workers hired in each quarter between 2000 and 2014 yields further insight, which our colleague Kavya Vaghul discussed in part in her column last week on the impact of student debt on economic security. It divides industries into thirds based on their average earnings in 2000, then traces the share of hires in each industry that went to young workers. The share of young workers hired in high-paying industries shrank right at the onset of the Great Recession, while in its aftermath that share grew in low-paying ones. (See Figure 3.)
Figure 3
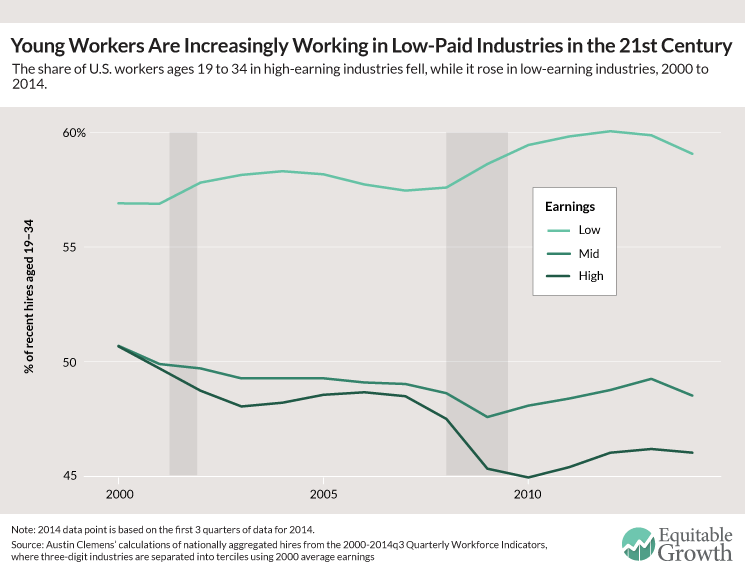
These findings are consistent with previous findings on the evolution of the job ladder during and after the Great Recession of 2007-2009, though our analysis indicates that the job ladder had already started deteriorating even before that, following the recession of the early 2000s.
The labor market has always been characterized by what economists call a “last in/first out” or “last hired/first fired” structure, meaning that workers who are laid off during recessions are generally those with the shortest job tenure, many of whom tend to be young. We also know that high-paying firms exhibited the greatest decline in hiring during the Great Recession. In combination, these two patterns imply that young adult workers disproportionately lost out at high-paying firms and industries, which is what the darkest green line in Figure 3 shows.
Following the Great Recession, employment grew most in low-wage jobs, so that is where young adults entering the workforce could find work—even if they had a college education. And because the high-wage firms and industries aren’t hiring, many of these workers are stuck in low-wage jobs. That failure of the job ladder portends dire consequences for young workers’ lifetime earnings since the peak years for job-switching and wage growth are the early ones. If these workers do not find opportunities to climb, then they will potentially be stuck on the lower income rungs for the rest of their lives.
Appendix
The construction of the U.S. Census Bureau’s Quarterly Workforce Indicators, the data from which these charts are constructed, is discussed in the appendix to our previous column. To make these charts on young adult workers’ share of hires, we define “young adult workers” as QWI age groups 2, 3, and 4 (comprised of workers ages 19 to 34), and we exclude groups 1 (ages 14 to 18) and 8 (ages 65 to 99) from the analysis entirely. Industry average earnings of full-quarter hires in 2000, or EarnHiraS, are deflated to 2014 dollars using the U.S. Consumer Price Index for all Urban Consumer, or CPI-U. When industries are divided into thirds according to earnings levels in Figure 3, the three groups are weighted by employment so that each group corresponds to approximately one third of the total U.S. workforce.
The observations excluded between Figures 1 and 2 are the North American Industrial Classification System (three-digit) industries 211 (Oil and Gas Extraction), 212 (Mining except Oil and Gas), 213 (Support Activities for Mining), and 324 (Petroleum and Coal Products Manufacturing, including Oil Refineries).