The cruel game of musical chairs in the U.S. labor market
Musical chairs by Paolo, flickr, cc
Last year, our colleague Elisabeth Jacobs referred to the fate of young people in today’s slack labor market as “a cruel game of musical chairs” because there aren’t enough jobs to employ everyone at their full earning potential. Workers with college degrees tend to win out in the competition for the few jobs that are available, but many must settle for lower-paying jobs than similarly credentialed workers entering the workforce in previous decades. Those without college degrees, in turn, are driven into even lower paying work or pushed out of the labor market entirely. Economists refer to this phenomenon as “filtering-down,” with the best-educated workers increasingly filling jobs lower and lower on the job ladder.
The dire experience of these workers with college degrees displacing workers with less formal education stands in strong contrast to the widely–held view in economic and policymaking circles that the main problem facing the U.S. economy is a shortage of highly-educated workers. If college-educated workers were in short supply, then we would expect their wages to rise as employers attempted to lure them away from their competitors. Yet the inflation-adjusted value of the wages of college-educated workers has barely increased in the 21st century.
What’s more, between 2000 and 2014 (the last year for which complete data are available), the employment of college-educated workers has increased much more rapidly in low-earning industries than in high-earnings ones. If there weren’t enough college graduates to go around, then the opposite should be happening because high-earnings industries would presumably be outcompeting low-earnings industries to hire college-educated workers. Our new analysis of the data from the U.S. Census Bureau’s Quarterly Workforce Indicators strongly suggests that college-educated workers are more likely to “filter down” the job ladder than to climb it.
The QWI dataset is a comprehensive administrative source for information on flows in and out of employment, collecting information on total employment, hires, “separations” (workers either quitting their jobs, getting laid off, or fired for cause), and earnings. The data are disaggregated along many dimensions, including workers’ education level and the industries where they work. We can, for example, look at the share of employees in restaurants and bars that have a Bachelor’s degree or more, or the share of workers on Wall Street who have less than a high school degree.
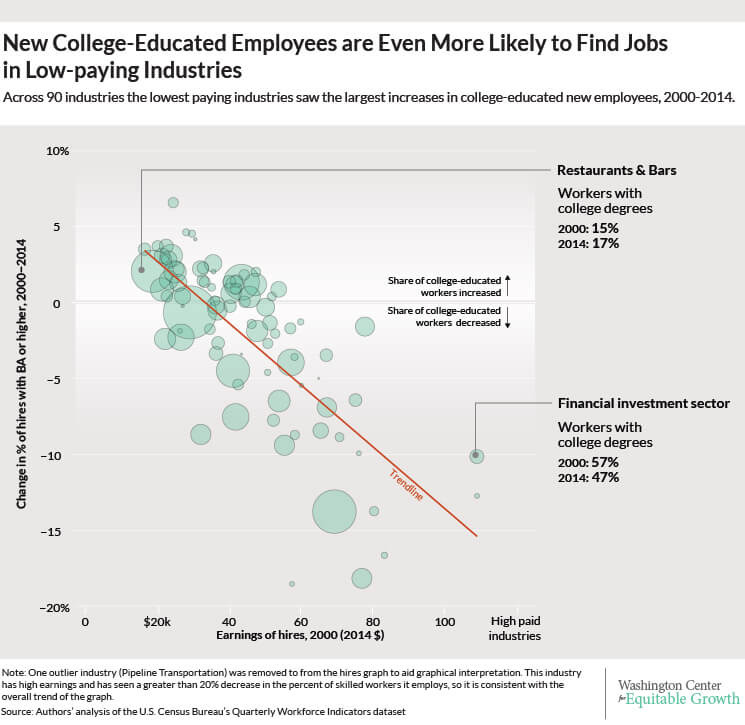
Our analysis examines the average earnings of workers in the 91 industry groups—identified by their 3-digit coding in the North American Industrial Classification System–which together account for nearly all employment in the United States, alongside the share of workers in each industry with a college degree or more. While not definitive, the most striking finding is that the industries with the lowest earnings for all employees are experiencing the largest increases in the share of workers with a college education or higher. Our analysis, for example, finds that 16.3 percent of all workers who work in restaurants and bars in the United States have attained a Bachelor’s degree or more, compared to 14.2 percent in 2000. In contrast, high-paying industries such as the financial sector saw their share of college-educated workers decrease, from 65.2 percent in 2000 to 56.1 percent in 2014 (See Figure 1).
Figure 1

This “filtering down” trend in the employment of college-educated workers is even more acute when we look at recent hires rather than overall employment. The trend line over 2000-2014 is even more steeply downward sloping for hires than for all employees, highlighting the cruel game of musical chairs. In short, a college degree is becoming increasingly less predictive of employment in a high-earnings industry. (See Figure 2.)
Figure 2
If instead of plotting the change in employment of college-educated workers or the change in recent hires of college-educated workers on the vertical axis—as we have done in Figures 1 and 2—we had alternatively plotted the share of college-educated workers in total employment, or the share of college-educated workers in recent hires, then we would see that industries with higher average earnings tend to employ more credentialed workers. In other words, the trend line we would see in the alternative charts would slope up, not down. Findings of that kind, which depict the higher average earnings of college-educated workers, are typically trumpeted as evidence that the only thing preventing young, under-employed workers from finding a good job is their lack of a Bachelor’s degree. But what our analysis demonstrates is that this relationship has gotten less positive since 2000. (See the data appendix below for a complete description of the data and our methodology.)
This means that the changing share of workers with a college degree or more across industries is unlikely to be due to “skill-biased technical change” in low-earnings industries, since by and large workers in those industries are less prone to technological substitution. Think bartenders and busboys. Those workers perform what economists call “non-routine, manual” tasks that can’t easily be performed by pre-programmable machines. Nor does the rise in the share of college-educated workers in lower-paying industries merely reflect that there were fewer such workers in these industries prior to 2000, because the same trend is true among recent hires as among employees overall.
Finally, the increased hiring of workers with college degrees has not boosted the relative pay in those low-paying industries. The patterns are quite similar whether we calculate industry average earnings in 2000 or in 2014 because average earnings across industries haven’t changed very much. What’s changed is the education mix of workers.
The implication of all of these findings is that the U.S. labor market doesn’t lack for college-educated workers. Workers who have degrees are already taking jobs further and further down the job ladder. Encouraging or subsidizing higher education attainment will not solve the fundamental problem facing workers in the current job market: There are not enough jobs.
Data appendix
The U.S. Census Bureau’s Quarterly Workforce Indicators is a comprehensive administrative dataset of employment “matches,” meaning labor market relationships between employers and employees. The existence of a match (employment), the beginning of a match (hires), and the end of a match (separations) are observed in a given quarter, along with average earnings of workers in each group of hired workers, employed workers, and separated workers. The QWI is disaggregated by geography, industry, and many demographic characteristics, including, for our purposes, education attainment (discussed more completely below).
There are two predominant underlying sources of the QWI data: U.S. Census data and state unemployment insurance filings by businesses. QWI is the publically available version of a dataset called Longitudinal Employer-Household Dynamics, or LEHD, which follows individual workers from job to job over the course of their careers. QWI, however, does not track individual workers over time. Instead, quarter-by-quarter, it counts up all the flows described in the previous paragraph, for each detailed sub-population and employer category.
Because state-provided data from the unemployment-insurance system are critical to constructing LEHD and hence the QWI, and because states only began to participate in the LEHD at different points in time, the data are available as an unbalanced geographic panel. Every state except Massachusetts is currently providing data to the program, but the start dates vary by state. Enough states have joined by about 2000 that the literature has labeled QWI nationally representative from that point forward, which covers all the data reported in this exercise. We aggregate the data across states to create our industry-education disaggregation.
LEHD does not actually observe the education levels of most workers. For those it does not observe, education is imputed from other worker characteristics using Census Bureau microdata (mostly from the 2000 Decennial Census). That is the most likely reason why the QWI-reported share of college-educated workers has decreased by slightly more than one percentage point overall, and by substantially more in some industries. The imputation procedure works best around the date when its source data was collected (2000), and increasingly less well as we get further away from that date. The Current Population Survey, a representative sample of the population collected continuously, reports that the overall share of college-educated workers in the economy increased by approximately five percentage points between 2003 and 2012, and has only declined by a small amount in a very few industries.
The education imputation in QWI complicates the inference from exercises such as the one we present here, because the whole point of our interpretation is that educational attainment has become less predictive of workers’ experience in the labor market, and in particular, of their earnings, as better-educated workers are forced to take worse jobs. The effect of the data imputation, however, is most likely to mute the phenomena we highlight: if credentialed workers are taking jobs further down the labor market hierarchy, then workers who take jobs further down the hierarchy than they did in the past would be more likely to be misidentified as lacking educational qualifications. For that reason, we believe the imputation of education data means that our results understate the effect of filtering-down.
Tentative confirmation for this can be found in a regression of the change in the share of young workers on industry average earnings, which yields an even-more-sharply negative slope than Figures 1 and 2. In other words, young workers are filtering down the labor market even more starkly than BA-educated ones, according to QWI. Since young workers are more likely to have college degrees than retirees, the education-based regressions we present here probably understate the cruelty of the cruel game of musical chairs.
In order to construct Figures 1 and 2, we use a NAICS 3-digit Industrial Sector disaggregation of the QWI’s 2015Q3 Sex by Education files with all firm size and age categories for all available states and the District of Columbia. The data are smoothed using a four-quarter moving average, and nominal earnings are adjusted for inflation (to 2014 dollars) using the Consumer Price Index for all Urban Consumers, or CPI-U. We use the “stable jobs” concept, meaning only “full-quarter employment” is counted. A worker is “full-quarter employed” at a given match if and only if that worker has positive earnings from that match in the quarter itself and (at least) the ones preceding and subsequent. (Similarly, a “full-quarter hire” is one in which positive earnings are observed in the preceding, current, and subsequent quarters but not two-quarters-ago.)
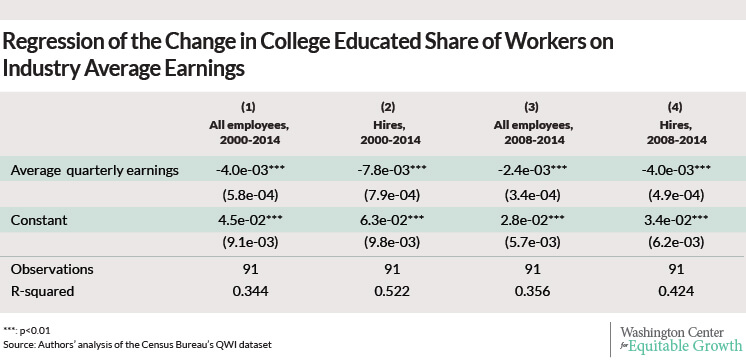
The dependent variables in the regression are calculated from either EmpS or HiraS (for employment and hires respectively), and the dependent variables are correspondingly EarnS or EarnHiraS. We use the education category corresponding to a “BA or more” to calculate college-educated shares of employment and hires, and we exclude workers aged 24 or under since QWI does not report education attainment for that age group. (See Figure 3.)
Figure 3
The raw data and the Python script we used to clean and reshape the raw data are available at Equitable Growth’s GitHub.