
The costs of the Trump administration’s tariffs diverge for countries and industries so far in 2026

Key takeaways:
- Tariff rates have dropped and import values have risen since the U.S. Supreme Court ruled in late February 2026 that the Trump administration did not have tariff authority under the International Emergency Economic Powers Act. The national average tariff rate dropped from nearly 10 percent in January, the last full pre-ruling month, to roughly 6.7 percent, while imports shot up more than 15 percent.
- Trade with China is a notable exception. Import values continued to decline, despite the tariff relief, and are down nearly 7 percent since February.
- On average, all domestic U.S. sectors experienced tariff relief following the Supreme Court ruling, but some specific industries mostly facing non-IEEPA tariffs—primary and fabricated metals, for example—saw little change in the taxes imposed on their imported content due to a different set of tariffs. Estimated tariff costs for primary metal manufacturing reached nearly 4.2 percent of that industry’s inputs in April 2026, higher than the peak estimated in January.
- Transshipment of goods from China via third countries could be on the rise, as rising imports—particularly from Vietnam and Thailand, as well as India, Mexico, Malaysia, Indonesia, Philippines, and Singapore—offset declining trade with China. Crackdowns on this suspected tariff fraud could complicate efforts by U.S. importers to mitigate costs.
- What this means for growth: Trade policy uncertainty, particularly around the prospect of new Section 301 tariffs under the Trade Act of 1974, means many U.S. firms are continuing to adopt a wait-and-see approach, holding off on the investment and hiring decisions that drive economic growth.
Overview
The first 4 months of 2026 saw continued seismic changes in U.S. trade policy. In late February, the U.S. Supreme Court struck down the Trump administration’s use of the International Emergency Economic Powers Act to impose broad, country-specific tariffs under the guise of a national economic emergency, triggering a process requiring the federal government to refund to U.S. importers as much as $175 billion. The administration responded by declaring a blanket 10 percent tariff under a different legal authority, Section 232 of the Trade Expansion Act of 1962, and by launching dozens of new investigations into alleged unfair trading practices by U.S. trading partners under Section 301 of the Trade Act of 1974, with promises of new sectoral tariffs. Also beginning in late February, the war with Iran has added to general economic uncertainty and compounded tariff costs as shipping and energy costs have risen.
As a result of all this broad uncertainty, U.S. firms face increasing constraints that are likely to slow growth-driving investments and hiring. While the U.S. labor market has been surprisingly resilient in response to these developments thus far, persistently above-target inflation means the Federal Reserve could be forced to raise interest rates at some point this year or in 2027, imposing a further drag on the capital investments that drive job and productivity growth.
Let’s now turn to a discussion of how the Trump administration’s tariff and trade policies have changed in the aftermath of the U.S. Supreme Court decision to overrule the Trump administration’s tariff authority under the International Emergency Economic Powers Act.
U.S. tariff rates are down and trade is up with nearly all countries
The U.S. Supreme Court’s IEEPA ruling resulted in two predictable, related outcomes. Data show the average tariff rate paid on imports to the United States fell, while the total value of imports increased.
Since January 2026, the last full month prior to the ruling, nearly every major U.S. trading partner has seen their average tariff rate fall—considerably, in some cases. India’s tariff rate, for example, dropped more than 13 percentage points to 7.4 percent after the Supreme Court ruling. Still, the average tariff on all U.S. imports remains nearly 4.4 percentage points above its pre-2025 level.
As tariff rates fell, U.S. demand for imported goods increased. Since January, U.S. importers have increased purchases from all but three major trading partners, pushing total U.S. imports up by more than 15 percent, to a little more than $300 billion in April 2026—the highest level since the April 2025 “Liberation Day” tariff announcement. (See Figure 1.)
Figure 1
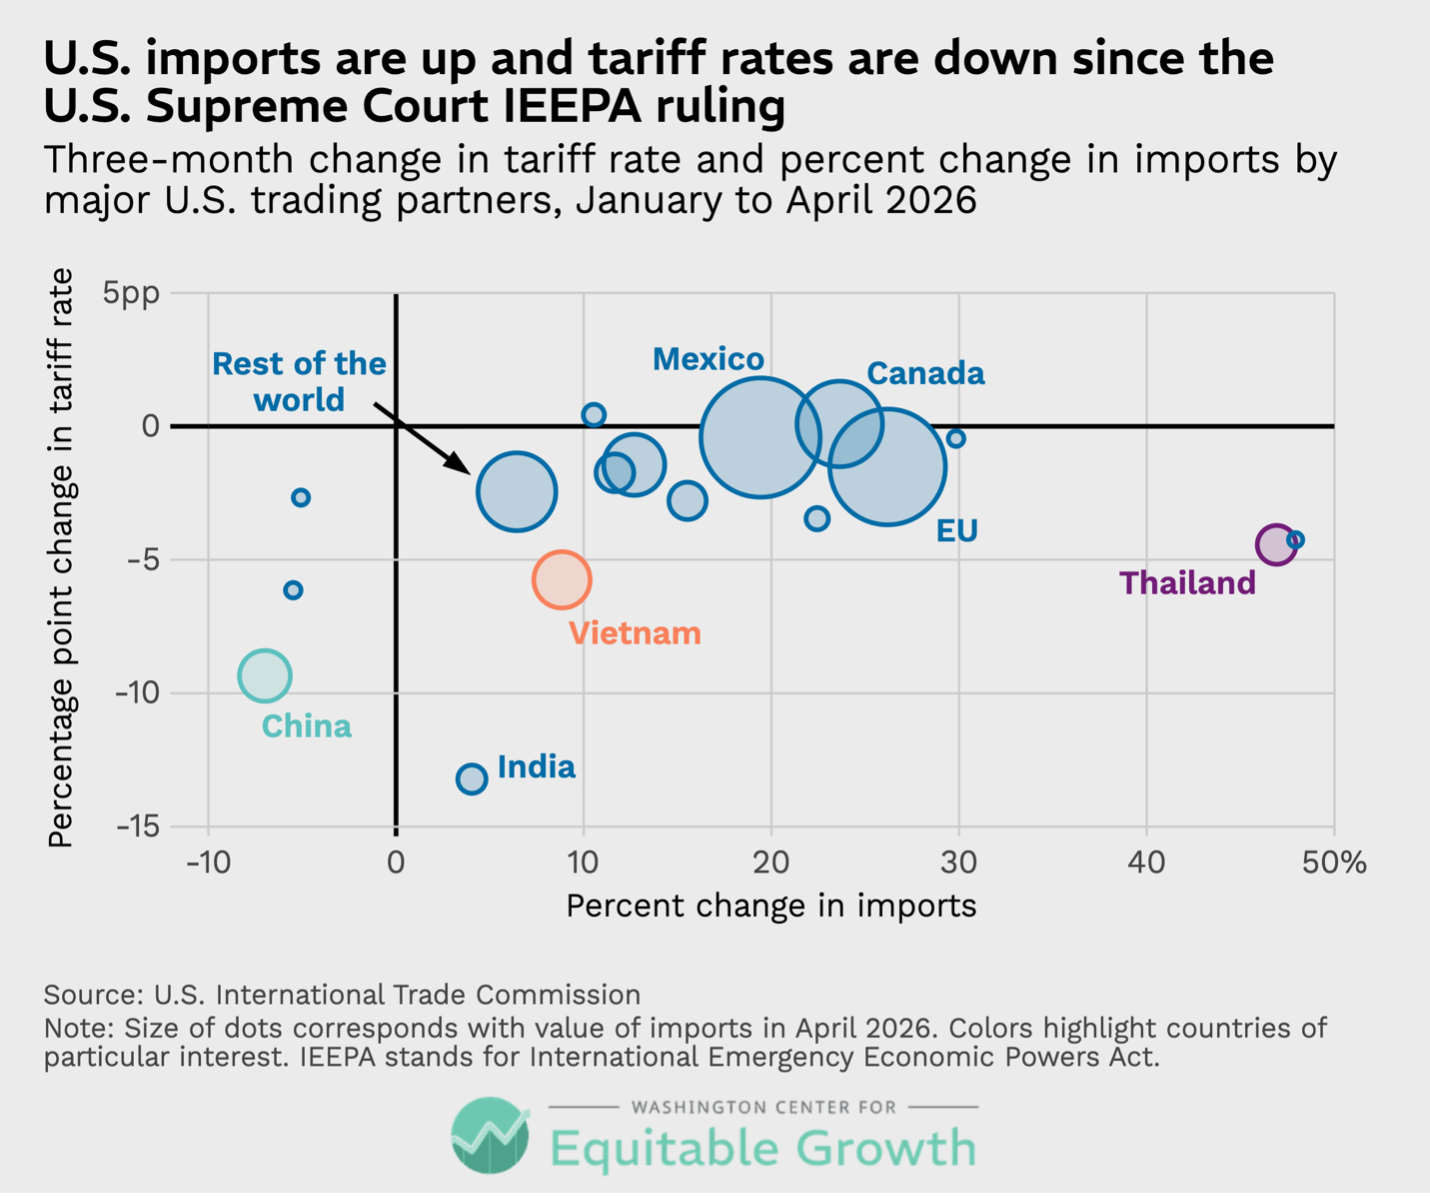
As Figure 1 shows, import growth was particularly high for Thailand, one of a few countries bucking the tariff trend and increasing trade with the United States since last year. Meanwhile, China was the major exception to the rule in the first 4 months of 2026, as its average tariff rate declined by 9.3 percentage points but total import values also fell. The large decline in China’s average tariff rate belied a still-large average rate of nearly 23 percent in April 2026, sustaining incentives for U.S. importers to seek production sources in other countries for economic reasons and to hedge geopolitical supply chain risks.
The continued decline in imports from China also could be attributed to export controls set by China on critical minerals and devices shipped to the United States. These products include high-performance magnets and the technologies used to produce them.
In the near term, Sino-American geopolitical and trading relations are likely to move forward under conditions of managed instability. U.S. businesses tapping global supply chains will need to learn to live with that instability and strike a geographic balance relevant to their core business interests.
Underscoring this point, much ink has been spilled on the question of transshipments, or when goods are routed through a third country, sometimes to avoid import restrictions on the country of origin. Global supply chains routinely (and legally) involve the movement of partially completed goods from one country to another for modifications or packaging before arriving at a destination market. Determining an imported product’s country of origin for customs purposes involves wrangling over whether a “substantial transformation” occurred in an intermediary country. Illicit transshipment is punishable under U.S. law, and a July 2025 Executive Order announced a new 40 percent punitive tariff intended to crack down on the practice.
Yet evasive transshipment isn’t new. In the 1990s, for example, U.S. quotas on imported textiles were evaded when Chinese exports were re-routed through Hong Kong. In the more recent U.S.-China trade war in 2018, researchers identified countries, including Vietnam and Mexico, as possible routes for transshipment of goods from China, with import values from both countries increasing substantially as tariffs on China rose. Over the past year, other Southeast Asian countries, including Thailand, have been suspected of engaging in transshipment. (See Figure 2.)
Figure 2
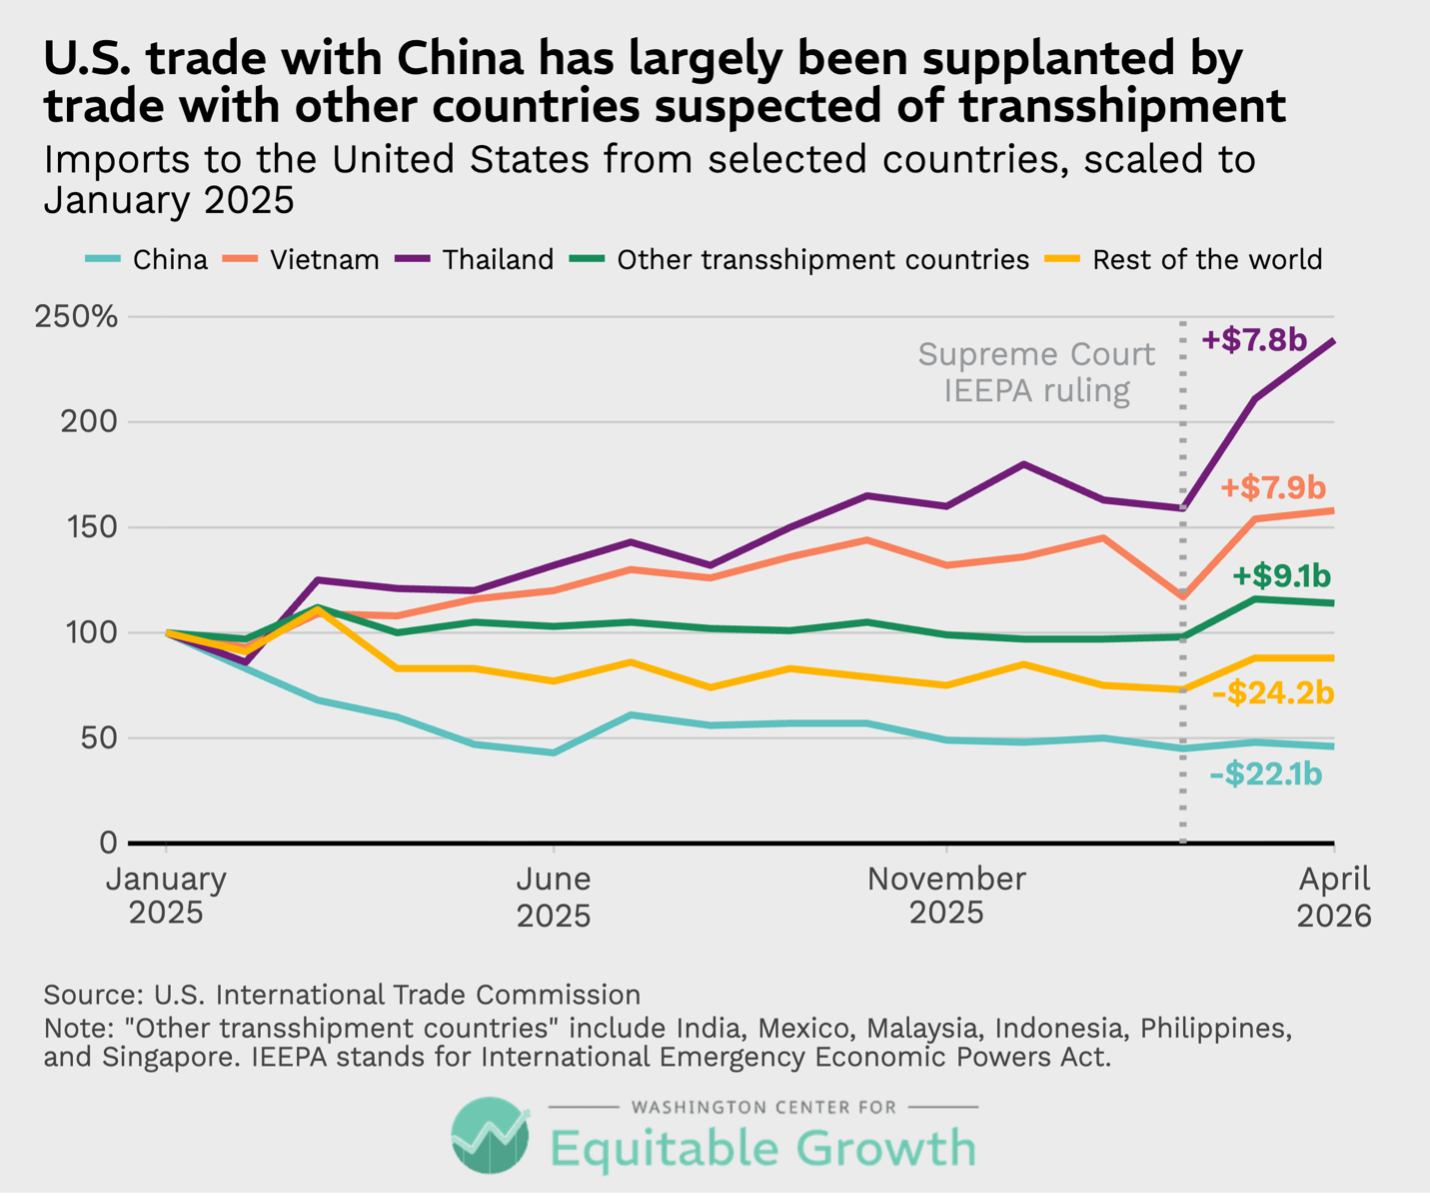
Concretely proving transshipment is difficult, but examining aggregate trade data can reveal broad trends that hint at transshipment. Figure 2 shows that the decline in trade with China since January 2025, for example, has been more than offset by an increase in trade with countries suspected of transshipment, primarily Vietnam and Thailand.
To be sure, at least some of the increase in trade with these potential transshipment countries is legitimate—they, on average, present a more reliable and lower-cost option for many U.S. importers compared to China. But the overall trend is impossible to ignore, and Southeast Asian and other potential transshipment countries could expect additional scrutiny from the U.S. government in the coming months.
Tariff relief after the Supreme Court IEEPA ruling is uneven across U.S. industries
Previous analyses from Equitable Growth estimated the impact of tariffs on U.S. domestic industries, finding that key sectors impacting both economic growth and affordability in the United States face disproportionately higher input costs due to the increase in tariffs since January 2025. Data from the first 4 months of 2026 show continued divergence between tariff-impacted sectors and the rest of the economy.
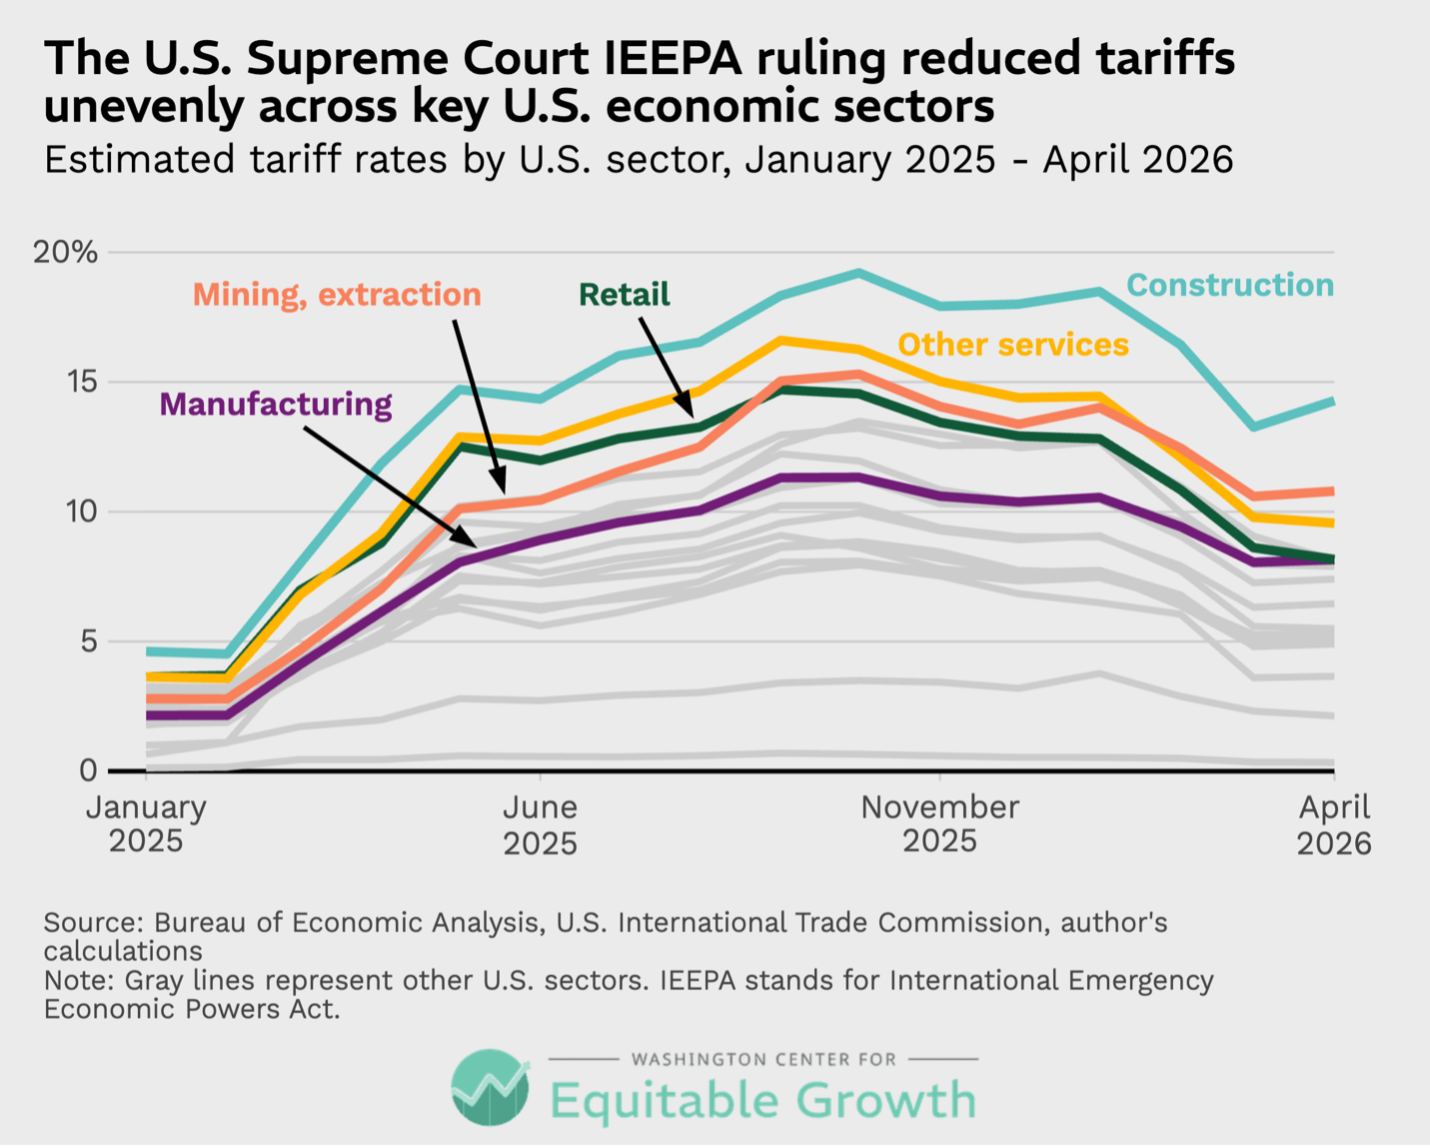
While estimated sector-level tariff rates declined following the Supreme Court’s IEEPA decision, some areas of the U.S. economy probably benefited more than others from lower tariffs. Estimated average tariff rates paid by the domestic manufacturing sector, for example, have declined since January 2026 but not as rapidly as tariffs paid by the retail sector. Retail importers had been paying a higher estimated tariff rate than manufacturing importers throughout 2025, but these rates began converging in 2026 and were effectively equal in April. Other sectors—notably, construction and mining—even saw estimated tariff rates increase from March to April 2026, as the average national rate began to plateau. (See Figure 3.)
Figure 3
Decomposing the manufacturing sector into its constituent subsectors reveals important nuance in the varied effects of how the Supreme Court IEEPA decision impacted different industries. Throughout much of 2025, tariff costs were highest for heavy manufacturing firms, including those in the machinery, metals, and transportation equipment subsectors. Estimated rates within the group of the most impacted manufacturing industries began to diverge following the Supreme Court ruling in February 2026, with tariff rates for machinery, transportation equipment, and other groups declining as rates for primary and fabricated metals remained elevated. (See Figure 4.)
Figure 4
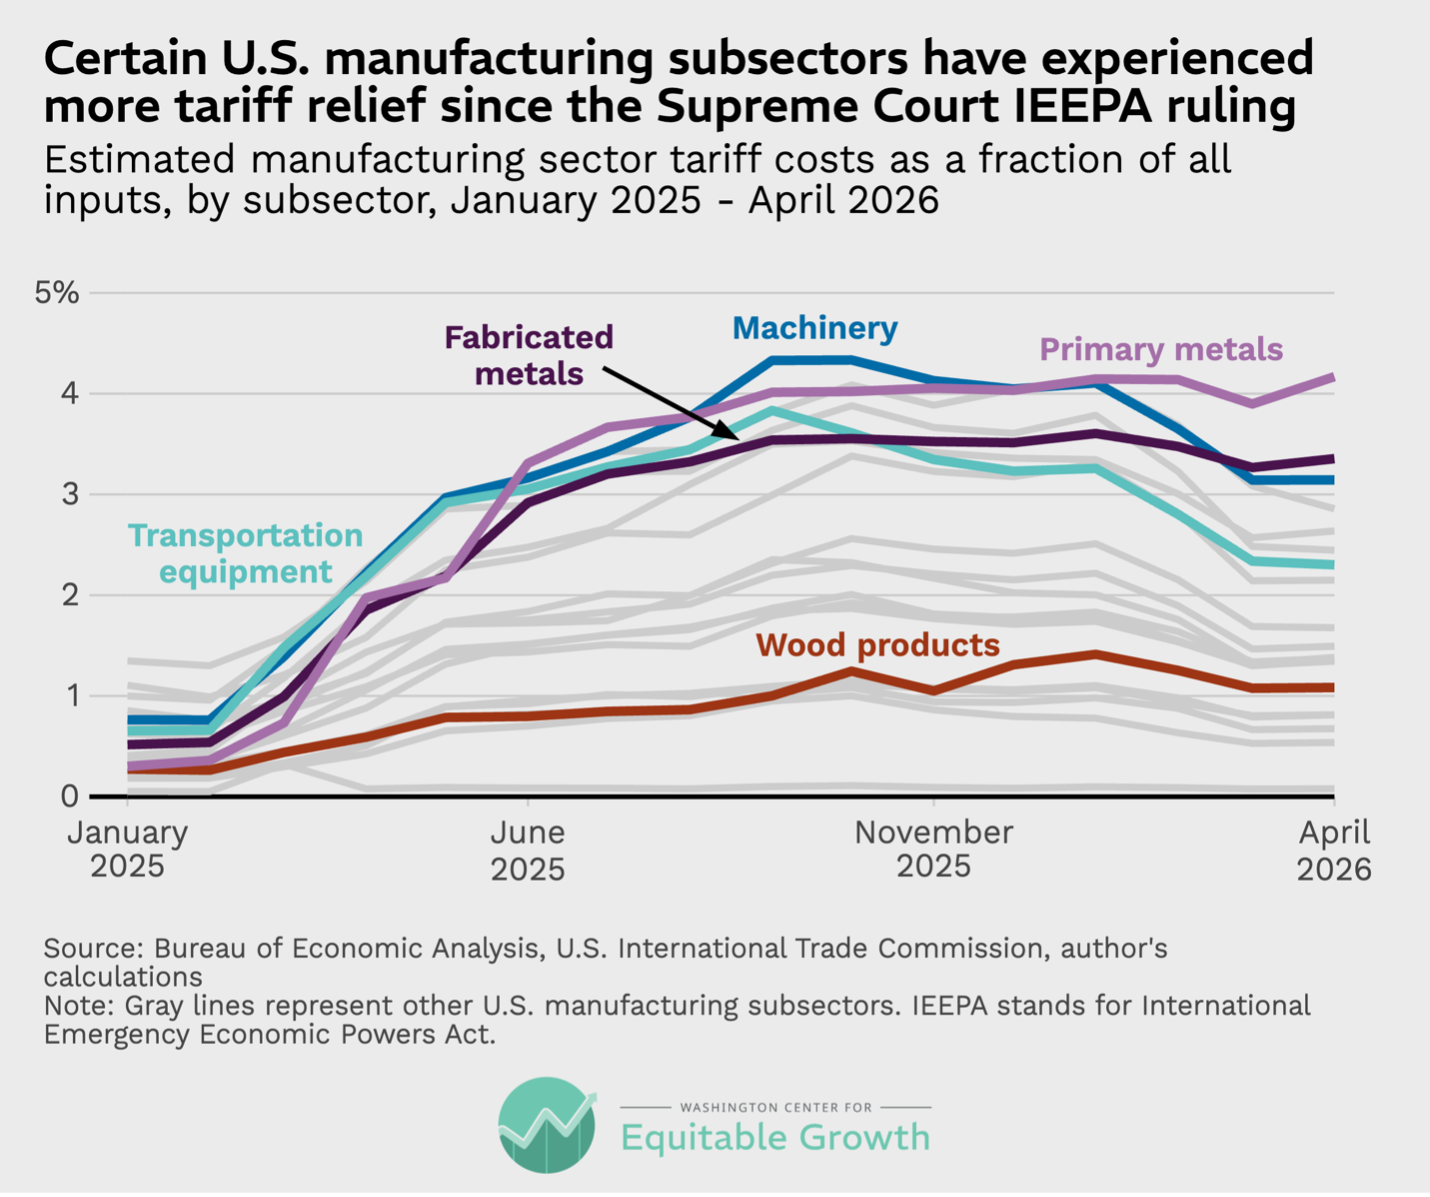
This divergence in tariff exposure across industries can be attributed to the broader array of import measures and trade restrictions applied to primary and fabricated metals, compared to other products. When the Supreme Court struck down President Trump’s IEEPA tariff authority, U.S. sectors burdened primarily by those country-specific tariffs experienced immediate relief, while sectors facing tariffs imposed under different authority, such as Section 232 of the Trade Expansion Act of 1962, did not.
The metals manufacturing subsectors—some of which import a majority of their raw metal inputs—face non-IEEPA-based tariffs mostly on imports of steel, aluminum, copper, and other materials. Wood product manufacturers also saw only minor relief following the IEEPA ruling because the bulk of that industry’s imports fall under Section 232 authority.
This suggests the Trump administration’s strategy of using non-IEEPA alternative legal authorities to impose tariffs could bear fruit. Indeed, in early June, the office of the U.S. Trade Representative recommended additional Section 301 tariffs of at least 10 percent on a group of 60 countries.
Looking ahead
U.S. trade policy is likely to continue to burden the U.S. economy through direct costs in the form of tariffed inputs and other restrictions, as well as through heightened uncertainty as the administration seeks new tariff authorities. The U.S. legal system will have its hands full overseeing the distribution of tariff refunds from the defunct IEEPA authority at the same time that it fields challenges to new tariff authorities. Lengthy and contentious court disputes are sure to compound the effects of policy uncertainty, forcing firms to hold off on growth-driving investment and hiring decisions.
Rising tariff costs and policy uncertainty also create incentives for U.S. importers and trading partners to evade tariffs, despite a push by the federal government to crack down on suspected “tariff fraud” that could complicate those efforts.
Altogether, elevated input costs and policy uncertainty could push U.S. firms to reshore or build out their domestic supply chains and reinvest in U.S. workers. But such a reorientation requires the resources and compliance expertise available only to some well-positioned firms, as well as significant industrial policy investments by the federal government. Time will tell which firms survive and which fall victim to a volatile trade war. Early evidence suggests small businesses—a key source of economic dynamism and employment growth in the United States—will suffer the most.
Did you find this content informative and engaging?
Get updates and stay in tune with U.S. economic inequality and growth!




Stay updated on our latest research