Overview
Competition policy in the United States has become a major public policy issue for the first time in decades. In industry after industry—the internet, agriculture, airlines, and employment markets, among others—questions are being raised about how vibrant competition is and, if not, what are the causes. The Washington Center for Equitable Growth has documented much of the academic research on these issues.1
Discussion about the current U.S. antitrust enforcement regime has been less systematic. Critics have pointed to where they believe federal enforcers have dropped the ball, such as the failure to challenge specific merger transactions or to attack the business practices of certain technology platforms. Defenders of the two federal agencies in charge of enforcement—the U.S. Department of Justice’s Antitrust Division and the Federal Trade Commission—have pointed to the areas where the agencies have been aggressive (such as the Department of Justice’s case against American Express Co.) or tenacious (such as the FTC’s enforcement agenda against hospital mergers).
Antitrust enforcement is also often treated as a single entity, but multiple forces affect both the intensity and effectiveness of enforcement: enforcement activity (the number and type of cases that enforcers bring), the resources Congress provides for antitrust enforcement, and, in the federal system, the merger filing-fee system that has become the primary source of antitrust funding. These are not the only factors that affect antitrust enforcement. In the United States, judicial interpretations define the scope of the antitrust laws. The individuals running the antitrust agencies have broad discretion to determine which cases to pursue.
State attorneys general also play an important and growing role in antitrust enforcement. Witness the recent announcement of a wide-ranging probe into the alleged anticompetitive practices of the big online tech firms, Alphabet Inc.’s Google search unit and Facebook Inc. Similarly, private antitrust litigation is also a critical part of antitrust enforcement.2
Understanding the basic patterns of federal enforcement, however, offers a window into core antitrust enforcement and provides a measure for weighing and questioning the relative impact of the contributing factors to the success or failure of antitrust law today. This report focuses on federal enforcement in terms of activity, resources (appropriations), and merger fees. Descriptive statistics, however, do not establish causation, and this report takes no position on the causes of the various trends that appear in the data. Such trends do, however, raise potential issues for further exploration, particularly for Congress in its oversight role. The numbers offer a partial roadmap for the next set of questions, challenges, and research to tackle in the midst of overwhelming current interest in the state of antitrust. This report specifically examines the following:
- Antitrust enforcement activity. Across all areas of antitrust enforcement, questions arise about trends in antitrust enforcement activity. By multiple measures, criminal enforcement has fallen and shifted away from corporate liability. In merger enforcement, actions have historically been correlated with the number of merger filings. Since 2010, however, merger filings have increased by almost 80 percent, while merger enforcement actions have been flat. And civil nonmerger cases are a small part of antitrust enforcement. The meanings of these trends and their causes are important questions for Congress to consider.
- Antitrust resources. Appropriations for antitrust enforcement have been falling in real terms since 2010 and are, by historical measures, low. Understanding these trends, whether to adjust them, and who should receive them deserve consideration.
- Merger filing-fee structure. Particularly as a result of sequestration, merger filing fees provide the bulk of funding for the agencies. The fee structure has not been modified since 2000. As a result, and unintentionally, midsize deals provide a disproportionate amount of the funding, but large deals (more than $5 billion) trigger a disproportionate percentage of antitrust investigation. Readjusting the merger filing-fee structure is worth consideration.
Each section of this report begins with a brief description of the category, an explanation of the statistics, and finishes with a section on the implication of those statistics and the potential questions they raise.
Antitrust enforcement activity

Antitrust enforcement actions fall into three broad categories. Criminal enforcement, which the U.S. Department of Justice’s Antitrust Division has exclusive authority to prosecute, can result in fines and incarceration. Merger enforcement, which falls under the authority of both the Antitrust Division and the Federal Trade Commission, involves challenges to full or partial acquisitions. Because the United States requires companies to give the government notice of transactions meeting certain thresholds, merger enforcement challenges typically occur before the deal is consummated.
Civil nonmerger cases, which, like mergers, both agencies can bring, encompasses any nonmerger case in which the government challenges past or ongoing conduct, such as the government’s monopolization case against Microsoft Corp. in the 1990s. In these cases, the government is seeking only civil remedies such as an order to stop or change a business practice, to obtain restitution for harmed consumers, or to deprive a company of illegal profits.
Criminal enforcement
By statute, any violation of Section 1 of the Sherman Antitrust Act of 1890, which prohibits unreasonable restraints of trade, Section 2 of the Sherman Act, which prohibits monopolization, and of the Robinson-Patman Act of 1936, which prohibits certain types of price discrimination, can be prosecuted criminally. But the federal government, in practice, reserves criminal cases for hard-core price fixing, market allocation, and bid rigging (think of secret agreements made in smoke-filled rooms).
Criminal antitrust enforcement is the primary tool to prevent the formation of, and halt the operation of, cartels. Even after more than a century of enforcement, the Antitrust Division has uncovered cartels in industries selling computer memory chips, managing airline cargo, and building computer display screens. Currently, the Antitrust Division is investigating whether generic drug manufacturers have fixed prices.
A critical tool for criminal antitrust enforcement is the Antitrust Division’s leniency program. Although started in 1978, the leniency program became integral to criminal enforcement only after a revision to the program in 1993. 3 Under certain conditions, a member of a cartel can avoid criminal prosecution by being the first cartel member to voluntary disclose the cartel’s existence and cooperate with the federal government. In 2004, Congress passed the Antitrust Criminal Penalty Enhancement Reform Act, which enables a court to limit damages an individual covered by a leniency agreement faces in a private antitrust case. The Antitrust Division calls the leniency program “its most important investigative tool for detecting cartel activity.”4
Historically, satisfying the leniency program was the only way to avoid pleading guilty, although other corporate cartel members could obtain reduced sentences or lower fines by cooperating or by having a strong compliance program (internal procedures to prevent, detect, and disclose to the government antitrust violations). Recently, the Antitrust Division announced that it would consider a company’s compliance effort at the charging stage.5 This could result in a deferred prosecution agreement, in which amnesty is granted in exchange for company agreeing to fulfill certain requirements.
Descriptive statistics
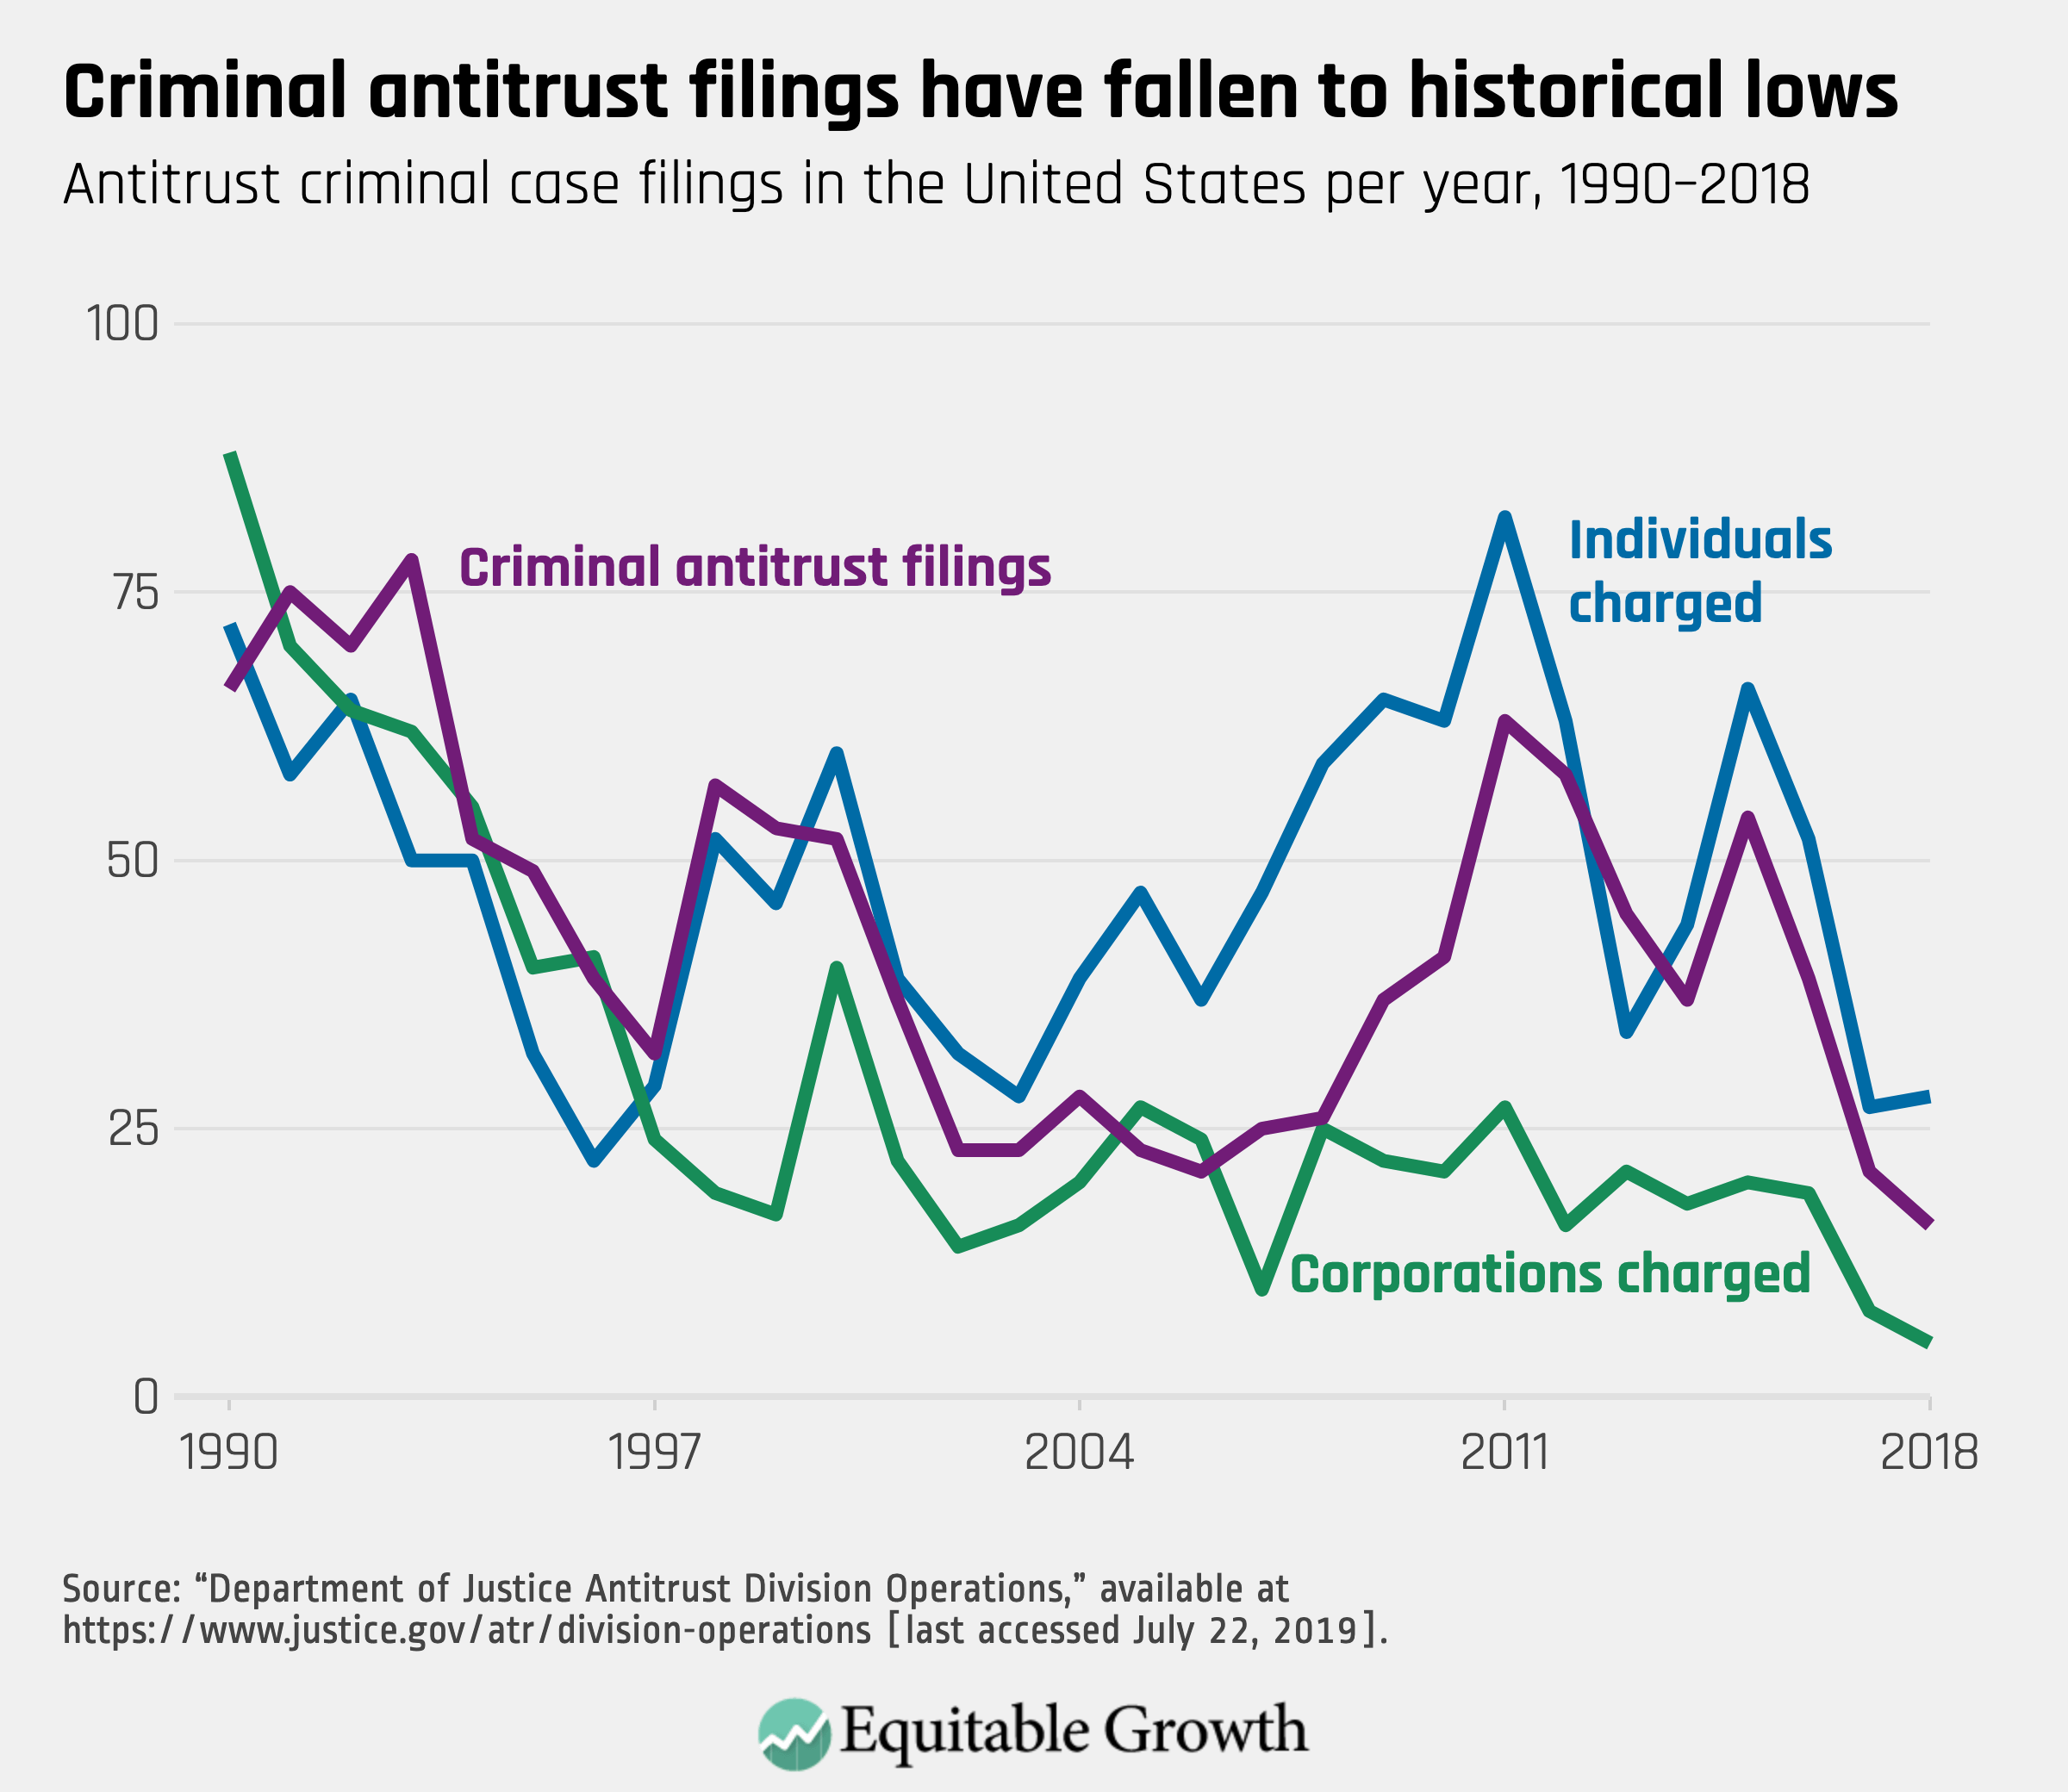
Unlike other areas, there has been less controversy over criminal antitrust enforcement. There have been no consistent calls for more or less aggressive criminal enforcement. Nevertheless, the criminal enforcement actions are at historically low levels, based on multiple measures. The 16 criminal cases filed in 2018 were the fewest filed since 1990. And the 21 criminal cases filed in 2017 were the second-fewest filed (tied with 2006). The five corporations charged criminally in 2018 and the eight charged criminally in 2017 are the fewest since 1990. Over the same time period, only in 1996 were fewer individuals charged than in either 2017 or 2018.6 (See Figure 1.)
Figure 1
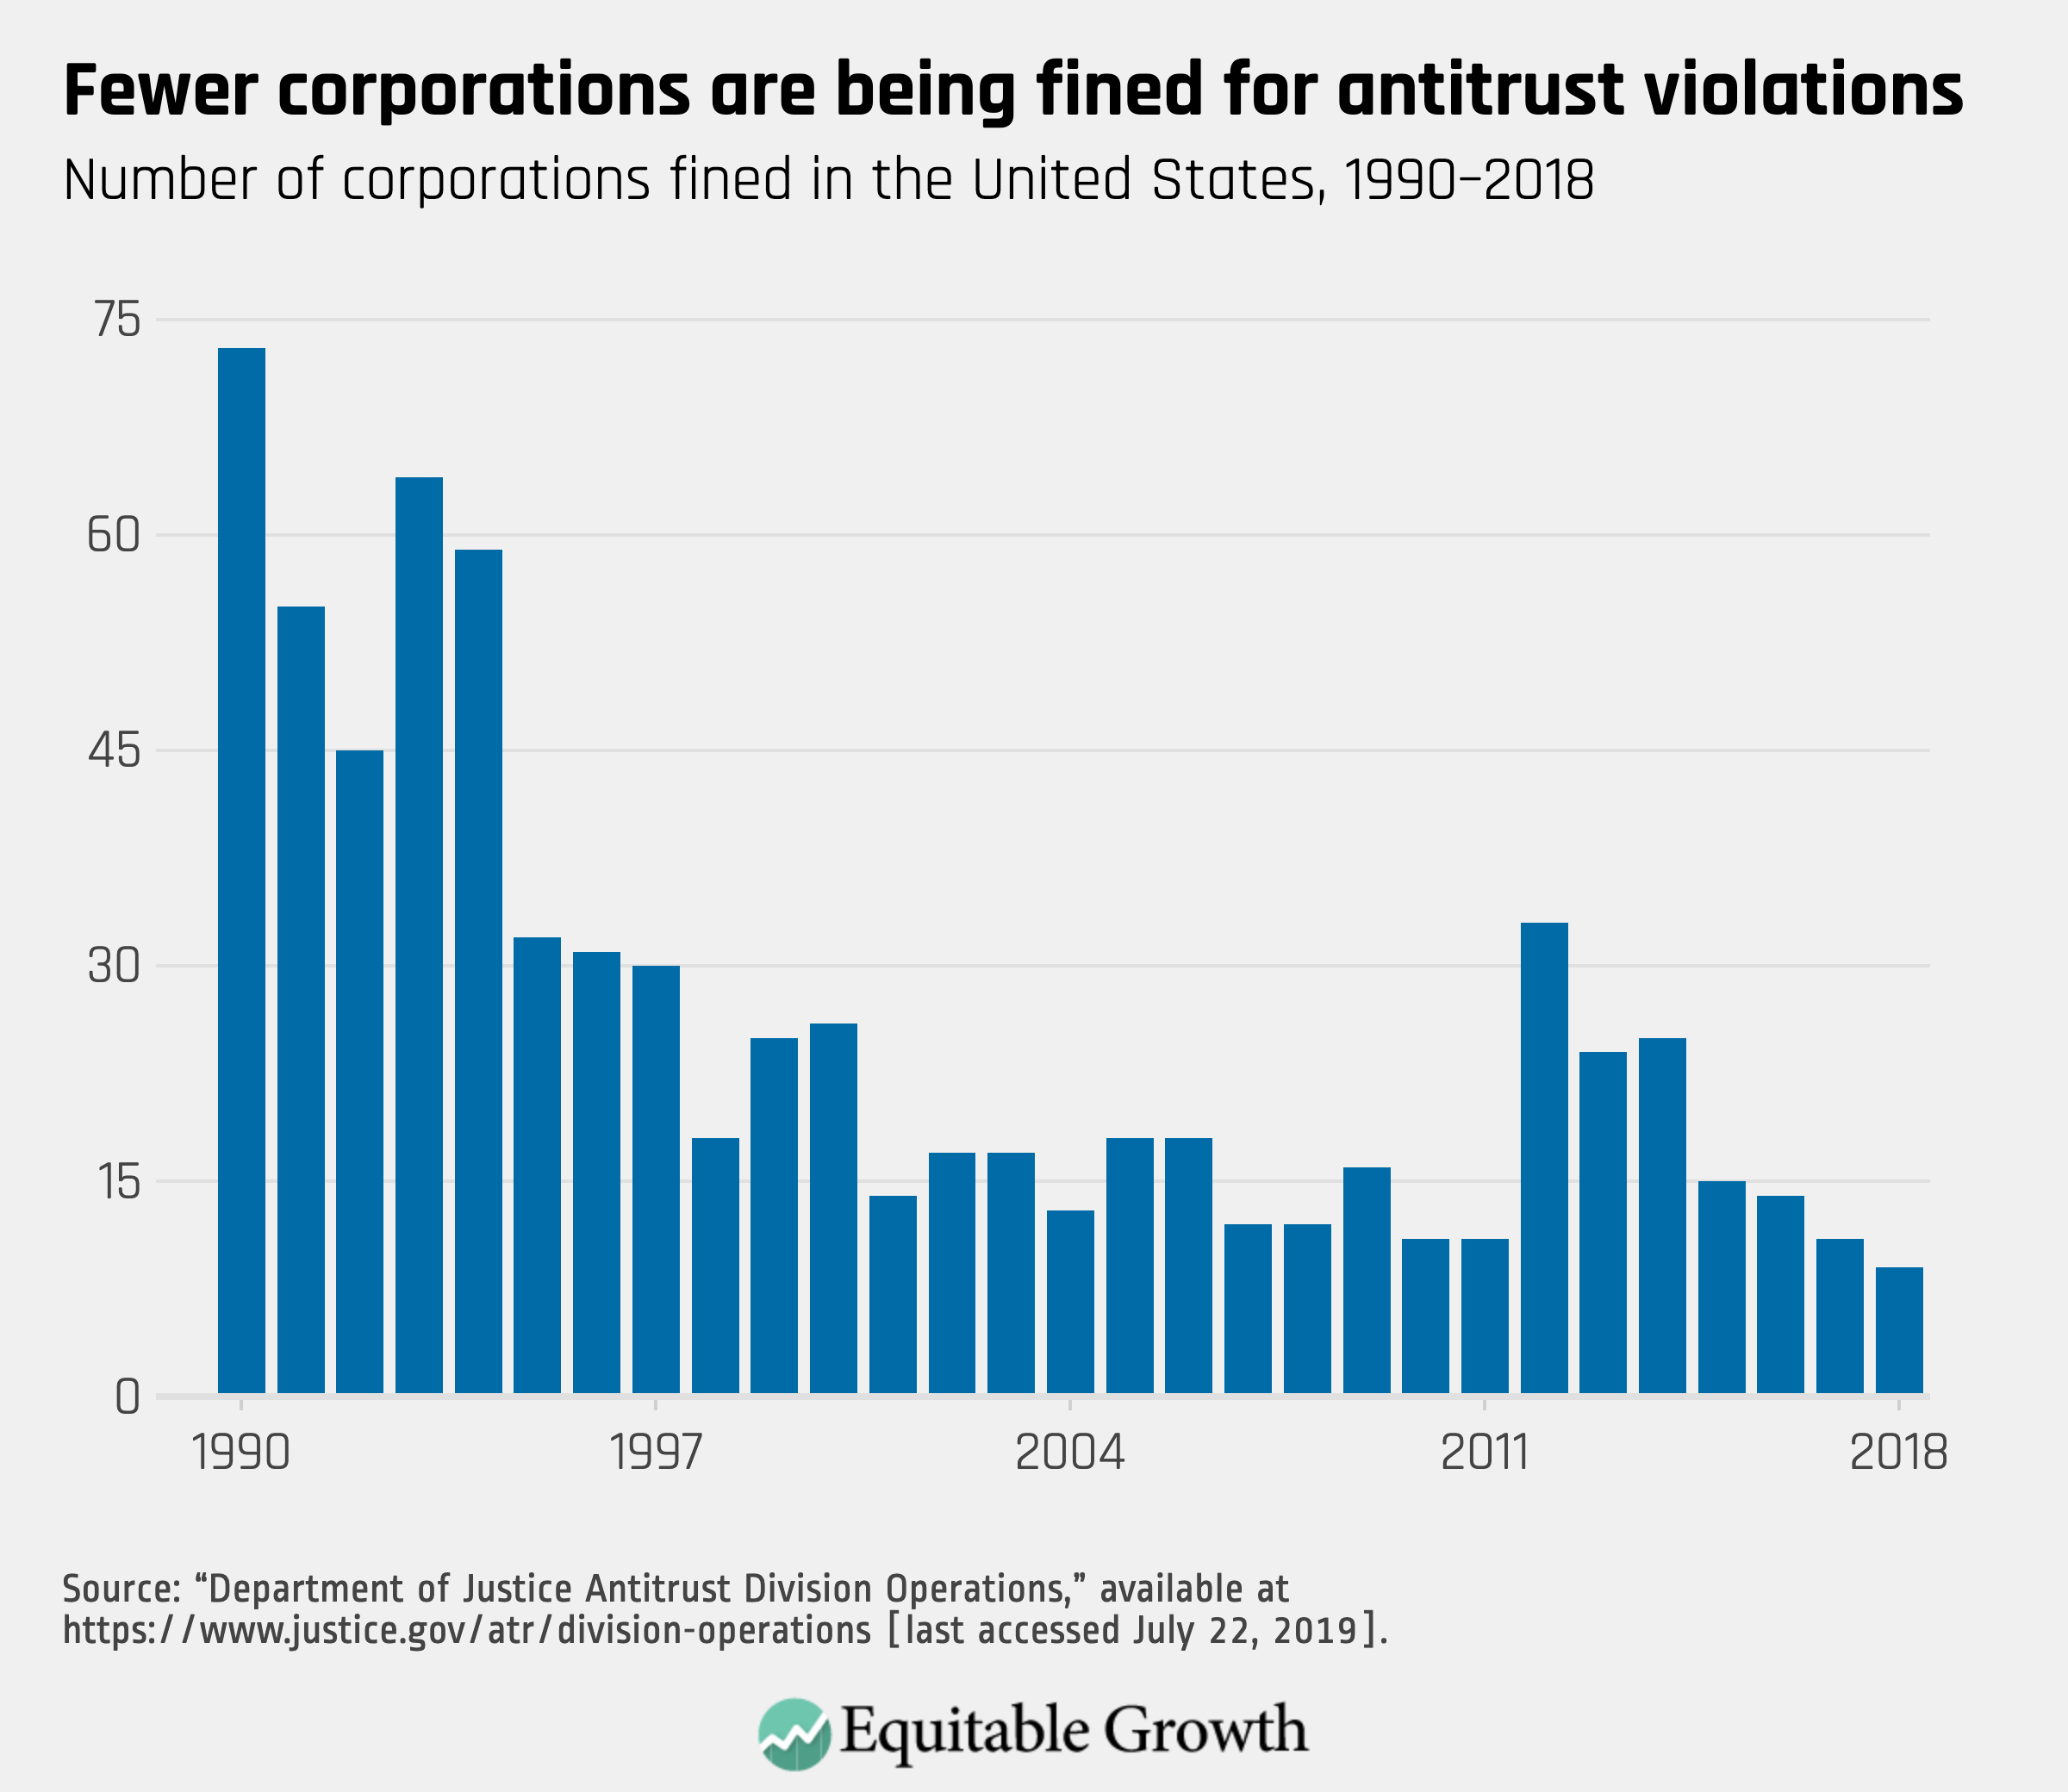
Criminal filings deal with case initiations, but fines and incarceration provide information on how criminal antitrust cases have been resolved. Compared to the early 1990s, far fewer corporations are being fined. (See Figure 2.)
Figure 2
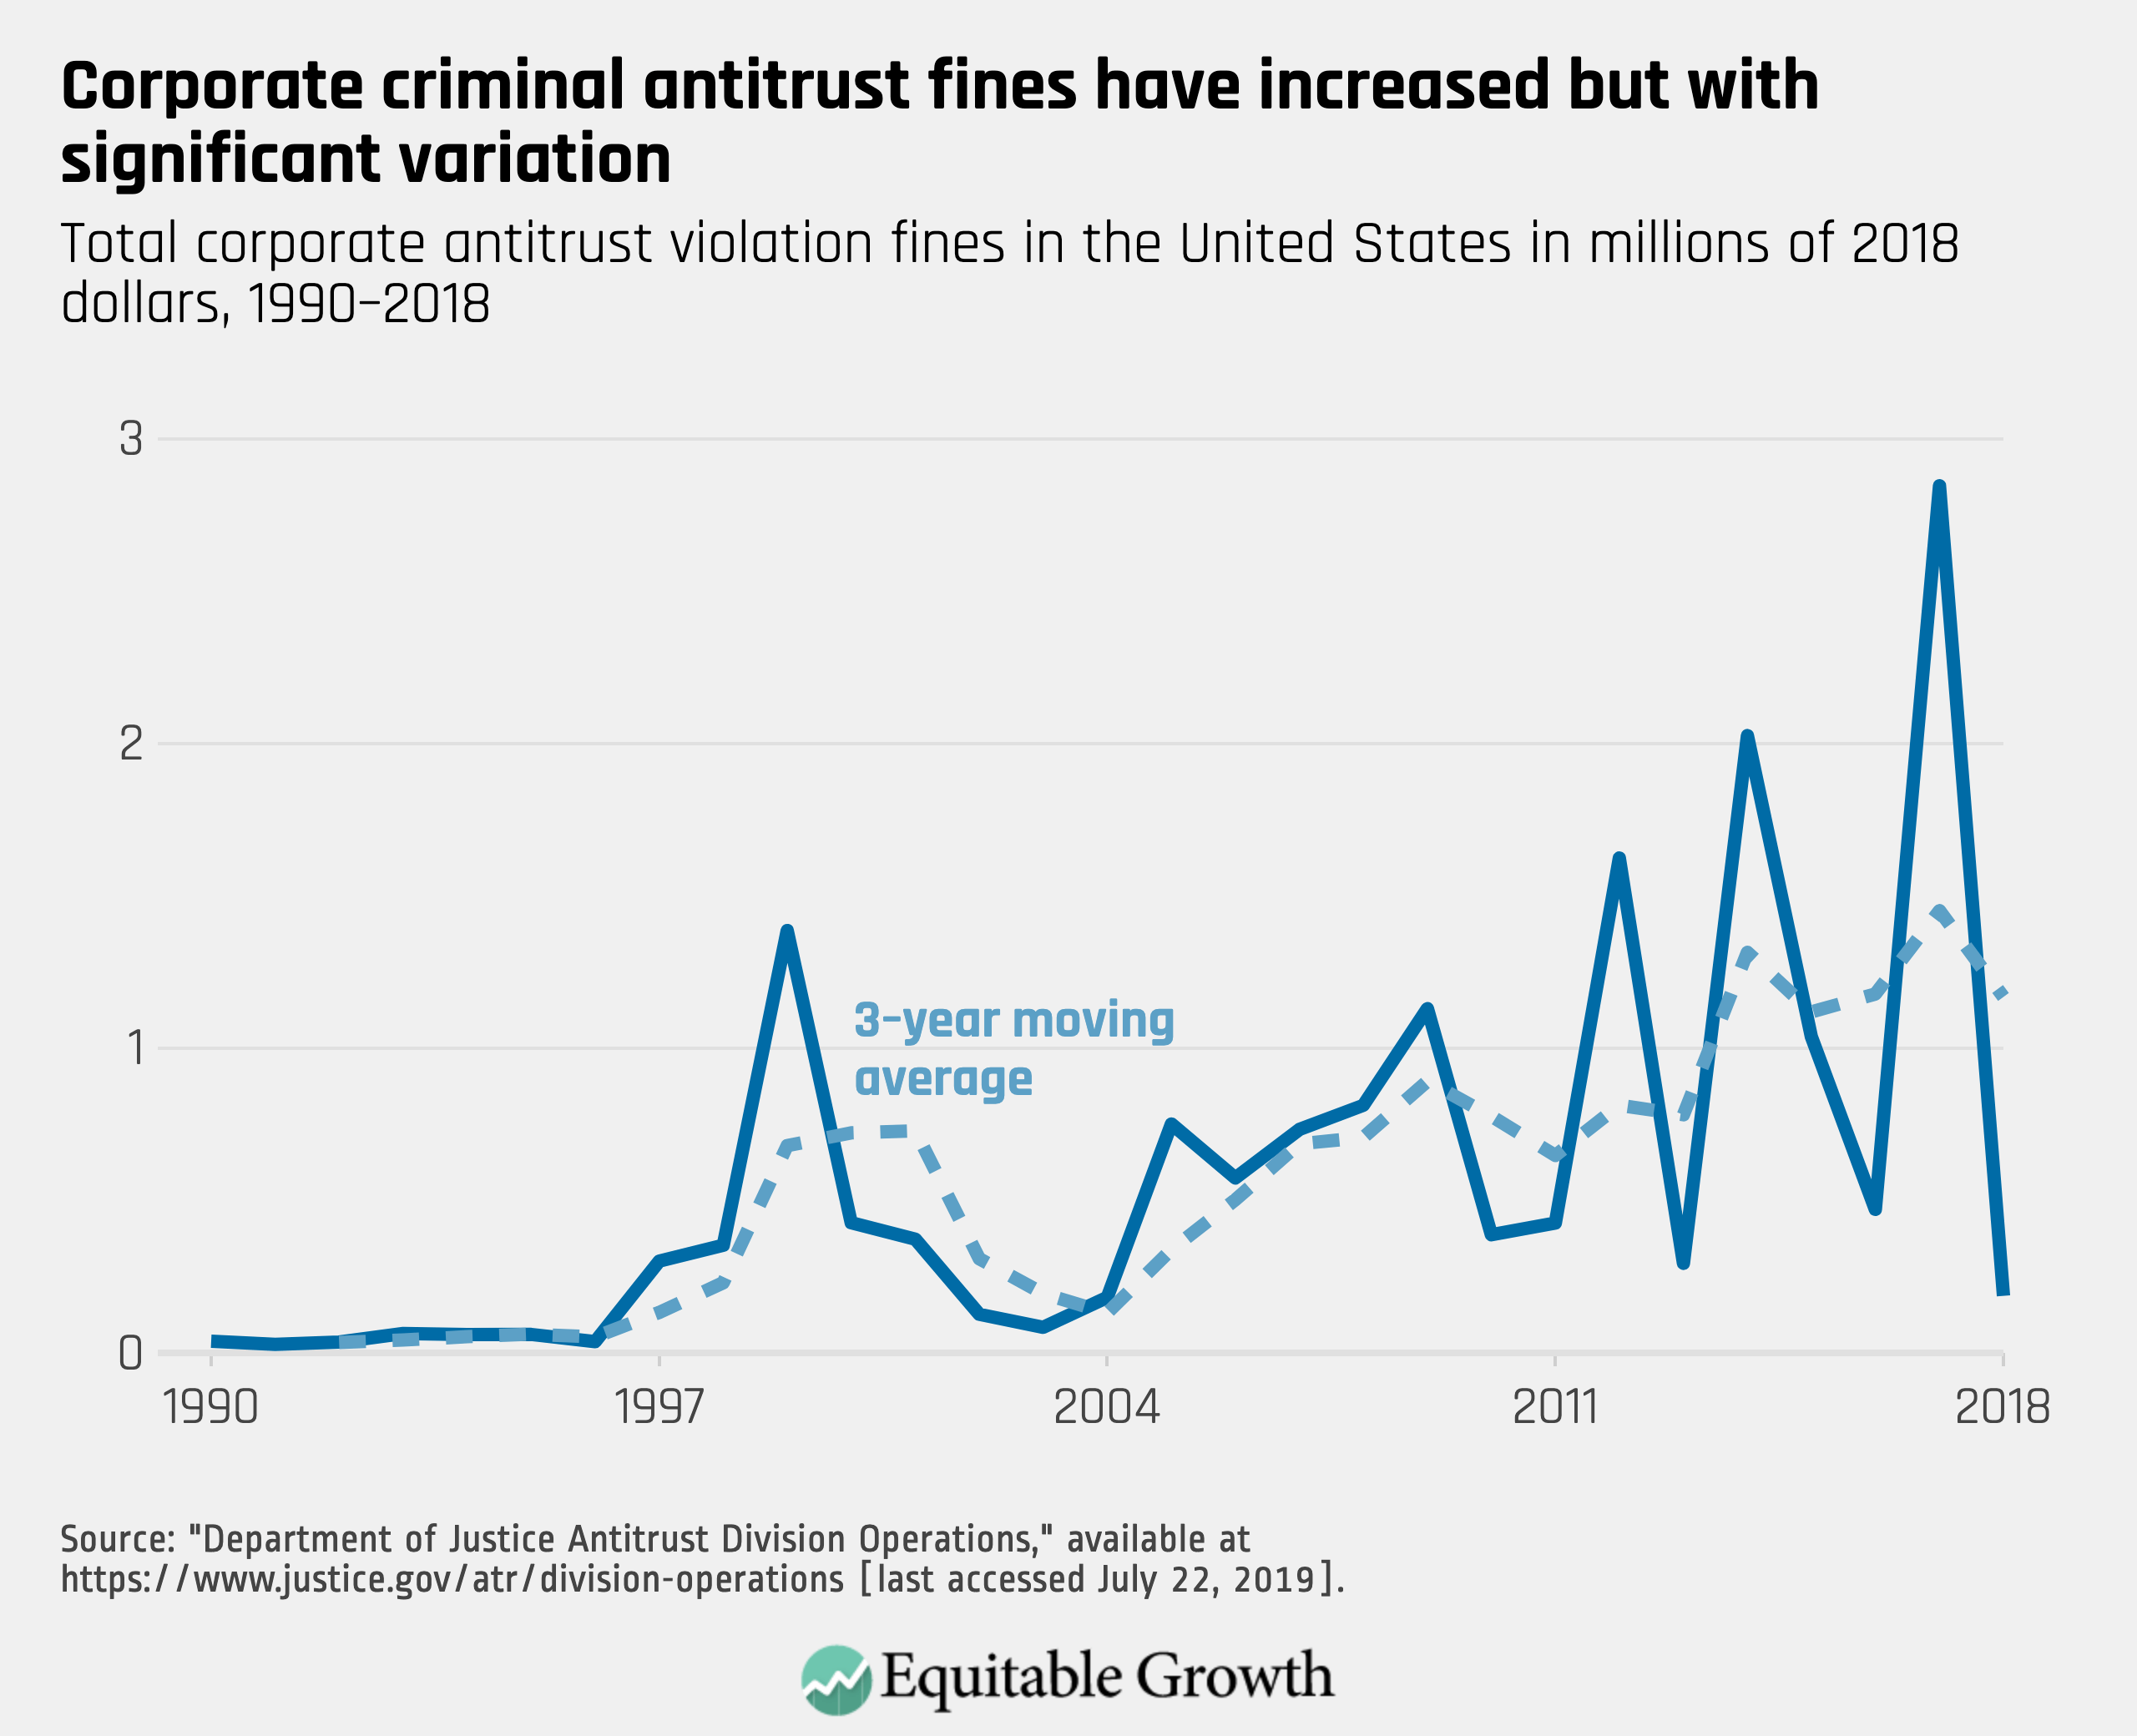
But total corporate fines, in real terms, have, with growing fluctuation, trended upward. Corporate fines substantially increased in 1997, a few years after the modification of the leniency program. (See Figure 3.)
Figure 3
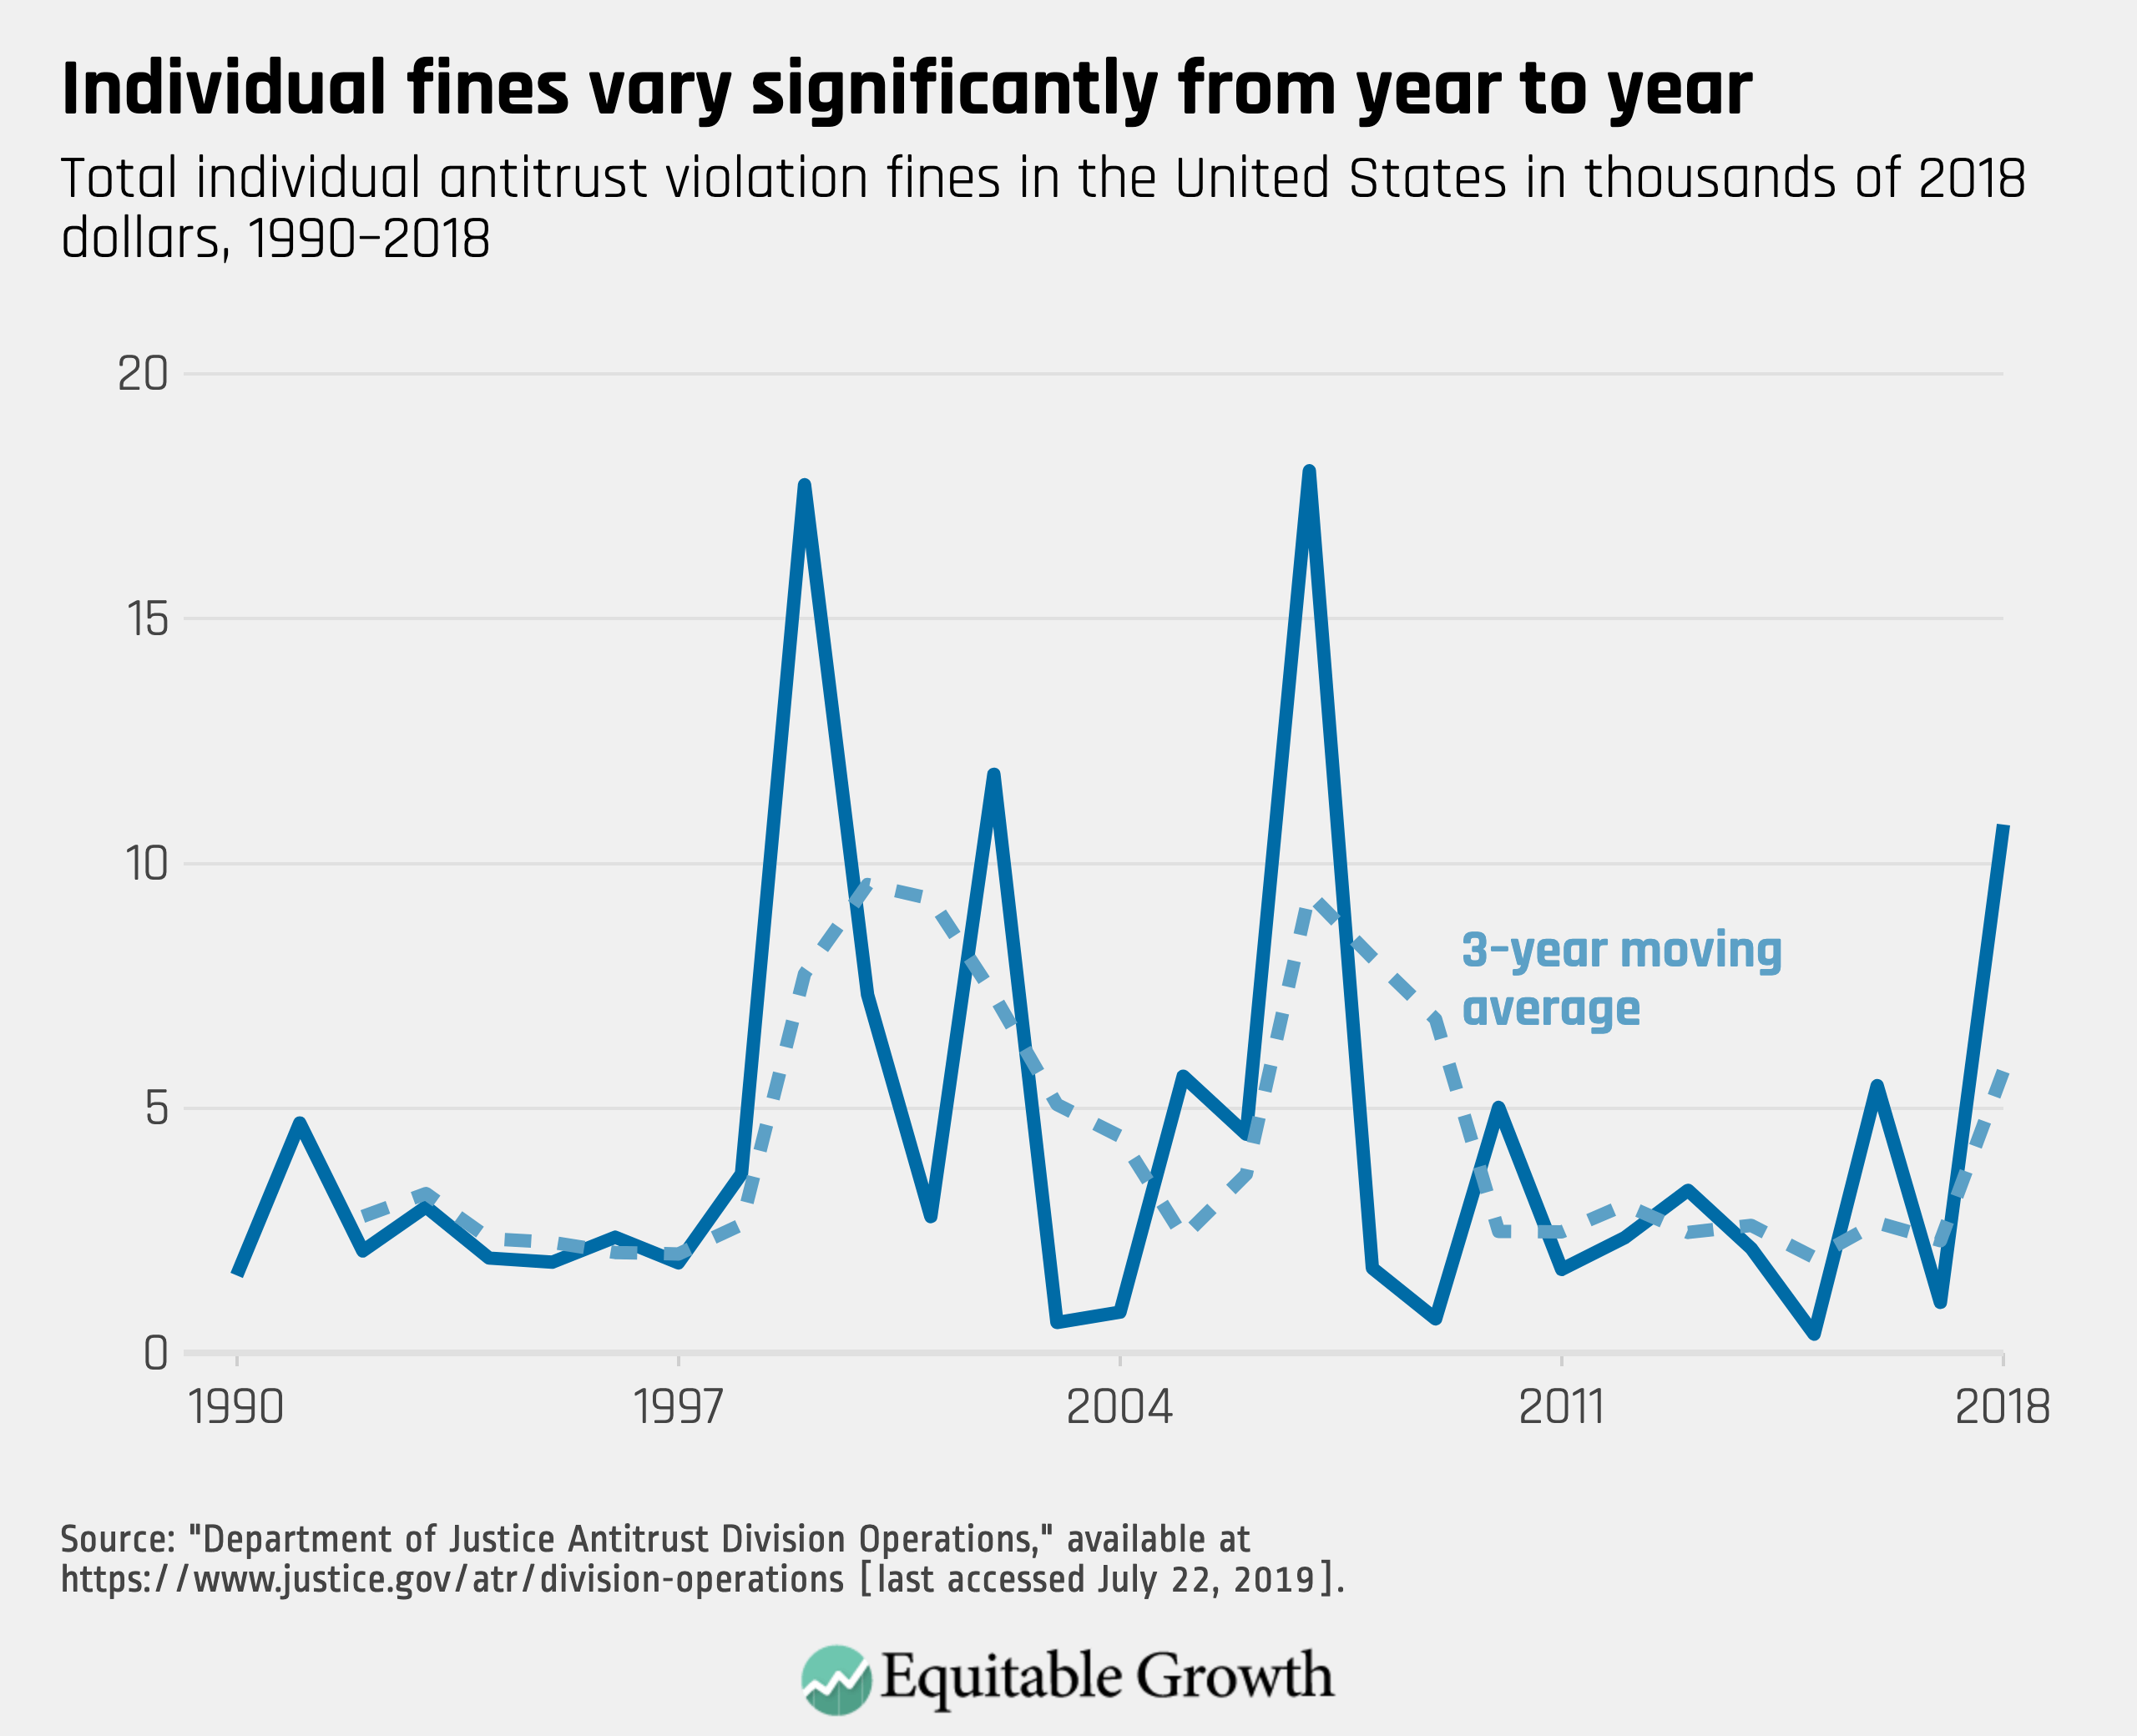
For individuals, the report examines three metrics to look at: the number of fines, the amount of the fines, and the number of individuals incarcerated. The total amount of fines (in real terms after accounting for inflation) varies from year to year. As with corporate fines, there was a noticeable increase following the modification of the leniency program in the 1990s. (See Figure 4.)
Figure 4
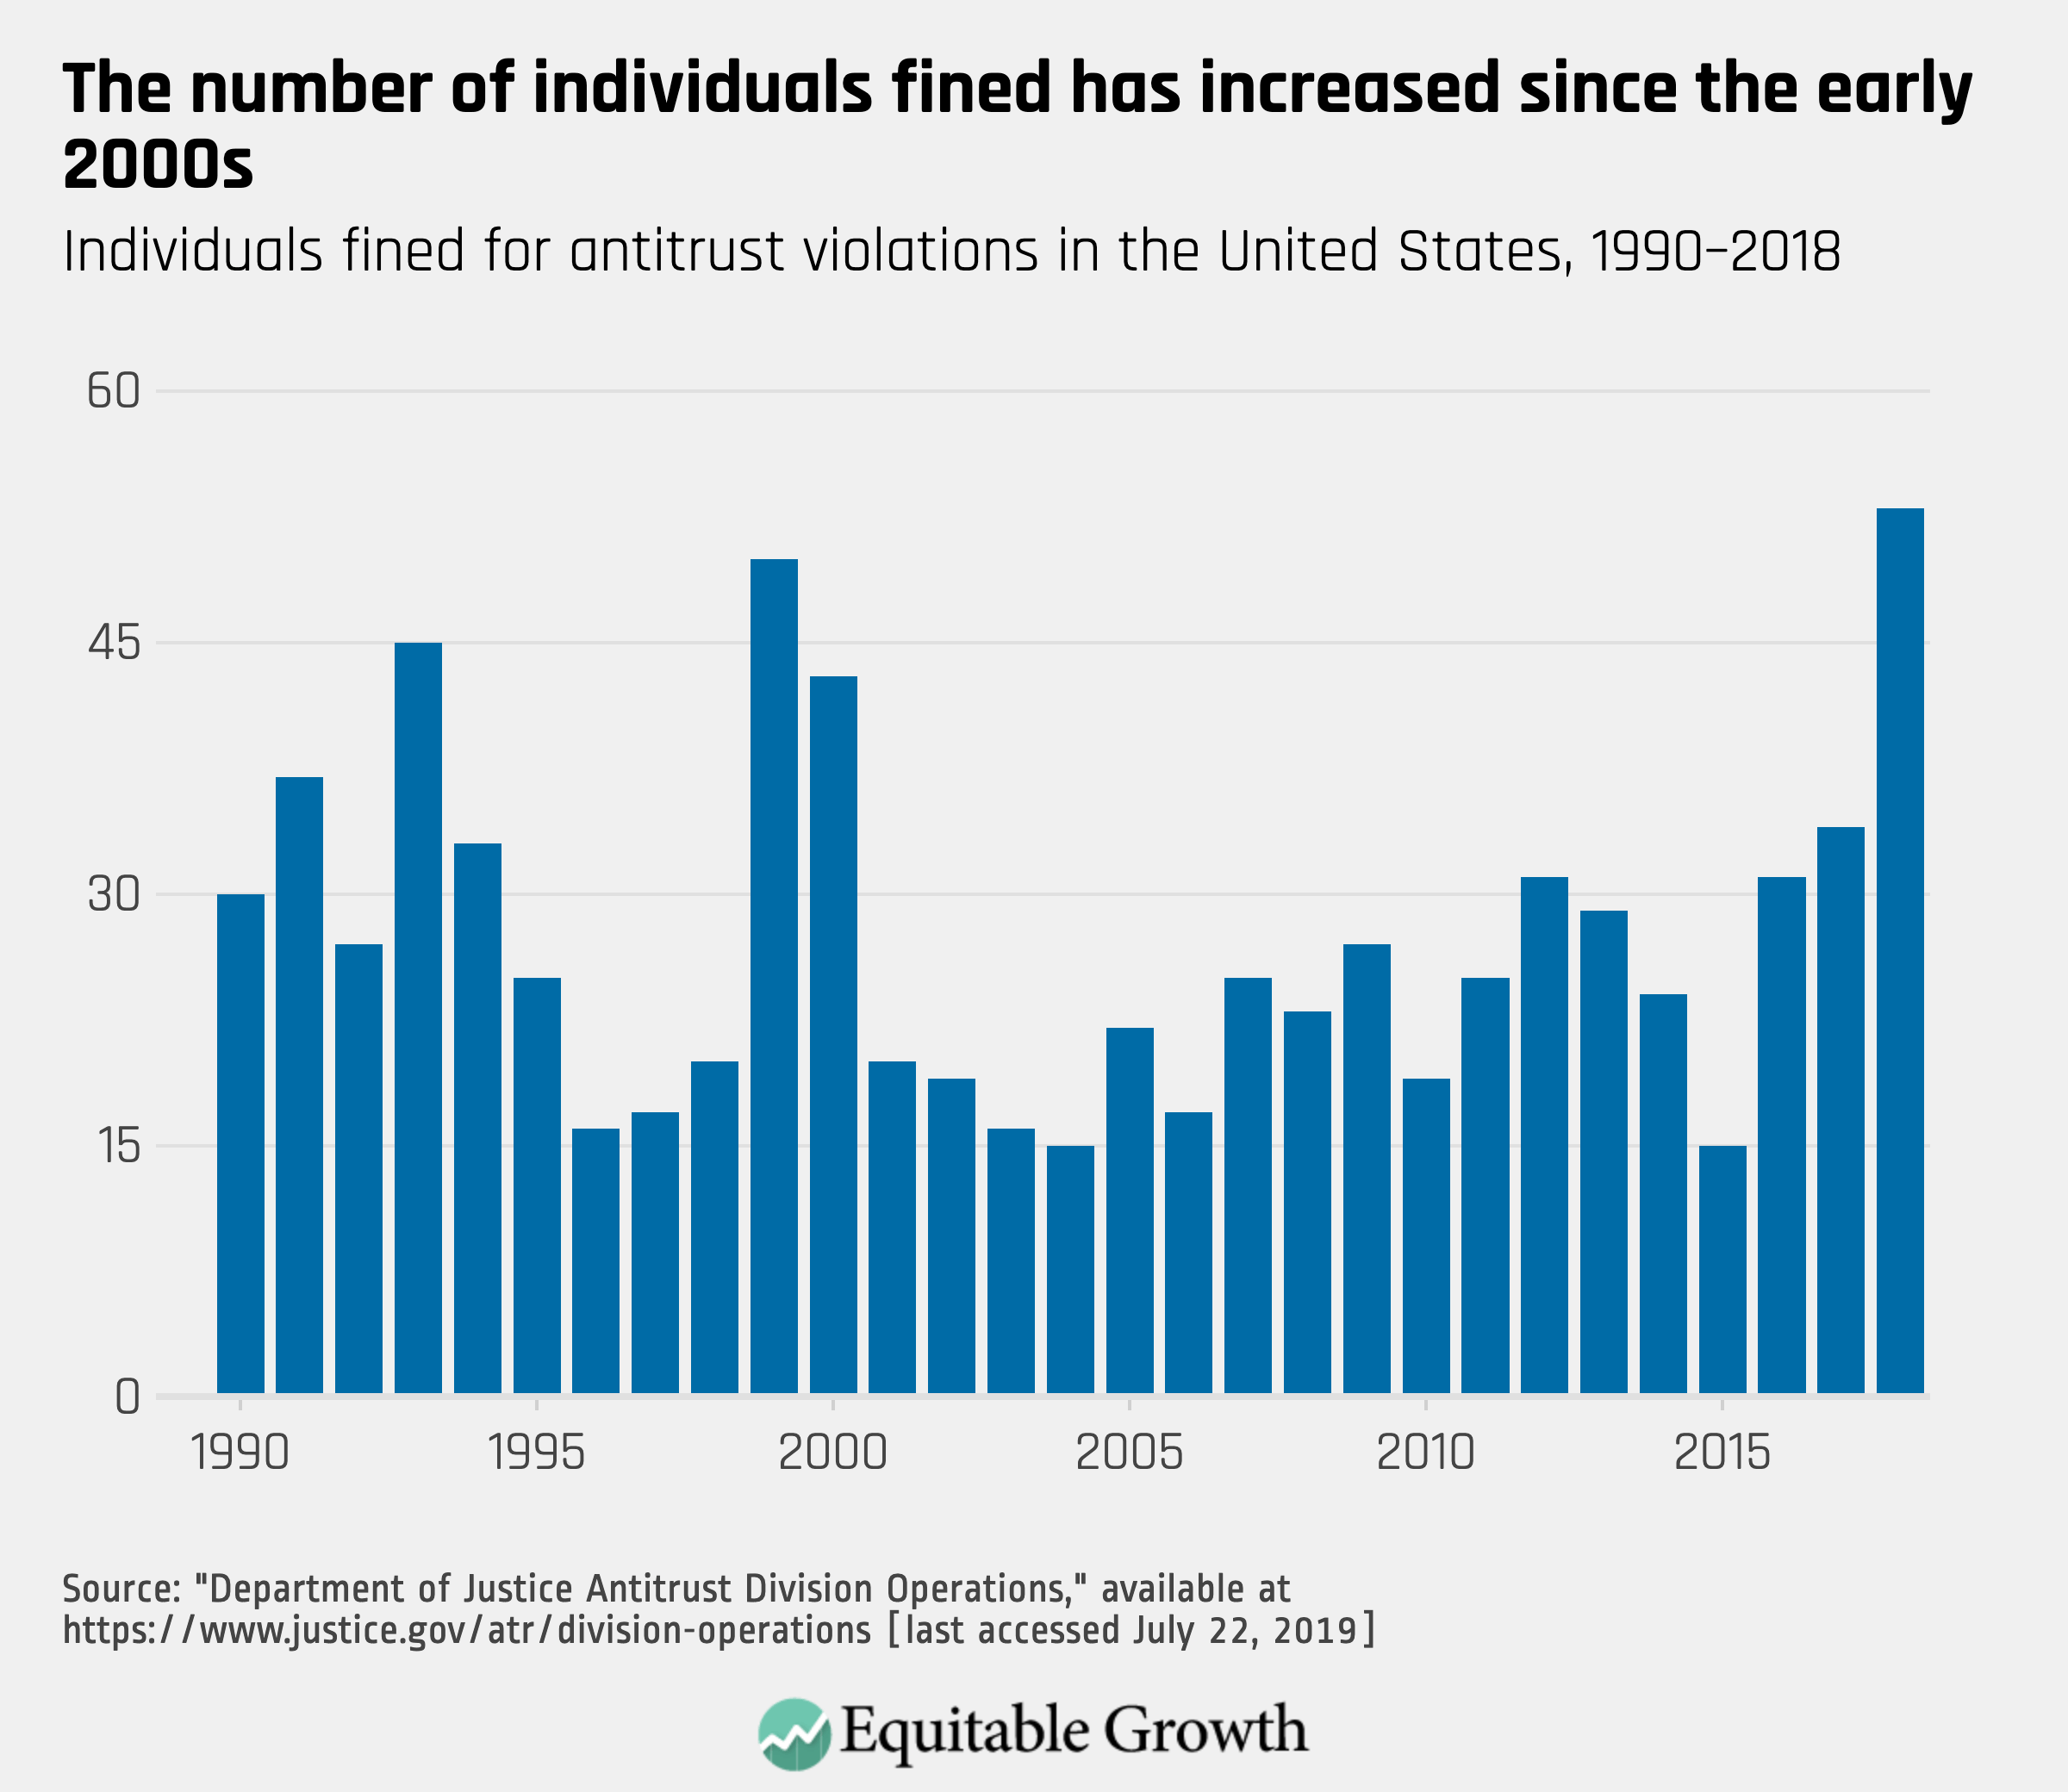
In contrast to the number of corporations fined, which has decreased (see Figure 3), the number of individuals fined has risen, particularly since 2015. (See Figure 5.)
Figure 5
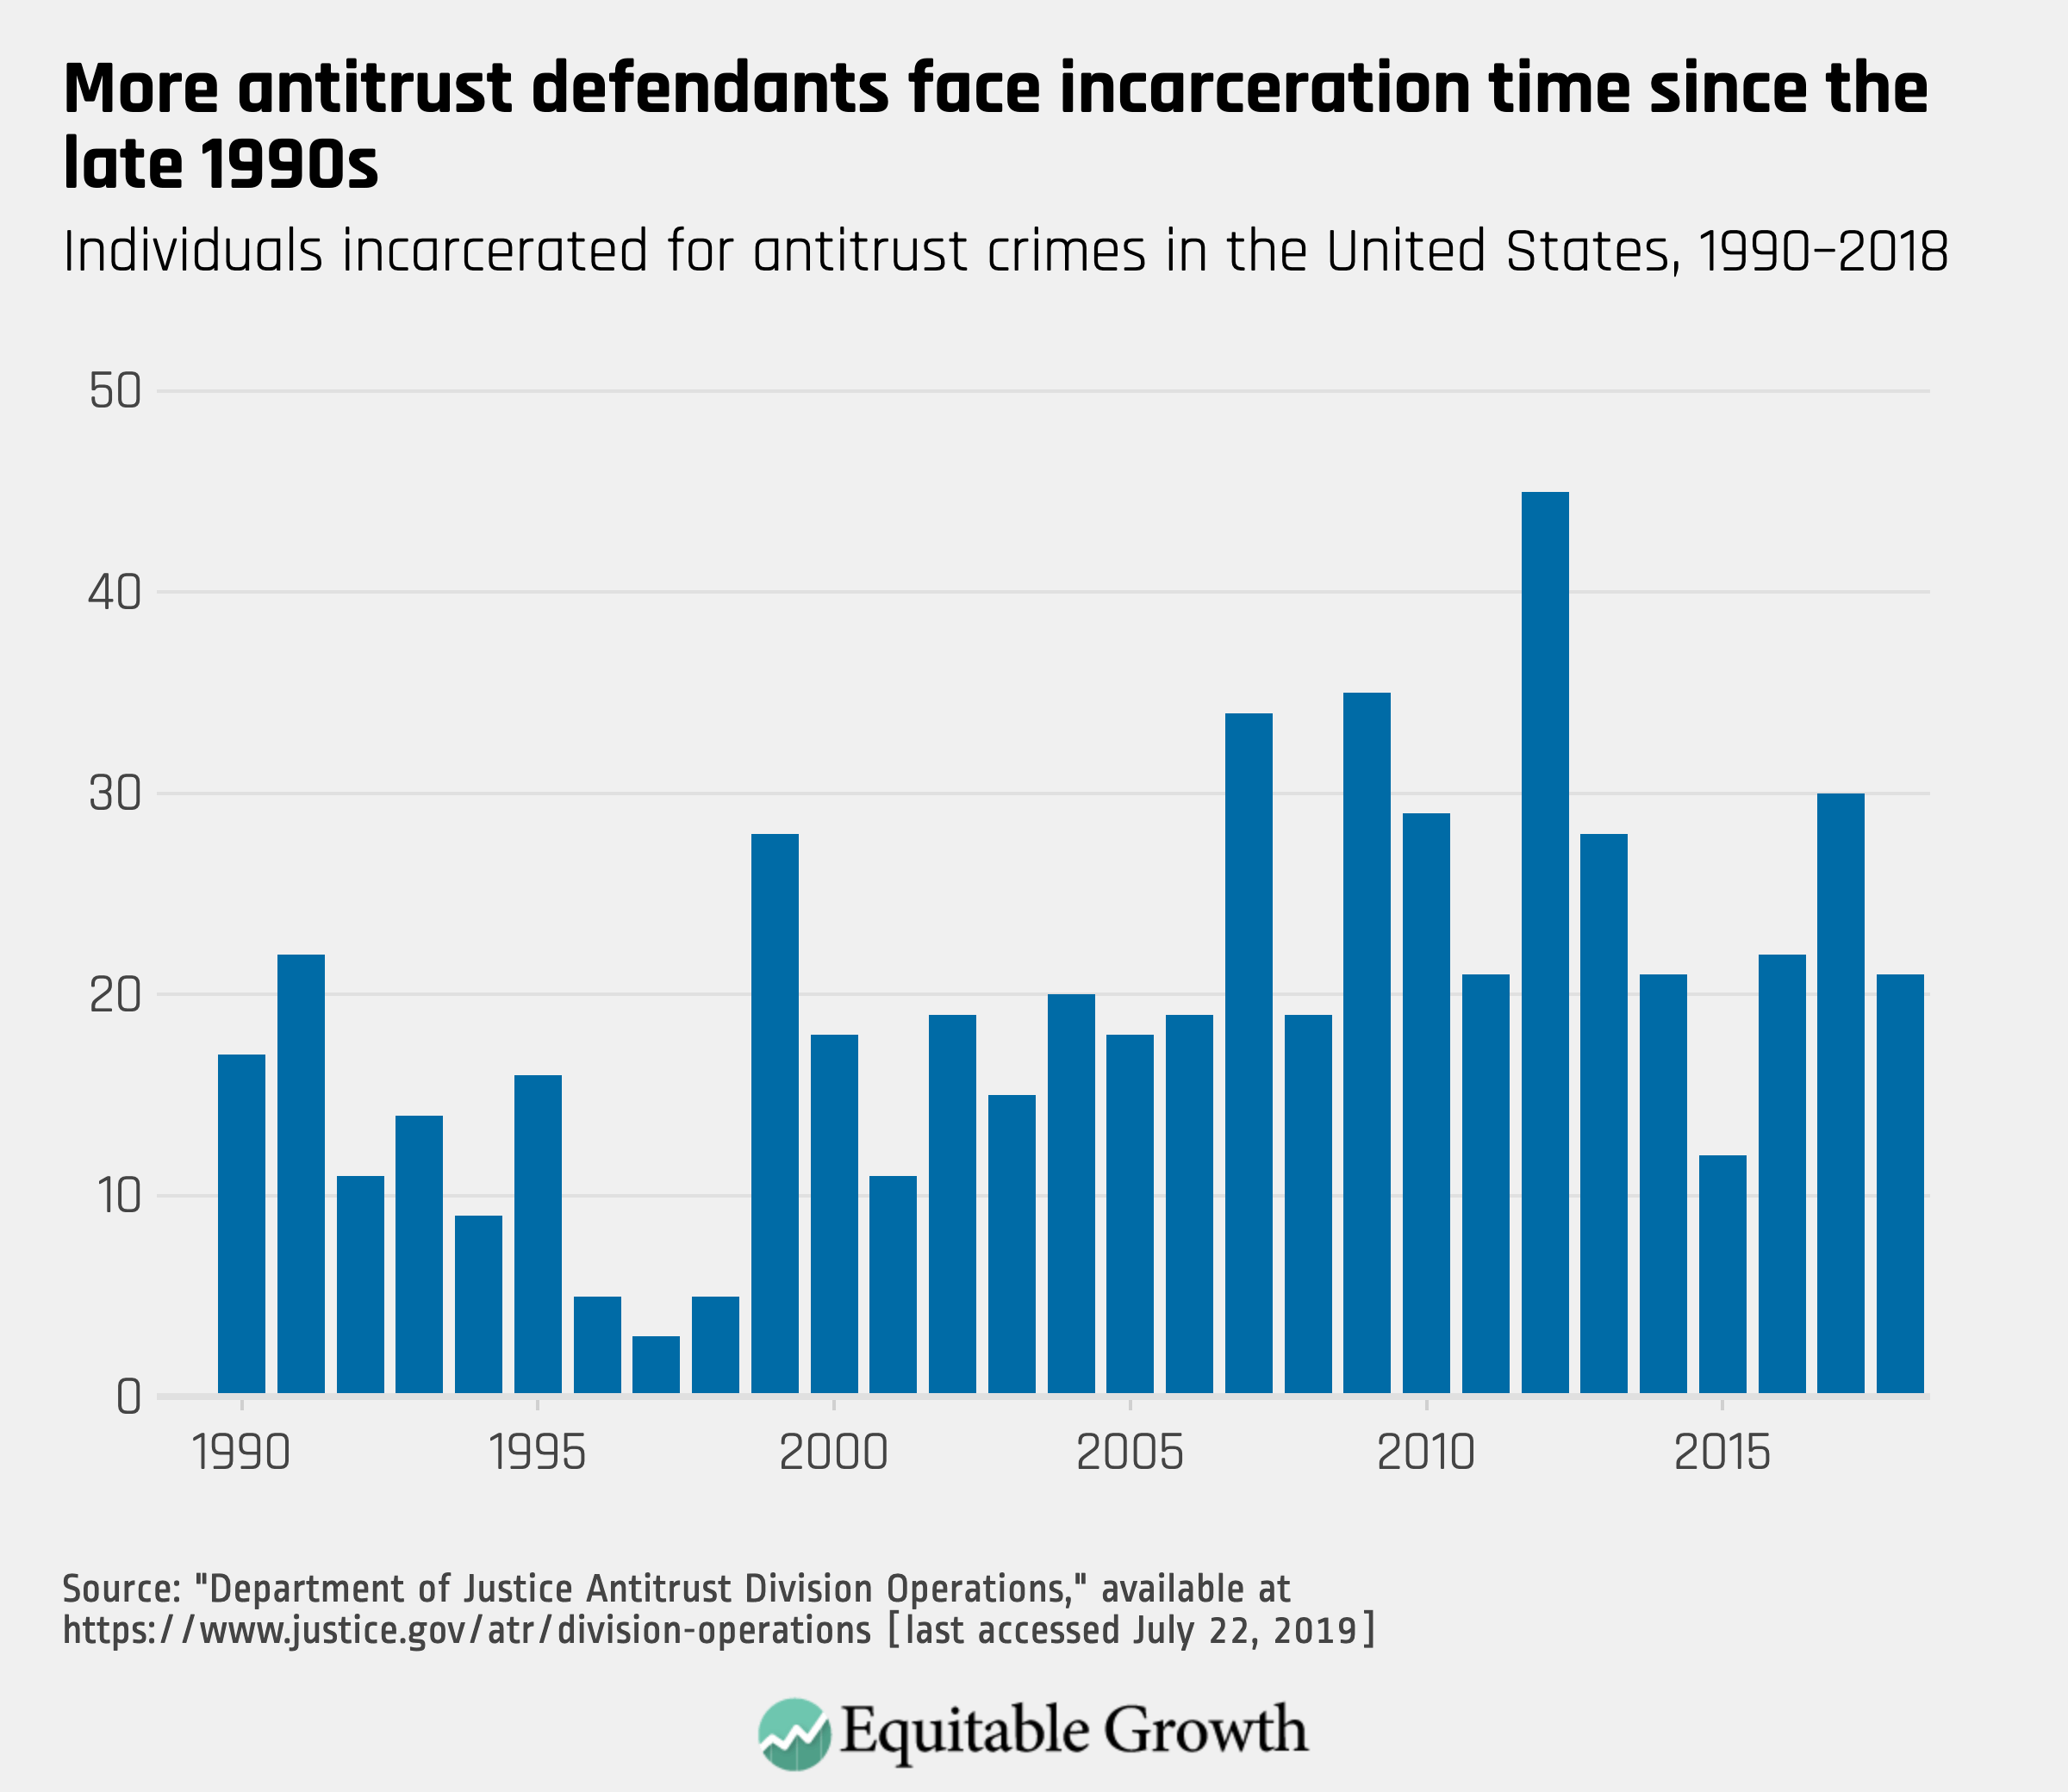
The number of individuals receiving incarceration for violating the antitrust laws also has risen since 2000. (See Figure 6.)
Figure 6
Implications of criminal enforcement statistics
These are simple descriptive statistics. There could be many explanations for trends in the data. Fewer cases could mean less aggressive enforcement, less criminal activity, or a change in enforcement policy. In September 2015, for example, then-Deputy Attorney General Sally Yates issued a memo that emphasized the need to hold individuals accountable.7 Since then, the number of individuals convicted has increased, while the number of corporations convicted has fallen (compare Figures 2 and 5).8 It also is easy to overemphasize individual years or to fail to consider the possible impact of budgetary constraints. A reduction in criminal enforcement occurred in the late 1990s, for example, following a record merger wave and the Antitrust Division’s investigation and trial of Microsoft. Similarly, the total amount of criminal fines depends in part on the amount of commerce affected. A shift from one year to the next may reflect nothing more than the type of cartels uncovered and prosecuted.
At the same time, the data suggests potential areas that Congress, in its oversight capacity, might consider exploring.
First, criminal case filings have noticeably declined over the past 2 to 3 years. Does this data reflect a change in prosecutorial discretion, a reduction in cartel activity, a growing difficulty in detecting cartels, a limitation of resources, yearly variance, or some other phenomenon?
Second, has there been a change in focus away from corporate defendants? If so, then why?
Third, does the rise in individual fines and incarceration since 2015 represent a change in policy? Has there been a shift from focusing on corporations to focusing on individuals?
Fourth, the Antitrust Division recently announced that it would begin considering compliance programs at the charging stage, including the possibility that such a program could justify a deferred prosecution agreement. Is the change based at all on the view that certain companies were not receiving due credit for having developed and implemented strong compliance programs that were not perfect? If so, is that view consistent with the decreasing number of corporations being fined since 2012?
There should be no preconceived notions as to the answers to these questions. But the data suggest that these are areas Congress should consider in determining how effective criminal antitrust enforcement has been.
Merger enforcement
Mergers refer to transactions in which one company purchases all or part of another company. In 1976, Congress passed the Hart-Scott-Rodino Act, which requires companies to report transactions of a certain type to the government before they complete the merger. The government then has a period of time to review the transaction.
Two objectives drove this reform. First, it is much harder to recreate competition once a merger is complete, often referred to as “unscrambling of the eggs.” The physical assets of one of the companies may have been mothballed or sold; many of the employees may have subsequently obtained other employment; trade secrets can’t be unlearned; and customer relationships may have atrophied. Second, a before-the-fact, review-and-challenge regime eliminates the risk of anticompetitive harm occurring during the investigation and litigation phase.
As a result of the Hart-Scott-Rodino Act, the bulk of noncriminal antitrust enforcement in the United State is merger enforcement, and it depends, in part, on merger activity. If there are no mergers in a year, there will be no enforcement actions.
Descriptive statistics
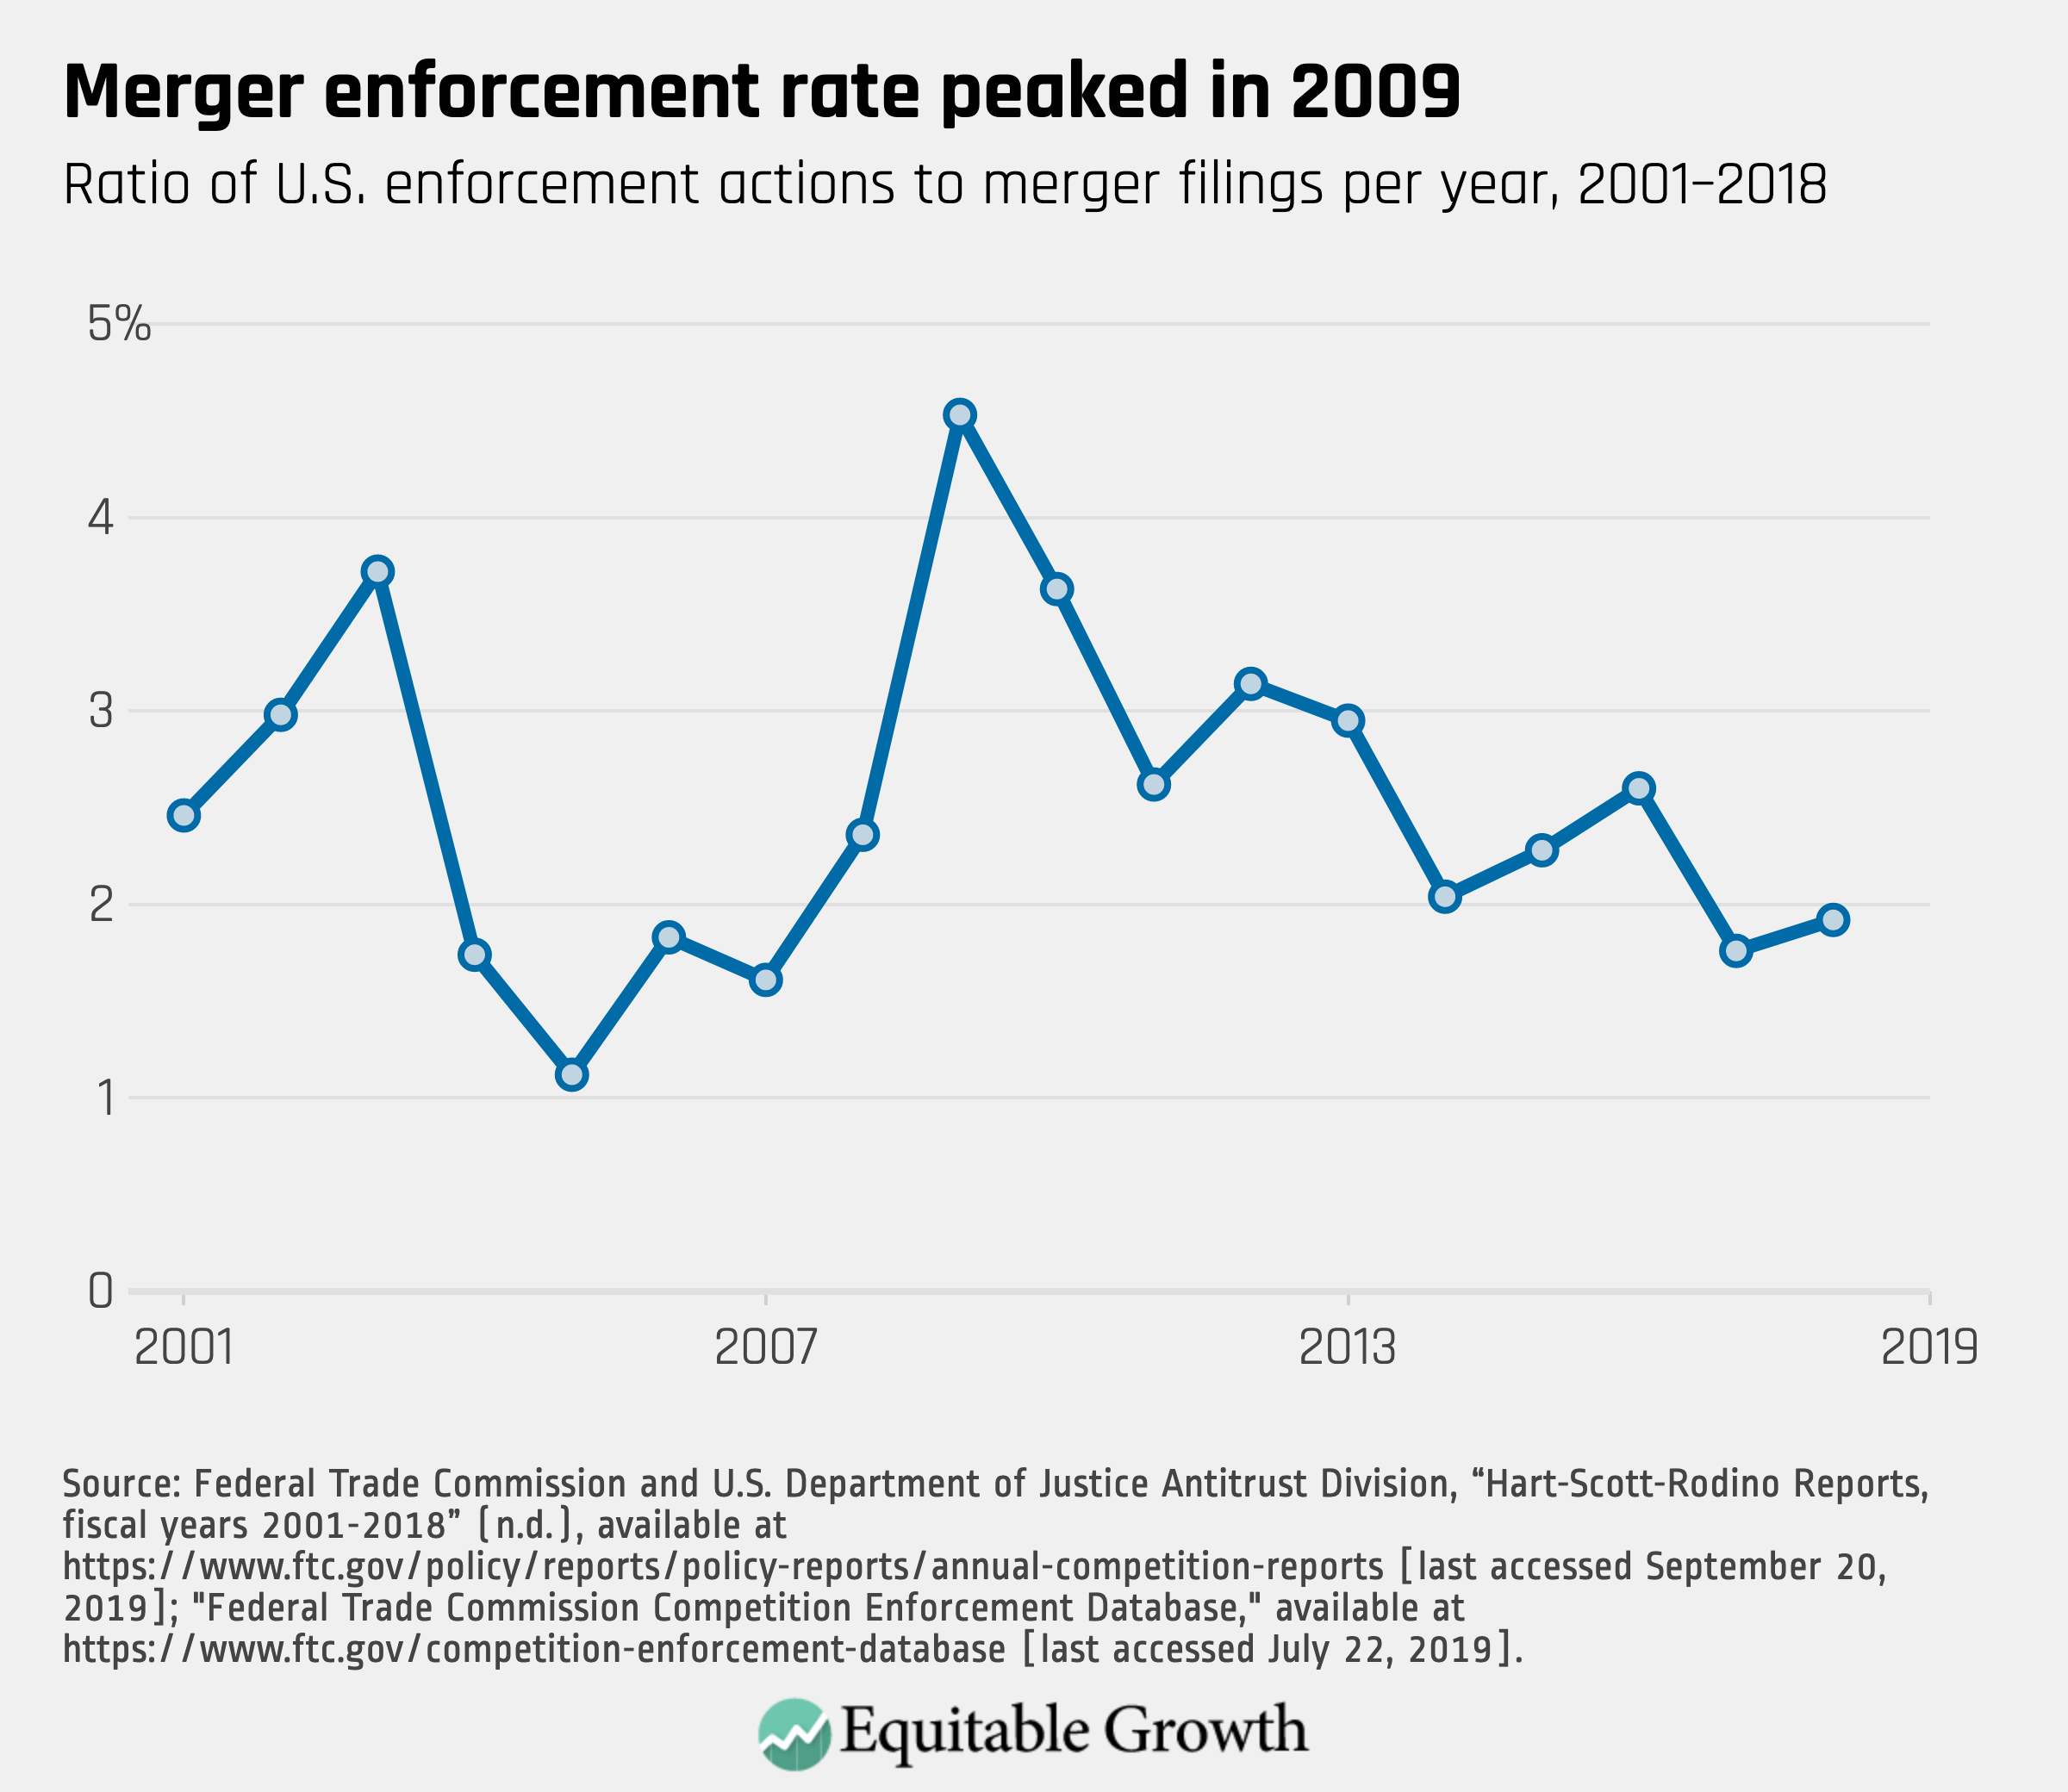
In measuring merger enforcement activity, professors Jonathan Baker at American University’s Washington College of Law and Carl Shapiro at the University of California, Berkeley’s Haas School of Business look at the ratio of the number of enforcement actions to the number of merger filings (the enforcement rate).9 The two professors relied (not exclusively) on those statistics in arguing that the first 6 years of the George W. Bush administration saw historically low merger enforcement, which reversed in the first 2 years of the Obama administration, reflecting a more vigorous policy.
Others, including former Federal Trade Commission Chairmen Timothy Muris and William Kovacic and professor Daniel Crane, the Frederick Paul Furth Sr. Professor of Law at the University of Michigan Law School, take issue with this approach for multiple reasons.10 They argue that a low enforcement rate could reflect effective deterrence, that a high enforcement rate could reflect an enforcer’s inclination to take weak consents, or that an economic shock could affect the enforcement ratio.11
Regardless of the right or wrong inferences, the historical merger enforcement rate provides a useful context to understand antitrust enforcement. The highest rate was in 2009 and has declined since then.12 (See Figure 7.)
Figure 7
Breaking up the ratio to its component parts reveals how differences in enforcement activity and merger activity affect changes in the enforcement rate. Not surprisingly, over the long term, enforcement activity has been highly correlated with merger activity—more cases are brought when more mergers occur.13 (See Figure 8.)
Figure 8
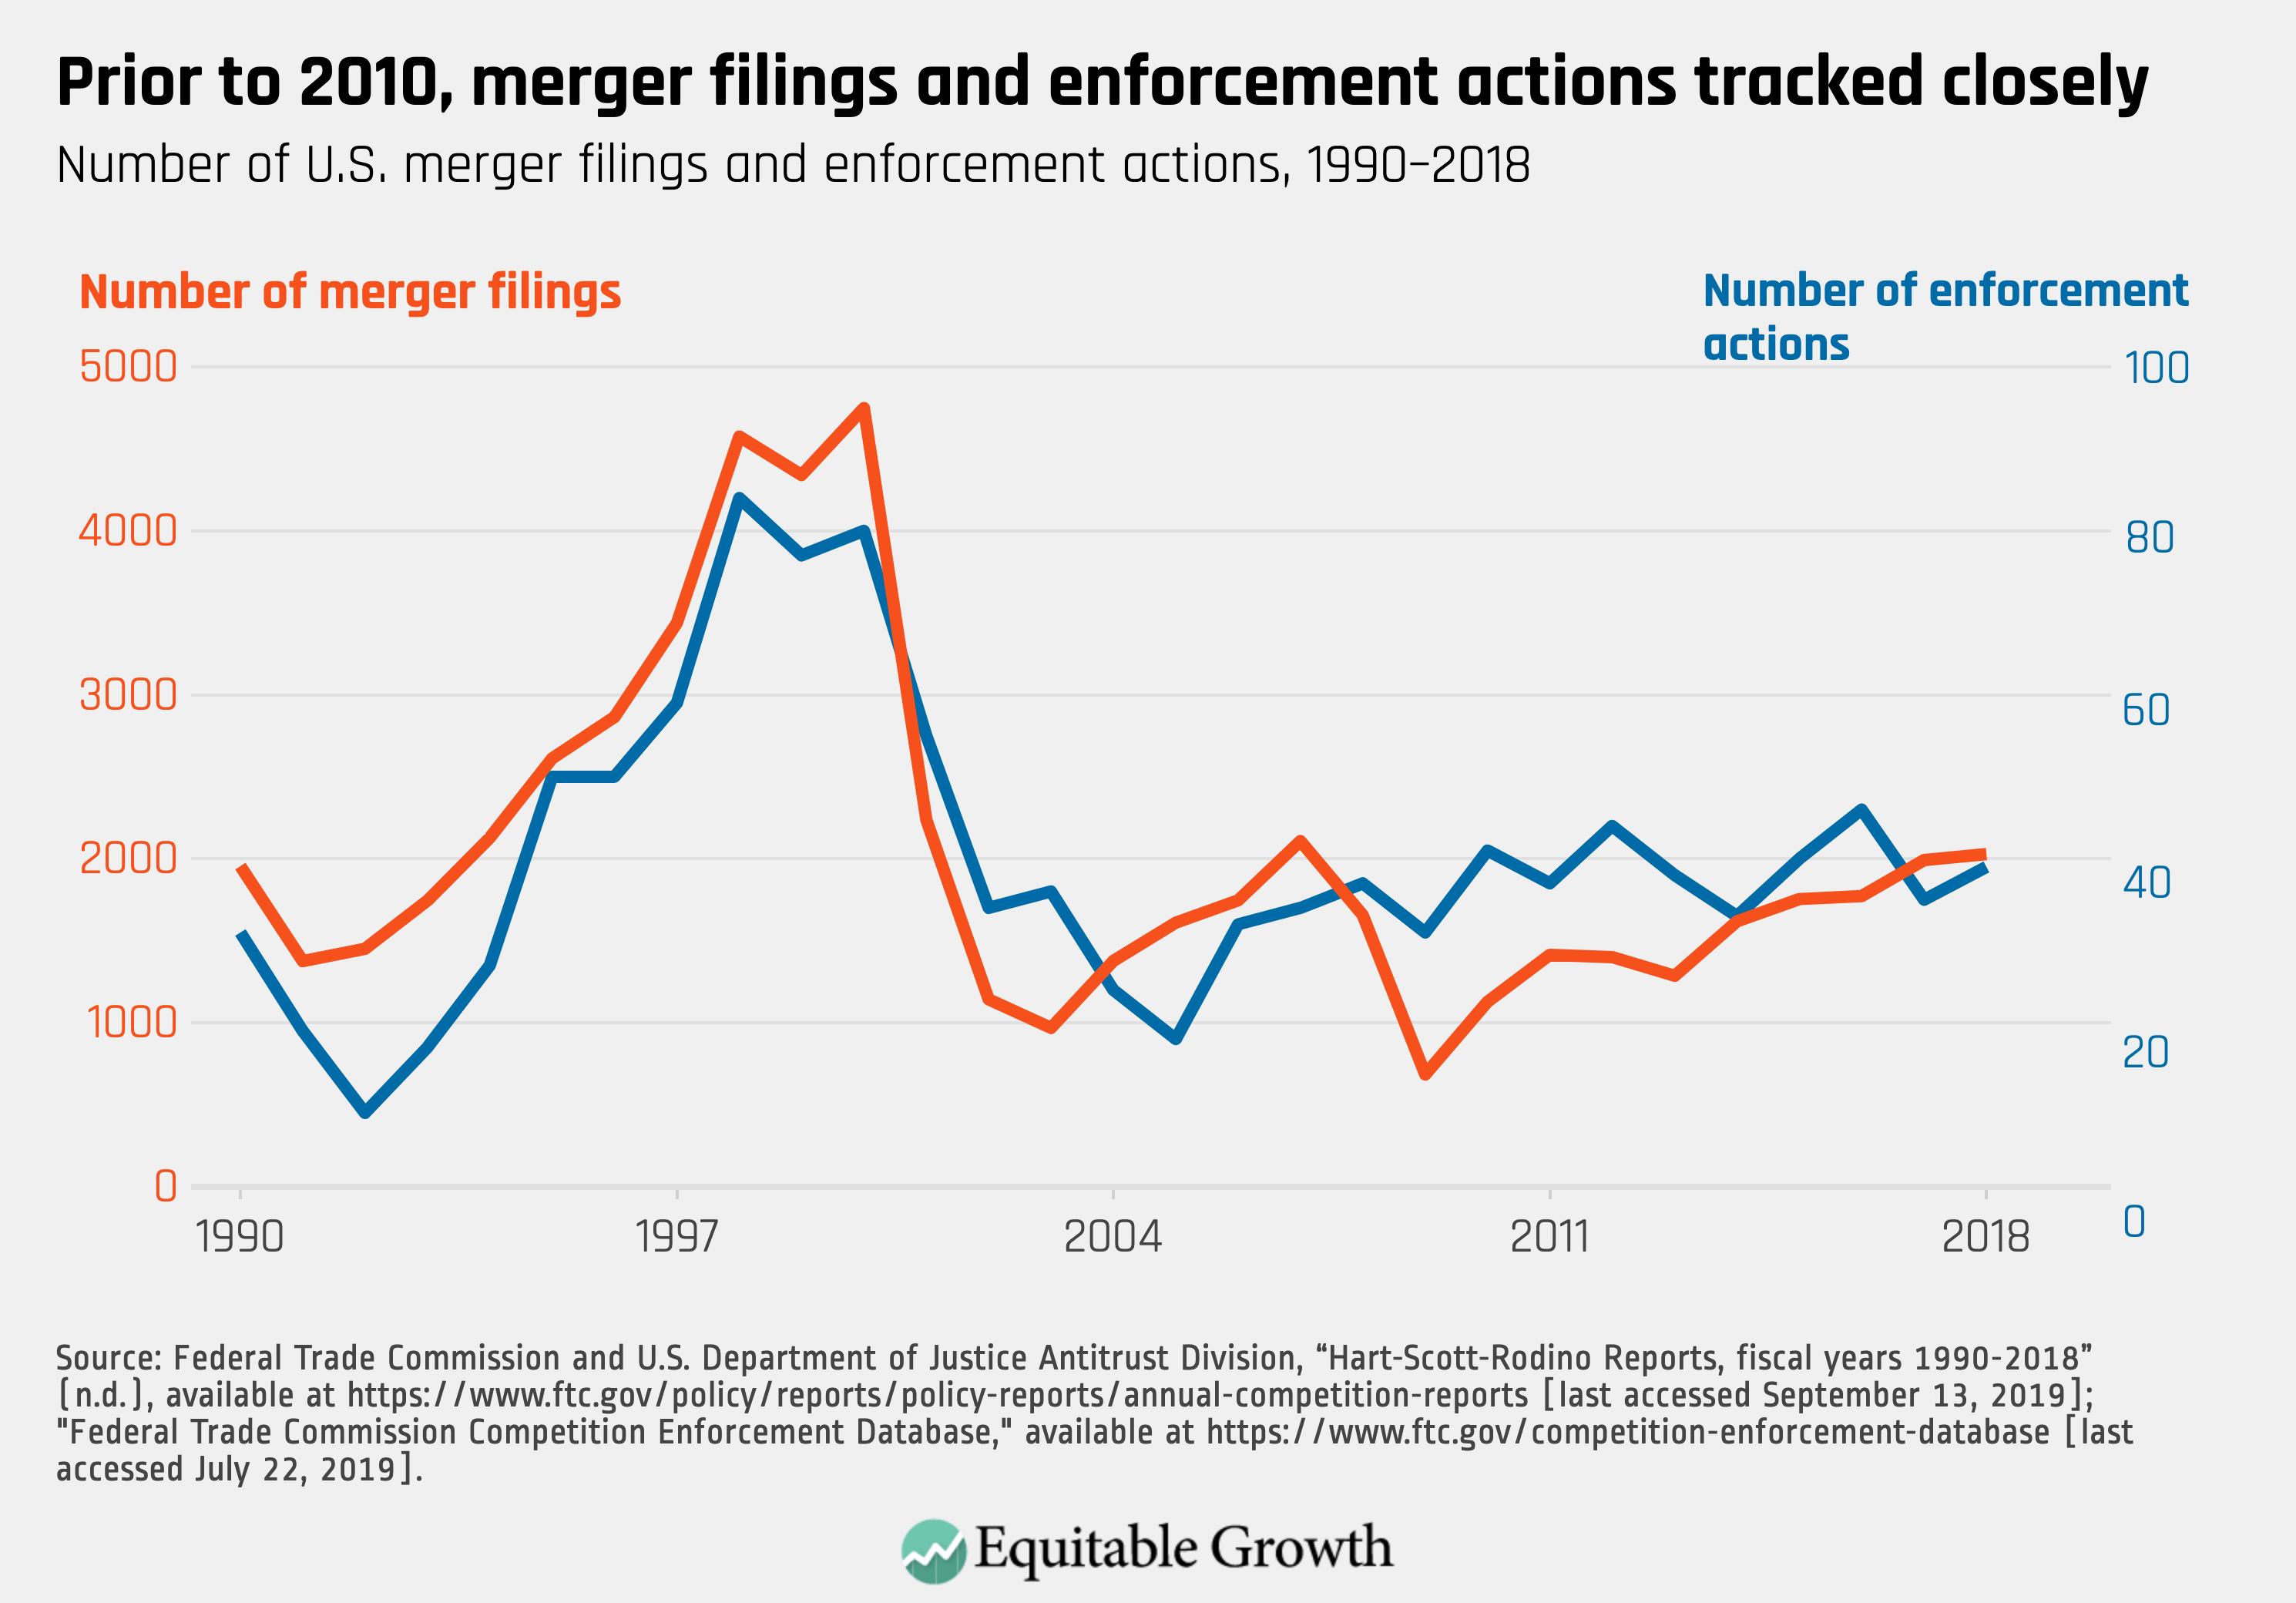
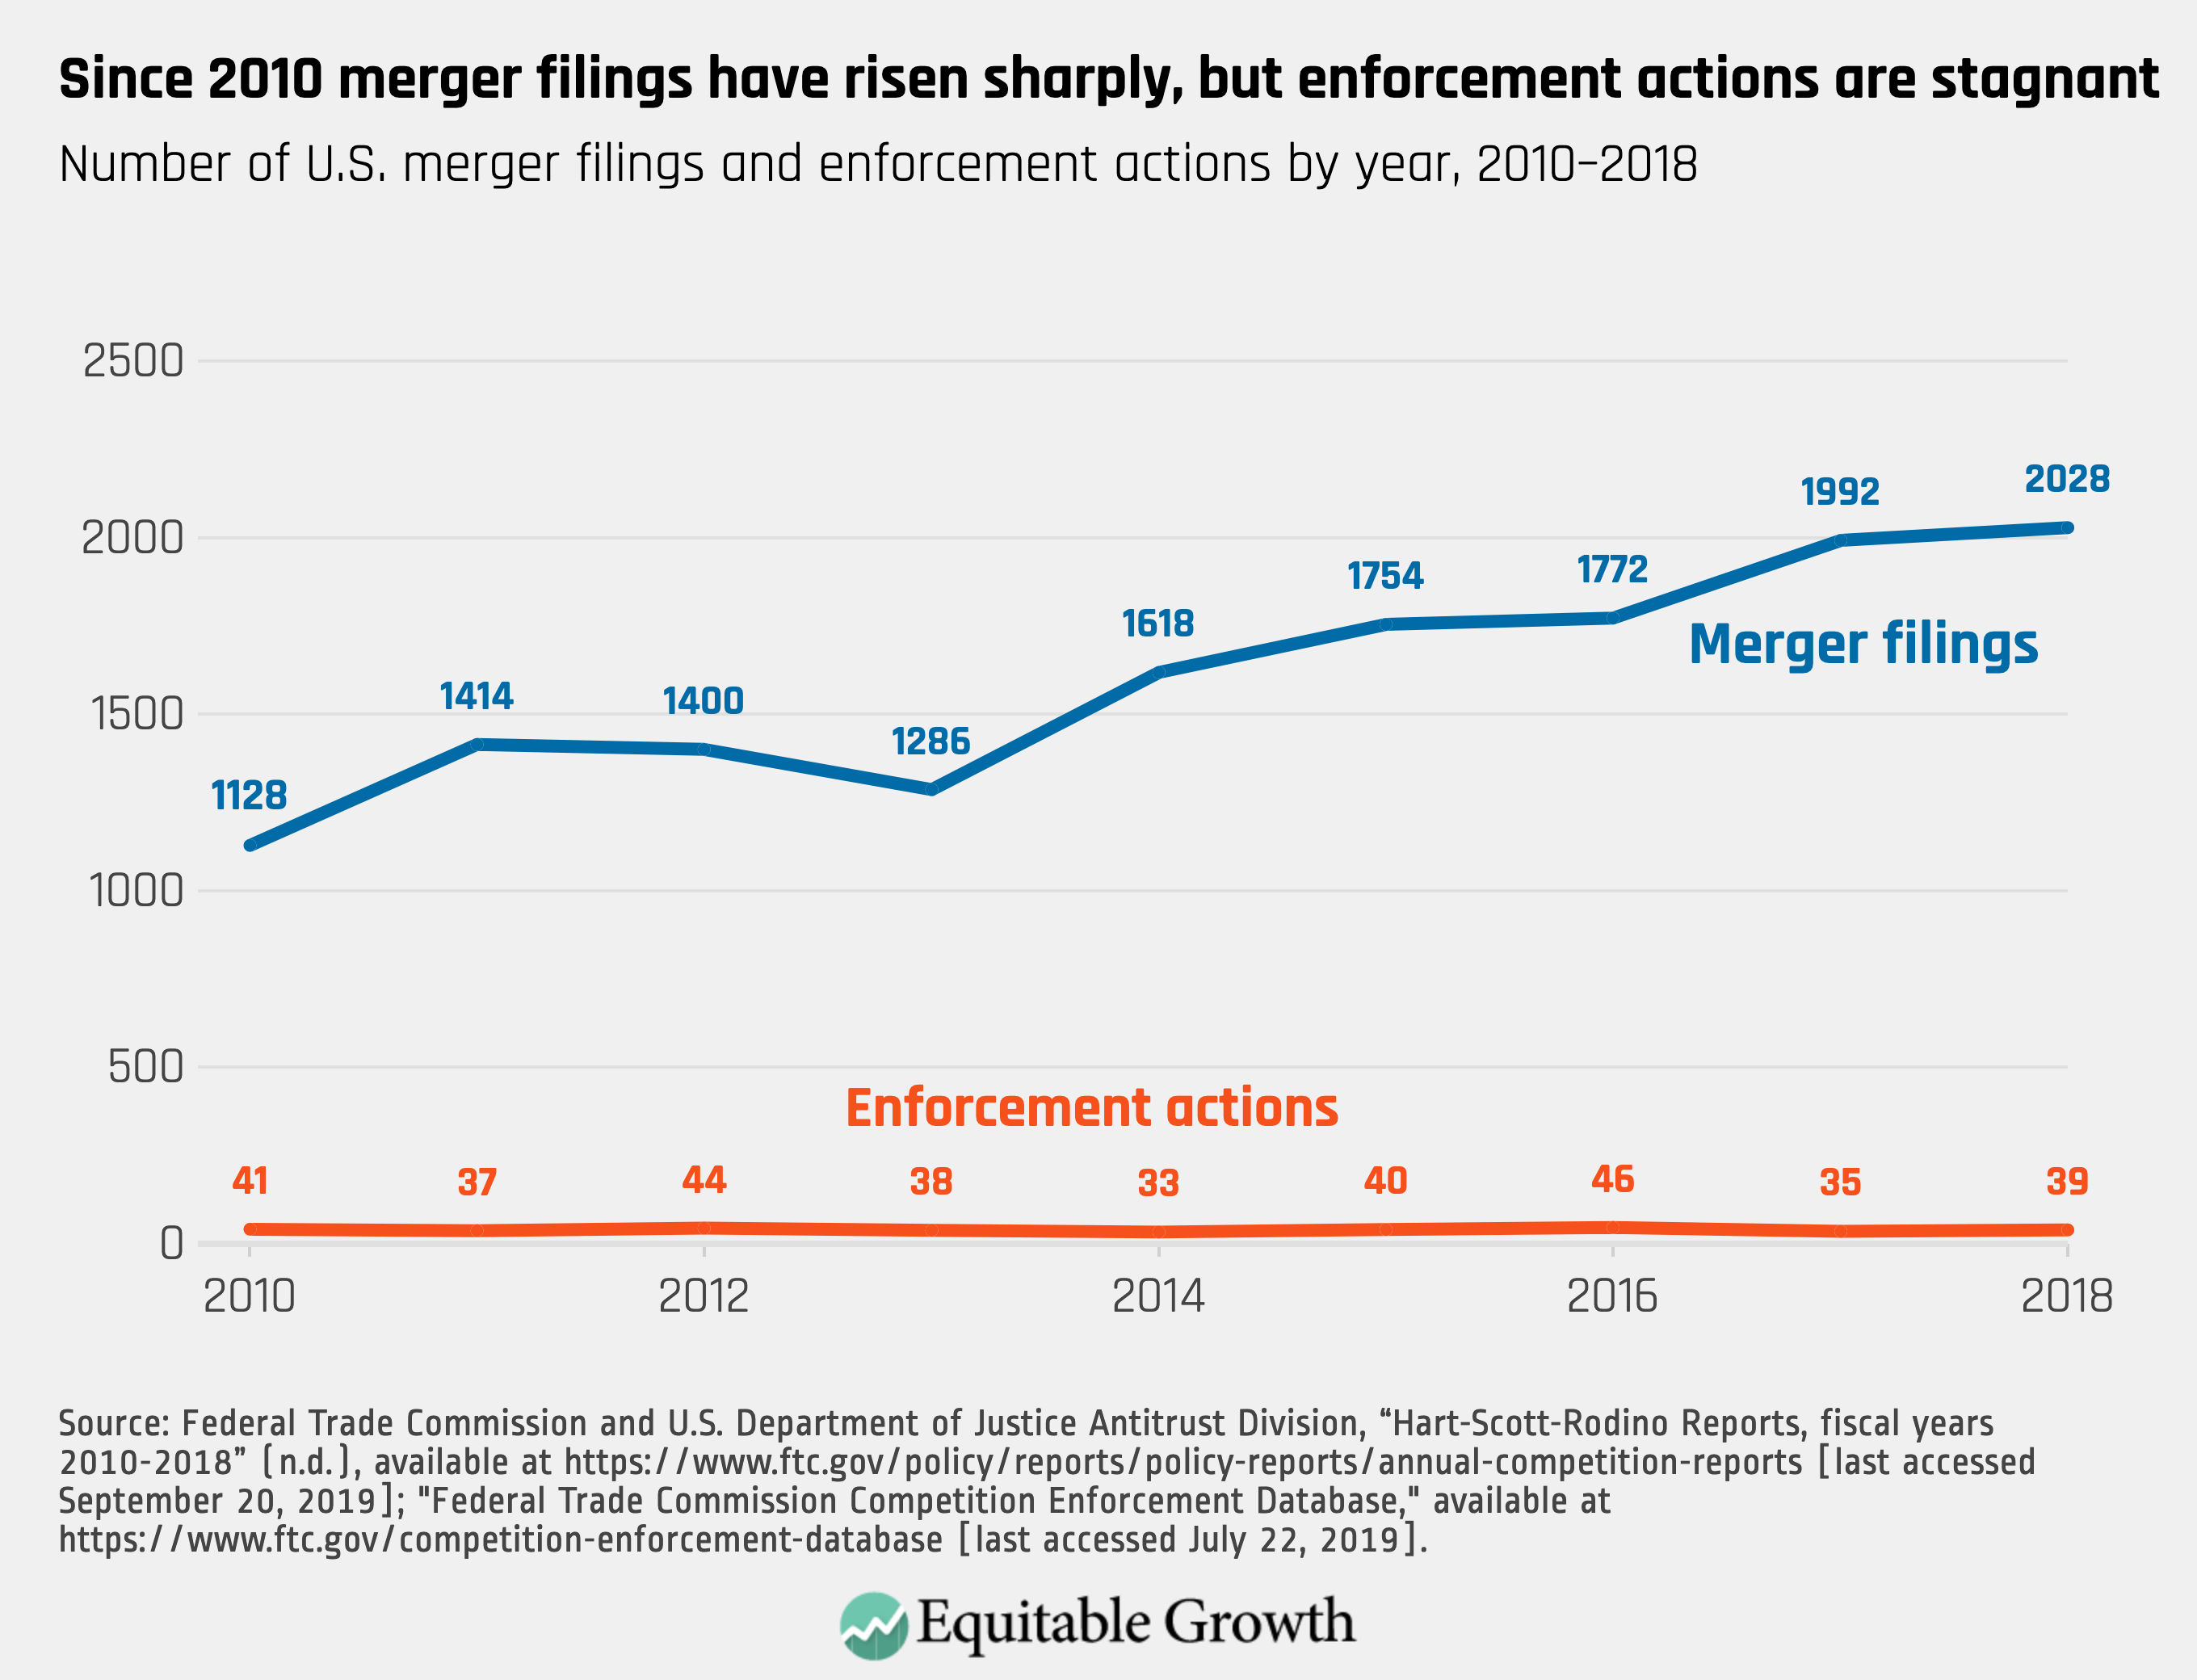
That correlation begins to weaken in 2001. Consistent with the findings of Baker and Shapiro, enforcement actions increased as filings fell in 2008. In 2010, a merger wave begins. There were almost 80 percent more merger filings in 2018 than in 2010, but the number of enforcement actions have been constant, fluctuating between the mid-30s and mid-40s.14 (See Figure 9.)
Figure 9
Implications of merger enforcement statistics
These statistics, by themselves, shed little light on whether merger enforcement is adequate, too lenient, or too aggressive. Also, the numbers say nothing about whether the right cases are being challenged. The statistics, however, suggest a number of potential lines of inquiry.
First, historically, merger enforcement has generally reflected trends in merger filings, but in the current merger wave beginning in 2010, enforcement has been relatively flat. Is this a meaningful trend? If so, does it reflect a view that a smaller percentage of mergers are anticompetitive or that the agencies lack the capacity for more comprehensive enforcement? Do the agencies believe they are facing a major merger wave, and do they have procedures and plans to address the merger wave, given the current level of funding?
It is tempting to ask whether there are mergers that the enforcers would have challenged if they had had more resources. It is a deceptively simple question because the impact of resource limitations and opportunity costs will be less obvious. The agency may raise the bar on what types of mergers it investigates. Or those limitations may make challenges seem more difficult, leading to weaker settlements or fewer challenges.
At the same time, a growing body of research, documented in Equitable Growth’s literature review, suggests whether viewed overall,15 in specific industries,16 or specific case studies,17 consolidation in many industries has led to anticompetitive effects. Has this literature affected the agencies’ views on whether they should be more aggressive? If not, why not?
Civil nonmerger enforcement
Civil nonmerger enforcement refers to a broad range of conduct. It includes: massive cases to break up monopolies such as United States v. AT&T Co. and United States. v. Microsoft Corp.; the Federal Trade Commission’s cases challenging pharmaceutical patent settlements, in which the branded firm pays the generic company not to sell its product (reverse-payment or pay-for-delay cases); cases against exclusionary agreements or conduct that excludes competitors; rules of commercial associations such as multiple listing agencies in real estate; or professional associations such as singing teachers, organ players, or horse breeders; among others.
Descriptive statistics
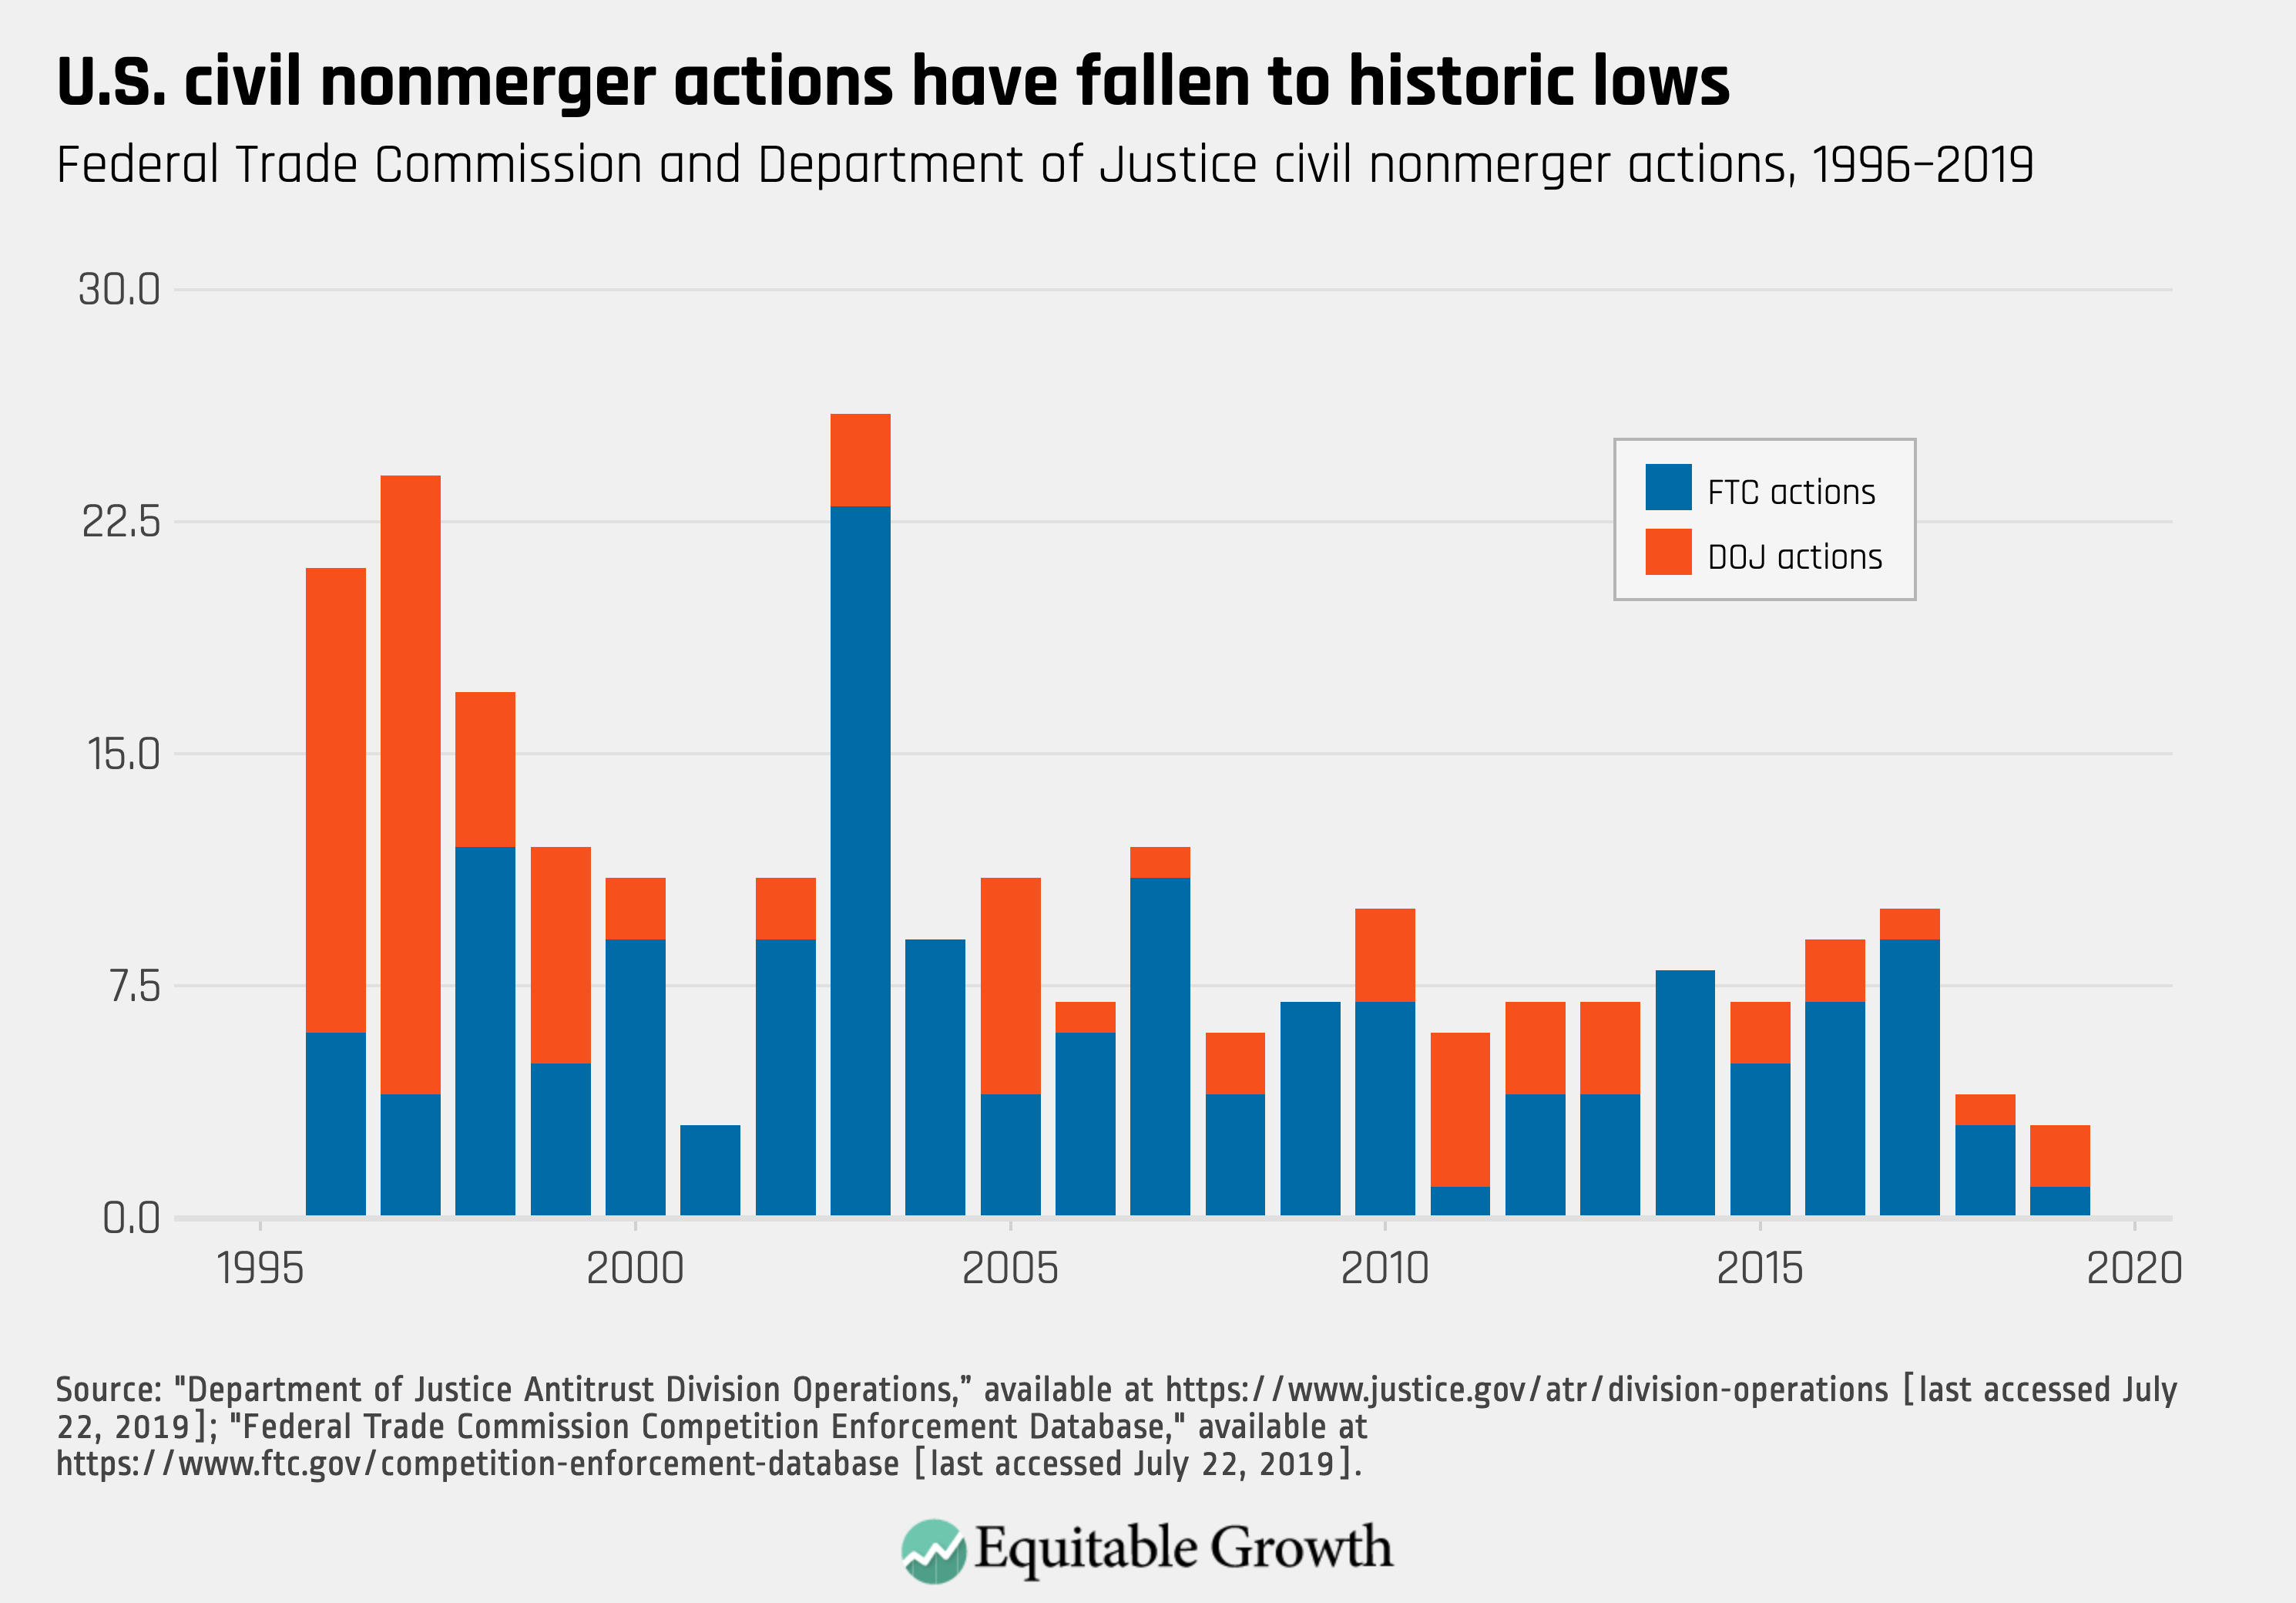
Although civil nonmerger enforcement covers a broad range of conduct, it represents the smallest area of federal antitrust enforcement. 2018 was an historically low year for civil nonmerger enforcement, and 2019 also appears to be low. More generally, civil nonmerger enforcement since 2008 is somewhat lower than during either of the previous decades. On average, the agencies brought 10.8 nonmerger cases a year between 1999 and 2008 and 7.5 cases a year between 2009 and 2018.18 (See Figure 10.)
Figure 10
At the same time, particularly in civil nonmerger cases, numbers do not tell the entire story. The U.S. Department of Justice brought conduct cases against Apple Inc. over e-books and American Express over its restrictions regarding competition. The Federal Trade Commission is suing Qualcomm Inc. in a major monopolization case and has brought substantial conduct cases in the pharmaceutical industry. The FTC brings almost twice as many civil nonmerger cases as the Department of Justice’s Antitrust Division, which could simply reflect that the Antitrust Division has sole authority to bring criminal cases.
Implication of descriptive statistics
Since 1996, 2018 and, it appears, 2019 are two of the three lowest years in nonmerger antitrust enforcement. And, more generally, between 1996 and 2007, the two agencies frequently brought 10 or more civil nonmerger cases a year (8 of 12 times) but have brought 10 cases annually only twice in the subsequent 12 years.
What accounts for this change? Why does the Department of Justice tend to bring fewer conduct cases than the Federal Trade Commission?
The Justice Department in its own operation workload statistics reports lists only one monopolization case since 2000. That may understate the number of cases challenging unilateral and exclusionary conduct, but monopolization cases have been rare. Does this reflect that monopolization is not a problem in the U.S. economy, or has the development of legal doctrine narrowing the scope of the antitrust laws in such areas as refusal to deal, exclusive dealing, and predatory conduct led to underenforcement in this area?
Are the agencies shifting resources from nonmerger to merger review? If so, how are they making those decisions? Is there any basis to believe that demands created by merger activity, including the litigation of large mergers, causes the agencies to shift personnel and resources from conduct investigation, which tend not to have hard deadlines, to litigation or time-sensitive review of mergers?
Antitrust resources
While enforcement statistics give one view of the federal enforcers’ activity, appropriations measure their resources. The picture here is clear: Appropriations are historically low, an effect of budget austerity and sequestration. When testifying before Congress, agency leadership often claims that they can simply do more with less. But, at some point, they simply do less with less.
Merely increasing appropriations, however, does not guarantee either more or more effective enforcement. Former FTC Bureau of Competition Director Debbie Feinstein explained that she would have used additional resources to fund economic studies, not enforcement.19 If enforcers do not see a need for more enforcement (or different enforcement priorities), larger budgets will have little impact. At the same time, those who argue that changing leadership and staff will dramatically alter antitrust enforcement are also wrong.
Nor do these statistics prove that resource limitations are the primary hurdle to more active antitrust enforcement. The current judiciary, particularly with the elevation of both Supreme Court Justices Neil Gorsuch and Brett Kavanaugh, is more likely to be worried about overly expansive antitrust enforcement than underenforcement. Over the past 40 years, courts have, with few exceptions, limited the scope of antitrust law, raised evidentiary burdens, and raised the cost and complexity of antitrust enforcement.
Finally, the amount of resources devoted to antitrust enforcement is separate from who receives them. Arguably, since 2000, state attorneys general have been more aggressive than their federal counterparts. The New York state attorney general successfully obtained a preliminary injunction and prevented an anticompetitive strategy, known as product hopping, on Namenda, a blockbuster Alzheimer drug, that would have increased prescription drug costs by billions of dollars.20 And a multistate taskforce of state attorneys general has brought a case alleging a multiproduct, multicompany price-fixing conspiracy among generic drug manufacturers.
Similarly, a number of state attorneys general have sued to block T-Mobile US, Inc.’s proposed acquisition of Sprint Corp., while, according to reports, the U.S. Department of Justice’s Antitrust Division spent months to find a settlement that would allow the merger. And state attorneys general have announced a series of multiple-state investigations of Google and Facebook.
In other words, Congress could increase antitrust resources by designating that some or all of the additional funds go to state attorneys general. There are a number of models and precedent for this approach. For example, the Edward Byrne Memorial Justice Assistance Grant Program and the COPS Hiring Program already exist to bolster local criminal law enforcement. They could provide a model for a similar program for antitrust enforcement.21
Descriptive statistics
Appropriations, in real terms, is one measure of resources that antitrust enforcers receive, which accounts for the value change in the actual costs of enforcement (salaries, discovery, and expert witnesses, among other things). A second way to measure resources is to compare the change in resources to the change in the size of the economy. As the U.S. economy grows, the need for resources to police the economy likely grows as well (although it is not necessarily a one-to-one correspondence). If a city were to double in size, for example, substantially more police would be needed to have the same level of law enforcement. Either measure may overstate the value of funding for antitrust enforcement because neither can account for the increased cost of litigation based on the higher evidentiary and legal burdens that antitrust enforcers uniquely face.
Yet by either measure, the results are striking and show the impact of budget austerity and sequestration. In real terms, appropriations are 18 percent lower than in 2010. The antitrust enforcement agencies had slightly fewer resources in 2018 ($471 million) as they did nearly 20 years earlier, in 2001 ($491 million). (See Figure 11.)
Figure 11
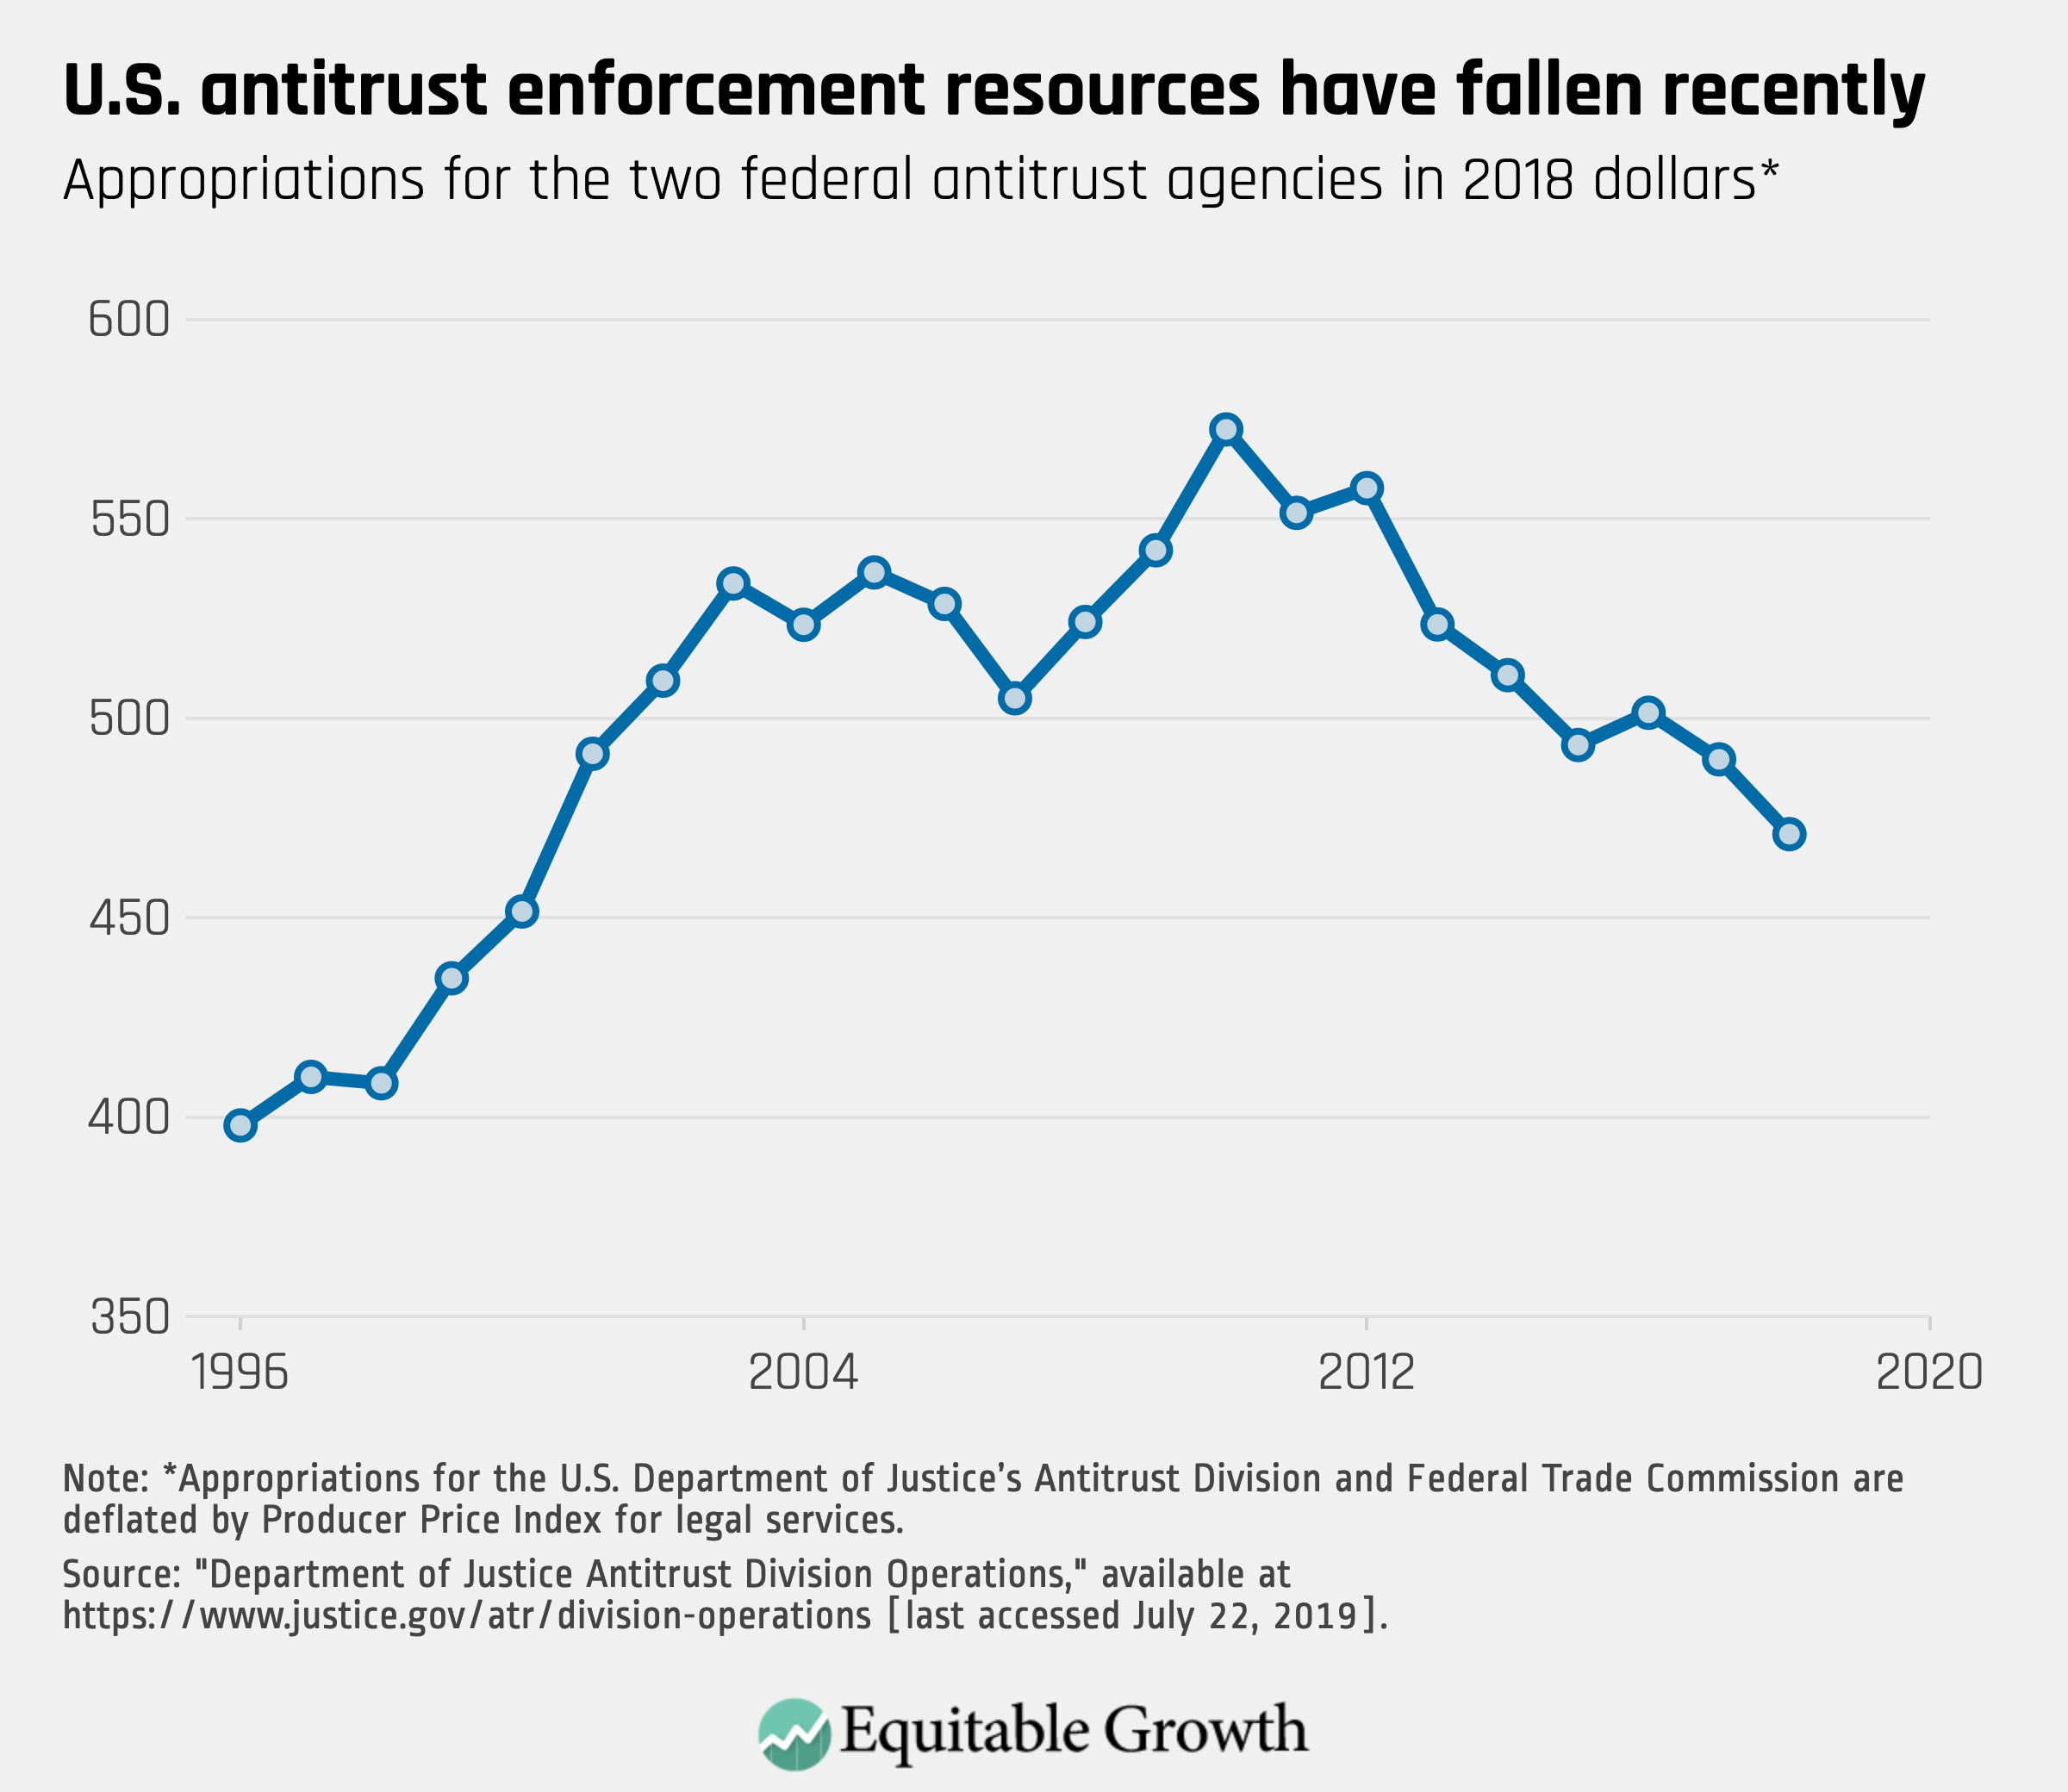
The data presented in Figure 11 deflates the nominal appropriations level using the producer price index for legal services. Antitrust enforcement is fundamentally a legal activity: investigating, sending subpoenas, reviewing documents, developing expert testimony, negotiating settlements, and litigating cases. The Legal Service Producer Price Index, which measures changes in the cost of legal services, is the best proxy for the spending power of the appropriations the agencies receive from Congress. An alternative index is the Government Consumption Expenditures and Gross Investment Index, which measures the goods and services that the government purchases and which is less focused on the cost of litigation. By that metric, antitrust resources are 7 percent lower than in 2010, and the agencies have the same level of resources they had in 2009.
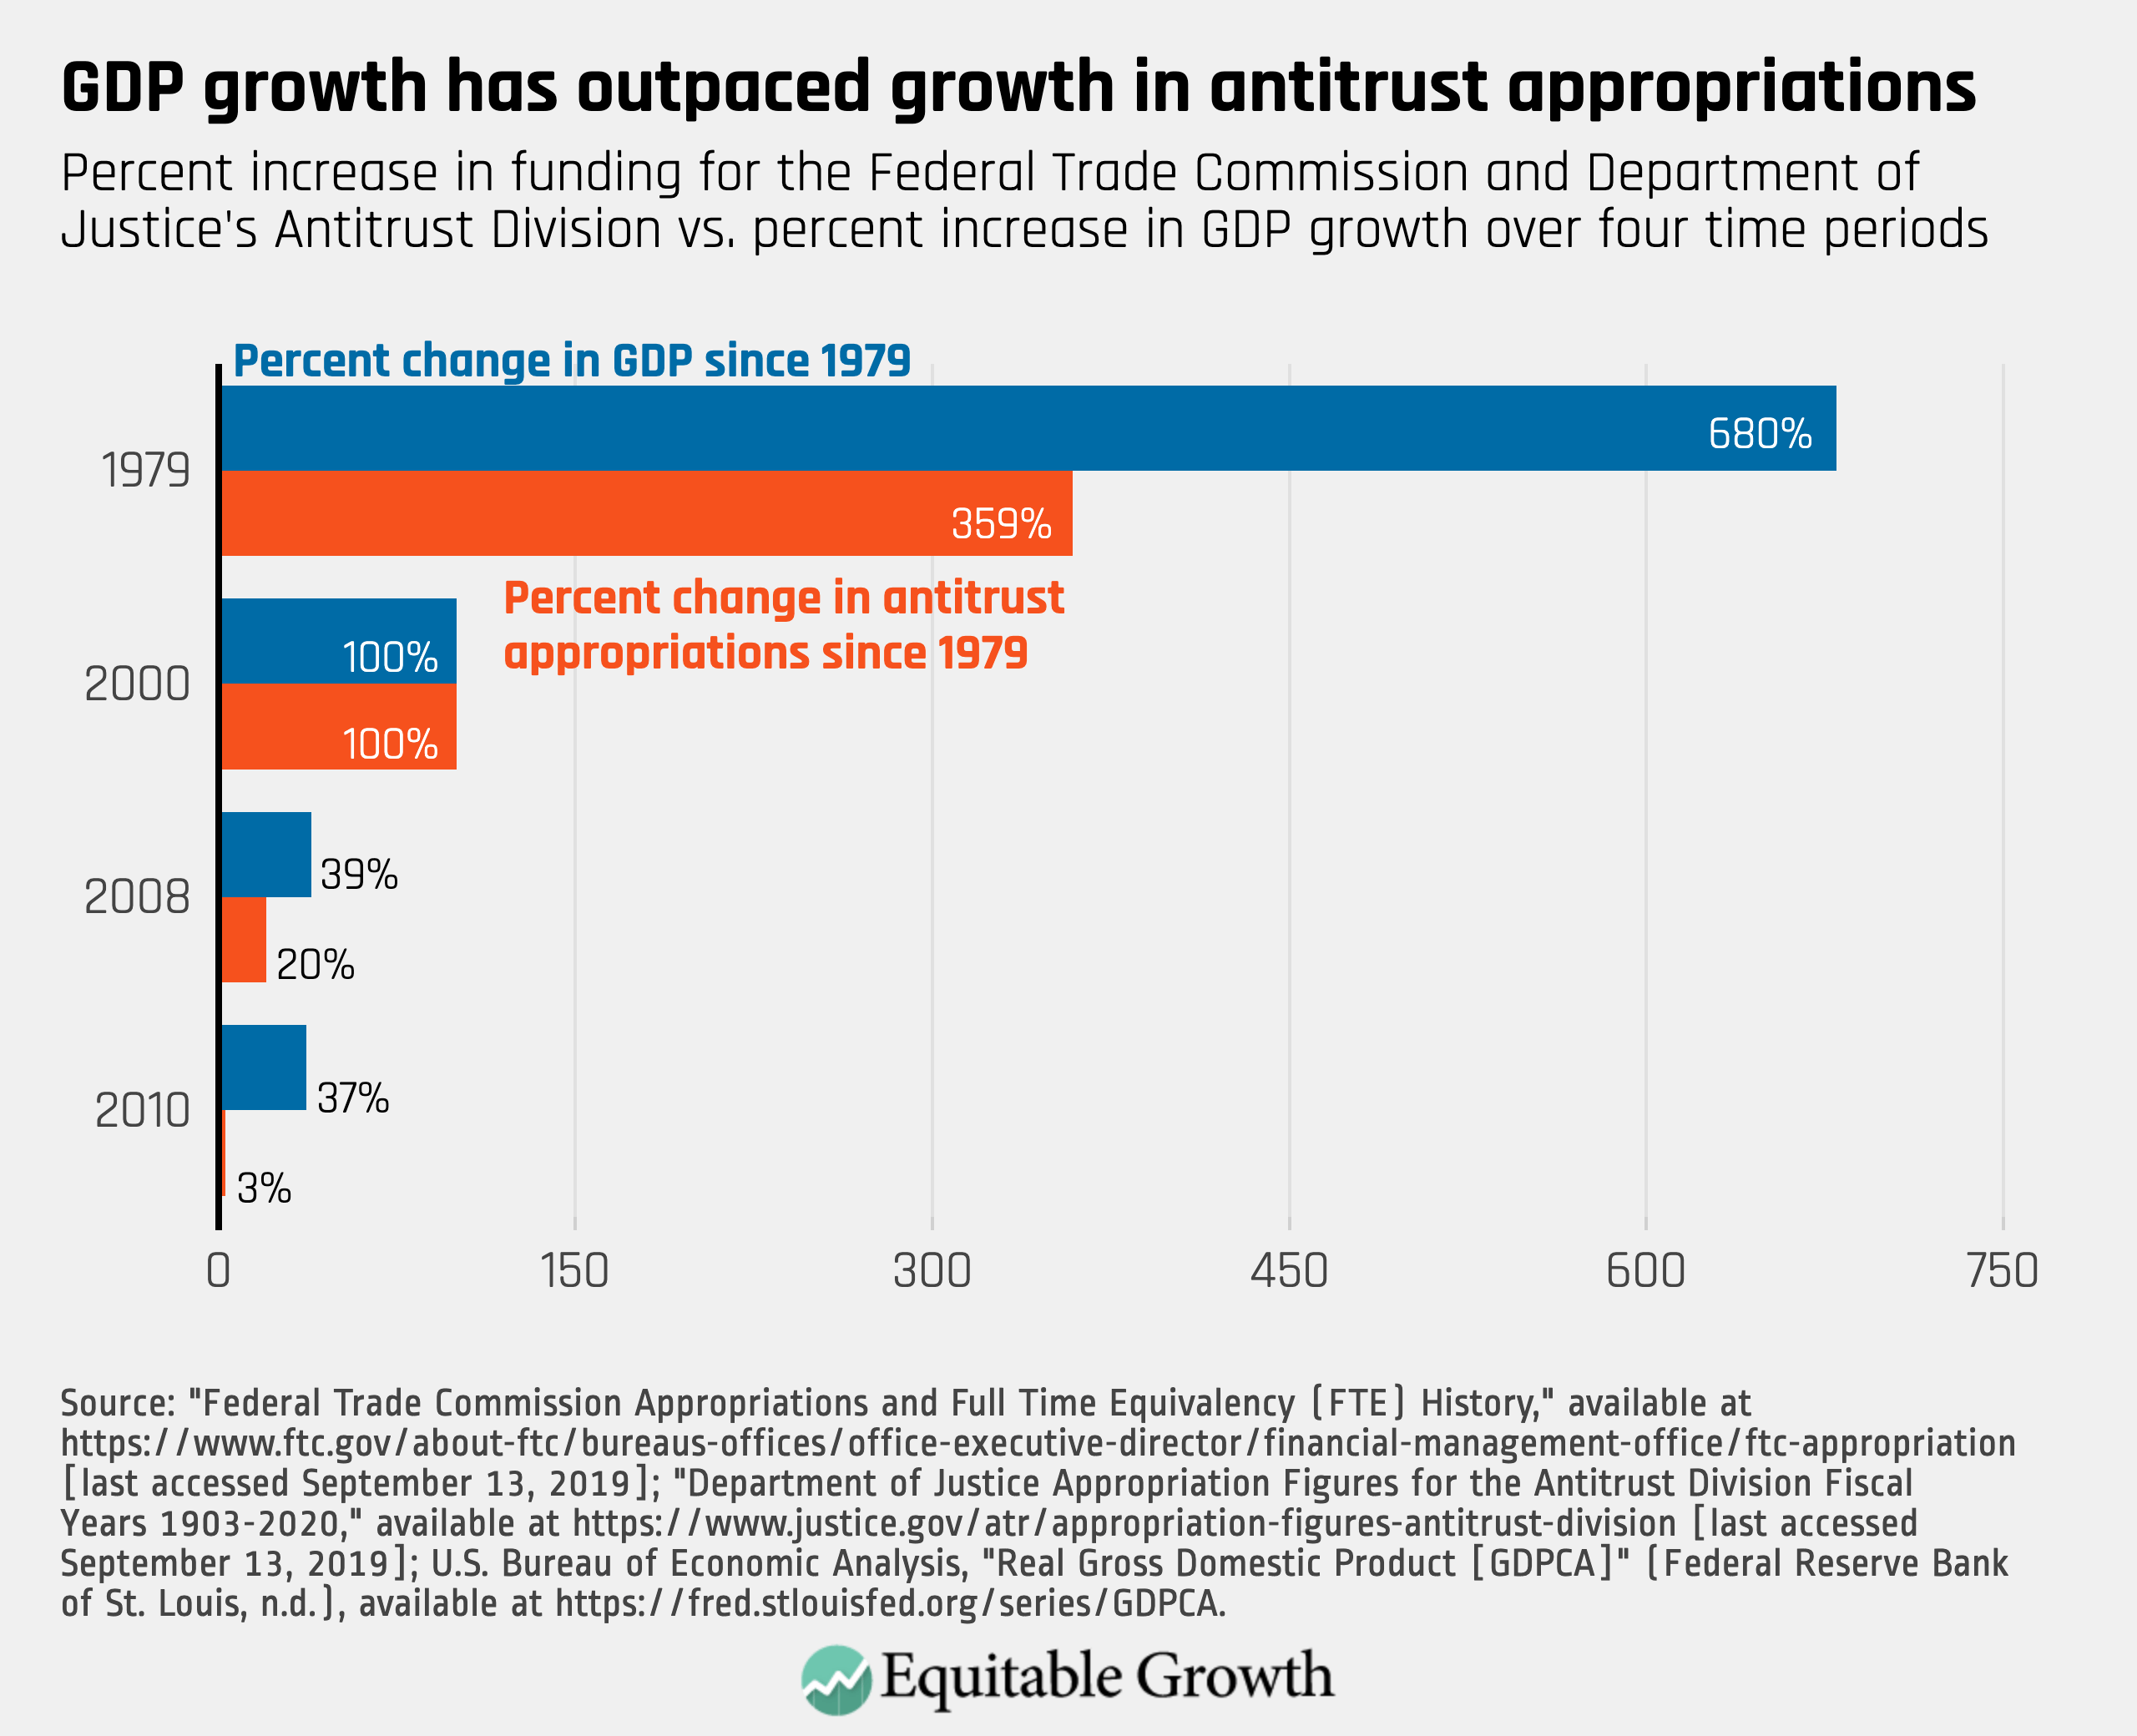
Comparing appropriations and Gross Domestic Product paints a similar picture. Since 2010, GDP has increased 37 percent, but appropriations for the Antitrust Division at the Justice Department and the FTC have increased only 3 percent. Compared to 2008, the economy has grown twice as fast as antitrust appropriations. Relative to 2000, however, the increases in both GDP and appropriations are the same. Compared to 1979, during a peak era of antitrust enforcement, GDP growth (680 percent) has outstripped the growth in antitrust resources (359 percent). (See Figure 12.)
Figure 12
Implications of descriptive statistics
The appropriations data alone do not answer whether Congress is appropriating too little, enough, or too many resources to antitrust enforcement.
In 2000, during the height of the dot-com boom, the agencies brought 91 antitrust actions (80 merger and 11 nonmerger). Today, both the agencies’ budgets and the U.S. economy have doubled. Total enforcement actions have varied at around 50. If needed, could the government bring an additional 30 to 40 civil antitrust enforcement actions? How many additional merger and nonmerger cases could the government bring with the current resource levels?
Federal antitrust enforcement often addresses local markets (supermarkets, healthcare, and coarse aggregate, which is used for building roads). Should Congress be thinking about ways to bolster state attorneys general antitrust enforcement?
Merger filing-fee structure
Since the passage of the Hart-Scott-Rodino Act in 1976, companies pay a fee when they file their transactions. Justice’s Antitrust Division and the Federal Trade Commission split the fees, which account for a substantial portion of antitrust appropriations (between 63 percent and 100 percent).22 In 2000, Congress created a three-tier fee structure based on the size of the transaction. There is no reporting or fee required for deals below $50 million. For deals between $50 million and $100 million, the fee is $45,000. For deals between $100 million and $500 million, the fee is $125,000. For deals of $500 million or more, the fee is $280,000. By statute, the thresholds adjust based on Gross National Product, but not the fees.23
Descriptive statistics
Little analysis of the fees and their distributional effects have occurred since Congress passed those amendments. In 2017, Sen. Amy Klobuchar (D-MN) asked the Federal Trade Commission for a breakdown of filings with three additional tiers: deals above $1 billion, deals above $2 billion, and deals above $5 billion. The Federal Trade Commission provided data on both the filings in each category and the number of filings that lead to a second request, which is a reasonable estimate of investigations requiring substantial resources.24 (See Table 1.)
Table 1
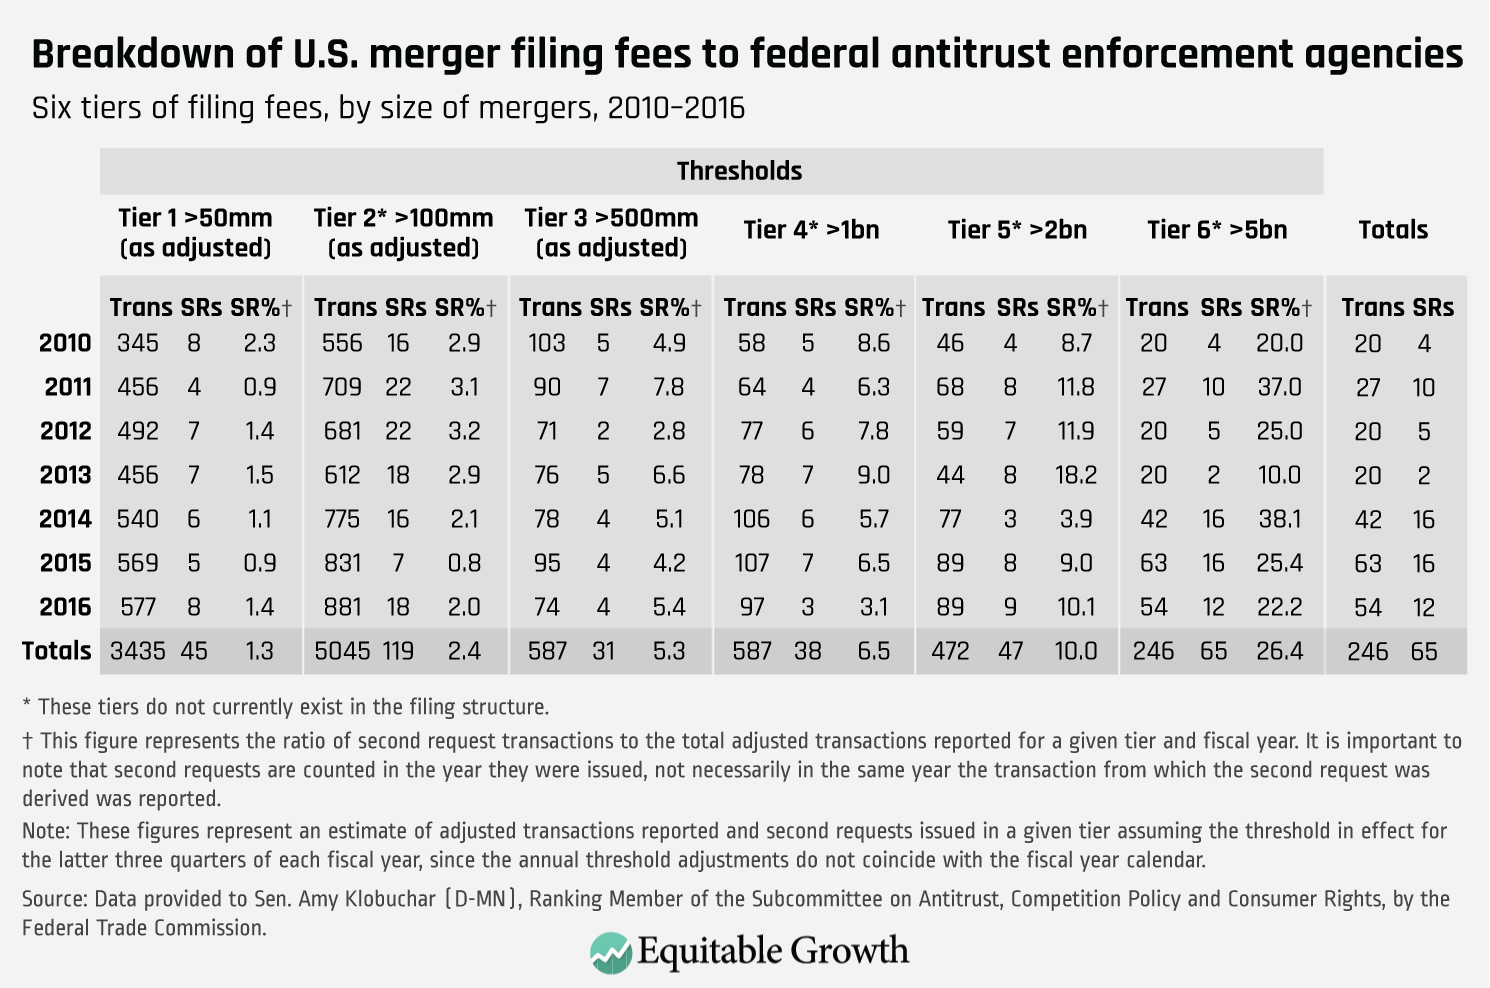
The data suggests that deals requiring the greatest resources to investigate are accounting for a smaller amount of the Hart-Scott-Rodino fees. First, although tier 2 deals (those subject to the $125,000 fee) account for almost half of the fees generated, they account for only one-third of second requests. At the same time, deals that are more than $5 billion generated only 5 percent of the fees but nearly one-fifth of all second requests (18.2 percent).
From 2014 through 2016, the trend is even more pronounced. Less than a quarter of second requests were for deals in tier 2. But tier 2 deals accounted for nearly half of the fees collected. Meanwhile, almost a third of all second requests were for deals of more than $5 billion (tier 6), but tier 6 deals of more than $5 billion generated only 7 percent of the total fees.25 (See Figure 13.)
Figure 13
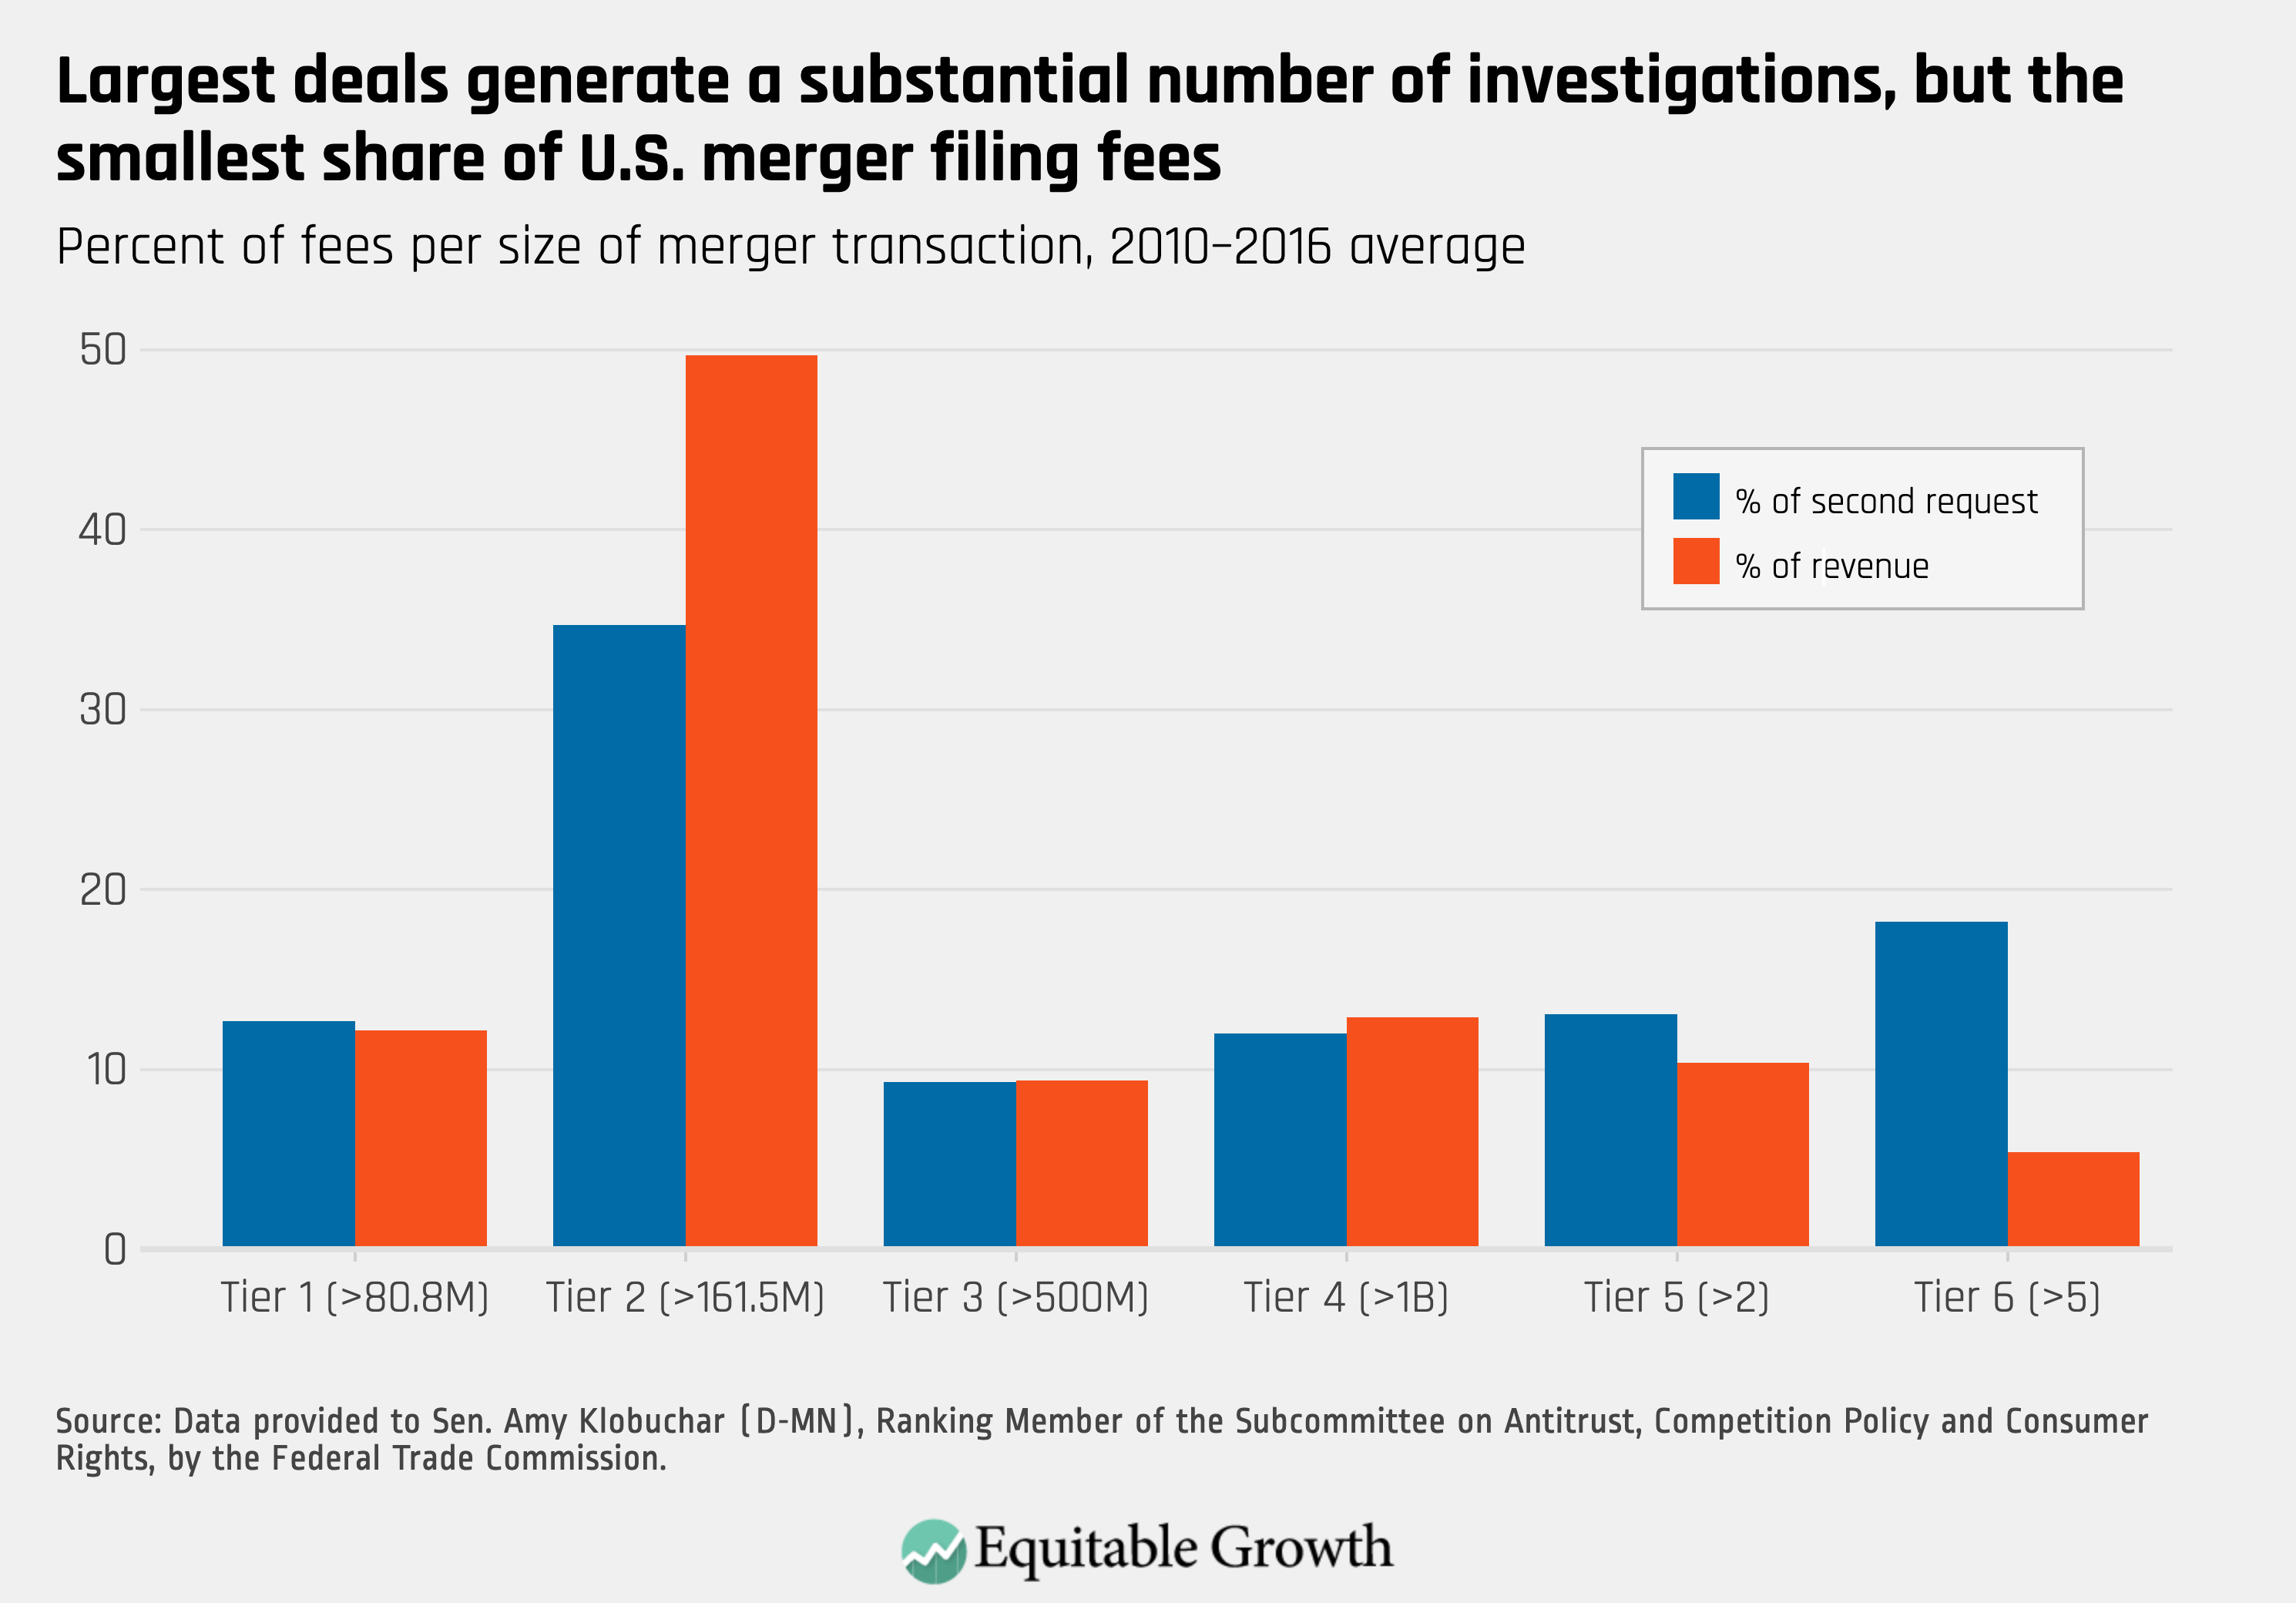
Potentially, this metric understates the disparity. If larger deals are more complex and require more resources, then simply comparing the number of second requests understates their impact on resources. But if a large deal involves only a minimal overlap (the two companies only compete in a single small market), then comparing the number of second requests would overstate the impact on agency resources.
Implications of the filing fee data
After nearly five decades, reassessing the Hart-Scott-Rodino Act fee structure makes sense. The Merger Filing Fee Modernization Act of 2019 recently introduced by Sens. Amy Klobuchar (D-MN) and Charles Grassley (R-IA) would address these anomalies.
Based on these statistics, unless Congress updates the fee structure, midsize transactions are paying the bulk of the fees, but the largest transactions are generating a disproportionate share of the merger investigations. Should Congress readjust the fees?
The cost of discovery and litigation continually increases. To reflect that reality, should merger filing fees also adjust by a reasonable measure of inflation?
About the author
Michael Kades is the director for Markets and Competition Policy at the Washington Center for Equitable Growth. His research focuses on competition and antitrust enforcement, with an emphasis on consumers, wages, equality, and innovation. Prior to joining Equitable Growth, Kades worked as antitrust counsel for Sen. Amy Klobuchar (D-MN), the ranking member on the Senate Judiciary Subcommittee on Antitrust, Competition Policy and Consumer Rights, where he led efforts to reform antitrust laws. Previously, he spent 20 years investigating and litigating some of the most significant antitrust actions as an attorney at the Federal Trade Commission. During his time at the FTC, he was an attorney advisor to Chairman Jon Leibowitz. Kades has testified before Congress and the Federal Trade Commission, and has been cited by The New York Times, The Washington Post, and other media outlets on antitrust enforcement and competition policy matters.
End Notes
1. Fiona Scott Morton, “Modern U.S. antitrust theory and evidence amid rising concerns of market power and its effects” (Washington: Washington Center for Equitable Growth, 2019), available at https://equitablegrowth.org/research-paper/modern-u-s-antitrust-theory-and-evidence-amid-rising-concerns-of-market-power-and-its-effects/.
2. Hannah Buxbaum, “The Private Attorney General in a Global Age: Public Interests in Private International Antitrust Litigation,” Yale Journal of International Law 26 (1) (2001).
3. Scott D. Hammond, “The Evolution of Criminal Antitrust Enforcement Over the Last Two Decades” (Washington: U.S. Department of Justice, 2010), available at https://www.justice.gov/atr/file/518241/download.
4. “Leniency Program,” available at https://www.justice.gov/atr/leniency-program (last accessed September 15, 2019).
5. U.S. Department of Justice, “Antitrust Division Announces New Policy to Incentivize Corporate Compliance,” Press release, July 11, 2019, available at https://www.justice.gov/opa/pr/antitrust-division-announces-new-policy-incentivize-corporate-compliance.
6. The charts covering criminal enforcers (Figures 1 to 6) all cover the 1990s to capture the impact of the Department of Justice’s change to its leniency policy in 1993.
7. Memo from Deputy Attorney General Sally Yates to various Department of Justice Assistant Attorney Generals, “Individual Accountability for Corporate Wrongdoing,” September 9, 2015, available at https://www.justice.gov/archives/dag/file/769036/download.
8. The total amount of corporate fines appears to have been unaffected. (See Figure 3).
9. Jonathan B. Baker and Carl Shapiro, “Response: Evaluating Merger Enforcement During the Obama Administration,” Stanford Law Review (August 2012), available at https://www.stanfordlawreview.org/online/evaluating-merger-enforcement-during-the-obama-administration/.
10. Daniel A. Crane, “Has the Obama Justice Department Reinvigorated Antitrust Enforcement?,” Stanford Law Review (July 2012), available at https://www.stanfordlawreview.org/online/has-the-obama-justice-department-reinvigorated-antitrust-enforcement/.
11. For those interested, Baker and Shapiro’s reply can be found at Baker and Shapiro, “Response: Evaluating Merger Enforcement During the Obama Administration.”
12. Figure 7 begins in 2001 because Congress changed the filing thresholds for 2001. As a result, far fewer deals were required to file under the Hart-Scott-Rodino Act, so simply comparing enforcement rates during the old filing and current filing systems, without adjustment, would not be meaningful. In the Hart-Scott-Rodino report, both agencies include a transaction that the parties abandon after being notified of the agencies antitrust concerns as an enforcement action.
13. Figure 8 goes back to 1990. Because it is showing the correlation between filings and enforcement action for a year, the change in filing thresholds has a less distortionary effect.
14. A significant number of filings such as investor stock purchases are not mergers as typically understood. Those transactions and others receive early termination, which means they do not usually require that the agencies to expend significant resources reviewing them. A disproportionate increase in filings that receive early termination could suggest that the increase in total filings does not indicate a significant increase in the agencies’ workload. Merger filings not receiving early termination, however, increased 82 percent (from 424 to 772) between 2010 and 2017, similar to the increase in total filings. Federal Trade Commission and Department of Justice Annual Hart-Scott-Rodino Report 2017, available at https://www.ftc.gov/system/files/documents/reports/federal-trade-commission-bureau-competition-department-justice-antitrust-division-hart-scott-rodino/p110014_fy_2017_hsr_report_c.pdf (last accessed September 16, 2019).
15. Orley Ashenfelter, Daniel Hosken, and Matthew C. Weinberg, “Did Robert Bork Understate the Competitive Impact of Mergers? Evidence from Consummated Mergers,” Journal of Law & Economics 57 (S3) (2014); Bruce A. Blonigen and Justin R. Pierce, “Evidence for the Effects of Mergers on Market Power and Efficiency.” Finance and Economics Discussion Series 2016-082 (Board of Governors of the Federal Reserve System, 2016), available at https://doi.org/10.17016/FEDS.2016.082; Orley Ashenfelter and Daniel Hosken, “The Effect of Mergers on Consumer Prices: Evidence from Five Mergers on the Enforcement Margin,” Journal of Law & Economics 53 (3) (2010): 417–466. Note, these can be found in Fiona Scott Morton, “Modern U.S. antitrust theory and evidence amid rising concerns of market power and its effects” (Washington: Washington Center for Equitable Growth, 2019), available at https://equitablegrowth.org/research-paper/modern-u-s-antitrust-theory-and-evidence-amid-rising-concerns-of-market-power-and-its-effects/.
16. Zack Cooper and others, “The Price Ain’t Right? Hospital Prices and Health Spending on the Privately Insured,” The Quarterly Journal of Economics 134 (1) (2019): 51–107; Leemore Dafny, Mark Duggan, and Subramaniam Ramanarayanan, “Paying a Premium on Your Premium? Consolidation in the US Health Insurance Industry,” The American Economic Review 102 (2) (2012): 1161–1185. Note, these can be found in Scott Morton, “Modern U.S. antitrust theory and evidence amid rising concerns of market power and its effects.”
17. Nathan H. Miller and Matthew C. Weinberg, “Understanding the Price Effects of the MillerCoors Joint Venture,” Econometrica 85 (6) (2017): 1763–1791. Note, these can be found in Scott Morton, “Modern U.S. antitrust theory and evidence amid rising concerns of market power and its effects.”
18. Figure 10 begins in 1996 because that is the earliest date the Federal Trade Commission publishes data on its enforcement actions.
19. Federal Trade Commission, “Competition and Consumer Protection in the 21st Century,” hearings before the Federal Trade Commission, September 21, 2018, available at https://www.ftc.gov/system/files/documents/public_events/1408208/ftc_hearings_session_2_transcript_9-21-18.pdf.
20. Andrew Pollack, “Judge Rules Drug Maker Can’t Shelve Old Pill,” The New York Times, December 11, 2014, available at https://www.nytimes.com/2014/12/12/business/judge-says-actavis-must-continue-to-sell-namenda-a-drug-for-alzheimers-disease.html.
21. “Edward Byrne Memorial Justice Grant Program Assistant (JAG) Grant Program,” available at https://www.bja.gov/jag/index.html (last accessed September 15, 2019); “COPS Hiring Program (CHP),” available at https://cops.usdoj.gov/chp (last accessed September 15, 2019).
22. “Appropriation Figures For The Antitrust Division,” available at https://www.justice.gov/atr/appropriation-figures-antitrust-division (last accessed September 15, 2019).
23. For example, as of March 7, 2019, the $45,000 fee applied to deals between $90 million and $180 million; the $125,000 fee applied to deals between $180 million and $899.8 million. For deals of $899.9 million and higher, the fee was $280,000. Premerger Notification Office Staff, “HSR threshold adjustments and reportability for 2019,” Competition Matters blog, March 7, 2019, available at https://www.ftc.gov/news-events/blogs/competition-matters/2019/03/hsr-threshold-adjustments-reportability-2019.
24. Under the Hart-Scott-Rodino Act, once the parties file their notice of the transaction, they may not close for 30 days. The agencies, however, may request additional information, a second request, that triggers a second waiting period. If so, the parties cannot close the transaction until 30 days after complying with the requested information. See 15 USC 18a and Premerger Notification Office Staff, “Getting in Sync with HSR Timing Considerations,” Competition Matters blog, August 31, 2017, available at https://www.ftc.gov/news-events/blogs/competition-matters/2017/08/getting-sync-hsr-timing-considerations.
25. Estimated revenue is calculated by multiplying the number of deals in each tier by the fee. The fee for tier 1 is $45,000. The fee for tier 2 is $125,000. As reported in the chart, some deals in tier 3 would pay the $125,000 fee and others would pay a $280,000 fee. For tier 3, an average rate of $202,500 is used. All deals in tiers 4 to 6 would pay the $280,000 fee.