
Key takeaways
- The federal budget debate is filtered through claims about spending and revenue levels, but the debate is really about whether the size of the federal budget should be allowed to change with changing circumstances. The real argument is more about a fundamental view of the world. The best way to think about the debate over the federal budget is in terms of opposing fundamental worldviews:
- The first worldview holds that there are generally appropriate levels of federal spending and federal taxation, bounded by modern historical experience. Structural federal spending should stay roughly in line with what the U.S. government has historically spent, regardless of circumstances.
- The second worldview takes a very different conceptual approach: Federal spending and revenue are not tied to historical averages or norms but are instead the products of specific policy choices that have long-term consequences that can and do change when demands and underlying dynamics change.
- Federal spending levels are indeed higher than they used to be, driven almost entirely by an aging population and higher economy-wide health care costs. But such increases were foreseen and planned for at the turn of the 20th century and would not have translated into higher deficits or debt had revenue levels of that time been maintained.
- In practice, insisting that federal budget levels should match historical averages has resulted in lower taxes but higher deficits, as policymakers over the past 25 years prioritized returning revenue levels, but not spending levels, to a historical average
- What this means for growth. Federal policymakers really do face a large structural budget gap. If they approach this problem by insisting that spending levels must be returned to their post-WWII historical average, they will need to either make massive cuts to Social Security, Medicare, and Medicaid or even more massive cuts to everything else in the federal budget, including investments in our nation’s economic future. Alternatively, policymakers can recognize that federal spending and revenue are not now nor have they ever been fixed at certain levels. A budget that responds to current needs—such as an older U.S. population—while also investing in our future economy will require higher revenue than the government collected before the retirement of the baby-boom generation.
Overview

Interest rates on the national debt have recently crept up to levels that the U.S. government and the American people haven’t experienced in several decades. This is a potentially concerning trend and it has understandably pushed the federal budget—and especially the persistent and large budget deficit—back into the news. And whenever the budget deficit is in the news, arguments ensue about who is to blame with the debate framed as either a spending versus revenue problem or a tax-cut problem.
Certainly, there is plenty of blame to go around. And there are good reasons to want to investigate and understand the policies and the decisions that brought us to this point, if for no other reason than to learn from those experiences. But oftentimes, this debate about our large federal budget deficit obscures a disagreement much deeper than what a clash over differing sets of numbers might suggest. The debate is filtered through claims about spending and revenue levels, but it is really about whether the size of the budget should be allowed to change with changing circumstances.
Viewing the debate through the lens of these differing worldviews, the arguments all begin to make more sense. One perspective holds that the federal budget—both spending and taxes—should maintain a certain stability based on recent historical experience. The share of national income that goes to taxation and spending should not rise above those historical levels. If they do, there is a problem. The other perspective holds that the federal budget should be responsive to underlying circumstances that change over time. If those circumstances demand higher spending, then higher revenues will be necessary to meet the new financing needs.
Both perspectives are valid as starting points for analyzing the federal budget and its current deficit. It is important to explore each in their strongest forms, being careful to avoid caricature. There are weak or easily debunked versions of both arguments, but it is far more illuminating to engage with the strongest forms of each perspective. And yet, just because both perspectives are valid as starting points does not mean both are equally valid as fiscal frameworks. Even in their strongest forms, one perspective has, in practice, consistently lead to a widening of the federal budget gap. But before exploring each perspective it is useful to start with the facts.
The structural federal budget gap
The federal budget really does have a large structural gap between spending (all the money that goes out from the federal government in all its various forms) and revenues (all the money that comes into the government, mostly through taxes). A structural gap is one that derives from ongoing policies under normal circumstances, not anomalous conditions or temporary policies that are expected to or designed to end. This simply means that, unless something changes, the current laws and policies will always result in lower revenue than spending, in perpetuity.
The very large budget deficits that existed during World War II or during the Great Recession of 2007–2009 or during the short but sharp COVID-19 recession of 2020 were mainly not structural. They were driven by temporary, urgent conditions that were met with temporary, emergency policies such as massive military spending, stimulus checks, or one-time tax incentives.
Today, however, the federal budget deficit is largely not caused by temporary factors. There are few, if any, major fiscal policies that are deliberately designed to be temporary.1 And the underlying economic conditions, while not particularly strong, are similar in most respects to recent years. Unemployment during the previous 12 months averaged 4.3 percent. And although inflation remains stubbornly high, wage growth is sluggish, and hiring is disappointing, the U.S. economy is certainly not in a full-blown recession like in 2020 or 2007–2009. Consequently, today’s gap between spending and revenue is real and persistent in a way that temporary spikes from recent experiences simply were not.
In the most recent fiscal year ending in September 2026, the federal government collected just under 17 percent of Gross Domestic Product in total revenue. At the same time, total federal spending was 6 percentage points of GDP higher than revenue. Of that 23 percent, 3.3 percentage points of GDP was interest on the federal debt. The other 19.7 percent of GDP was programmatic spending—everything from national defense and health care to national parks and law enforcement. This total of programmatic spending—distinct from net interest payments—is sometimes referred to as “primary spending.”
That gap of 6 percentage points of GDP, and especially the primary gap of about 3 percentage points (total programmatic spending above total revenue) is essentially all structural, driven by persistent policies under normal conditions. As a result, this gap is not expected to close on its own.2 (See Figure 1.)
Figure 1
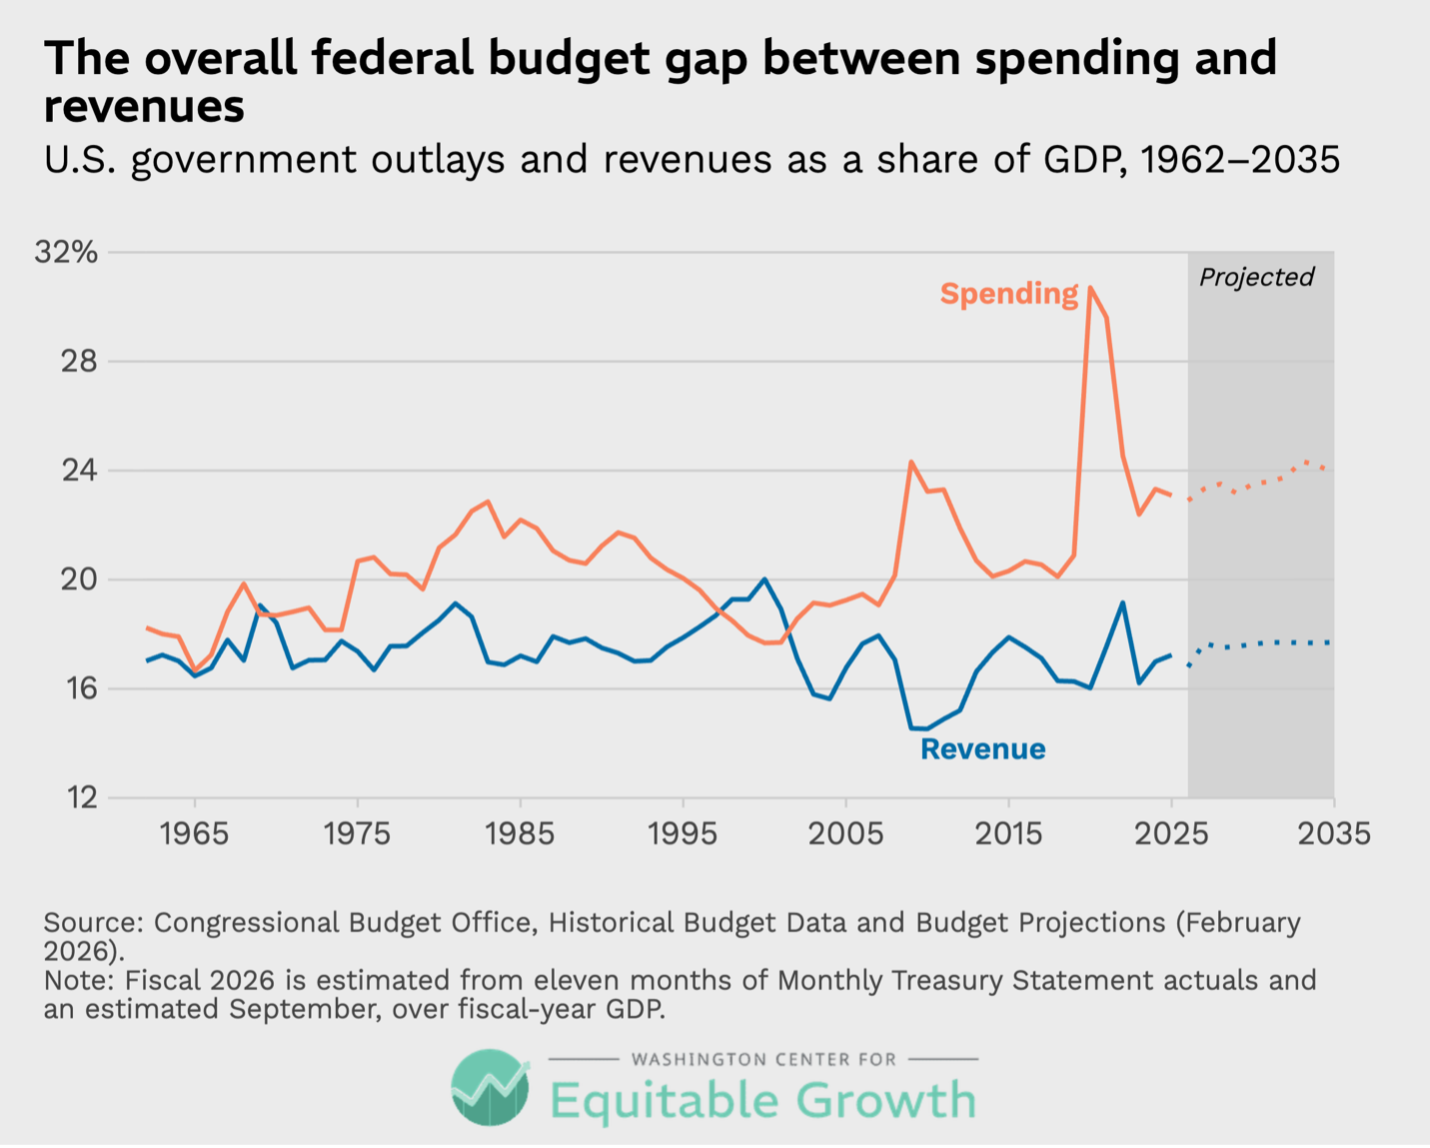
This budget gap is real and large in both historical and economic terms. Outside of major wars and deep recessions, there is essentially no precedent for persistent deficits of this size. And deficits of this size mean that if nothing changes, the federal government will require an ever-increasing amount of borrowing to finance the gap at a rate that far outpaces economic growth.
There exists a robust debate about the consequences of such a large structural budget gap and the borrowing it requires. This report will not weigh in on that debate except to say that, first, it is not clear that the current debt load of the federal government is either particularly burdensome or causing any specific harms right now, and second that, even so, it is not alarmist to concede that what cannot continue forever usually does not.
In either case, there is no debate whatsoever that higher debt means higher interest payments on that debt and that there are better uses of national resources than paying interest on old debt to largely wealthy lenders. For those reasons and others, it is hard to deny that—all else being equal—a smaller structural federal budget gap would be preferable and safer.
A clash of frameworks, not math
It is no surprise that even a shared interest in closing that structural gap quickly turns into a debate about the best way to do so. And tied up in that debate is an argument about why we find ourselves in this situation in the first place. After all, the federal budget was not always in such a state. To reduce the structural budget gap, it is useful to understand where it came from. And yet, a gap between two numbers can always be described in two ways: one number is too high, or the other number is too low. Nothing in the numbers themselves tells you which is the “right” diagnosis.
That is why it is useful to step back and understand that these two clashing diagnoses are, in fact, disagreements about much more than which number is too high or too low. Far too often, the debate about the deficit and the debt is framed as a question about either partisan blame or whether it was over-spending or under-taxing that caused the problems. Those framings have their place, but underneath them is something deeper. The real debate is about a more fundamental view of the world. The best way to think about the debate over the federal budget is in terms of two opposing fundamental worldviews.
The first worldview holds that there are generally appropriate levels of federal spending and taxation, bounded by modern historical experience. Structural federal spending should stay roughly in line with what the U.S. government has historically spent, regardless of circumstances. The federal tax code, therefore, should be built so that revenue is sufficient to finance that historical level of spending, but no more. Deviations from those historical anchors are the key indicators of change.
The second worldview takes a very different conceptual approach. Federal spending and revenue are not tied to historical averages or norms but are, instead, the products of specific policy choices that have long-term consequences. There is no fixed correct level, and current and projected spending is largely the direct result of commitments made decades ago and repeatedly reaffirmed by the public in various forms. Changes to the fiscal path should be judged against the path we are on, not against a historical norm.
Each worldview points to its own statistics and facts. Usually, those numbers are not wrong and stem from some degree of underlying truth. But one reason why one set of numbers will never defeat the other is that the numbers cited are fundamentally downstream of a more important, prior understanding about what the federal budget is for and what it should be. In some ways, it would be better for everyone if this debate were argued at the level of principles rather than numbers.
After all, the stakes in this debate, while often clouded by competing statistics, are not merely accounting. Changes in federal fiscal policy have enormous implications for every person in the country in direct and quantifiable ways. And that is why it is worth exploring each worldview in its strongest form and being explicit about each framework’s practical implications.
A budget anchored in history: Exploring this perspective in its strongest form
Recall that the first worldview begins with a simple premise: there is an appropriate level of federal spending and federal taxation, measured as a share of total economic activity, which, while not exact, can be intuited by referencing our own modern history. In other words, there is a certain limit to the percentage of our national income that should flow through the federal government, and that limit is based on recent history.
After World War II until the end of the 20th century, federal spending averaged 19 percent of GDP. And while there was a clear, modest upward trend in spending from the 1950s through the 1990s, over the course of the 21st century spending growth has increased materially. Today, the federal government’s spending level of roughly 23 percent of GDP is clearly above any calculation of a modern historical average.3 (See Figure 2.)
Figure 2
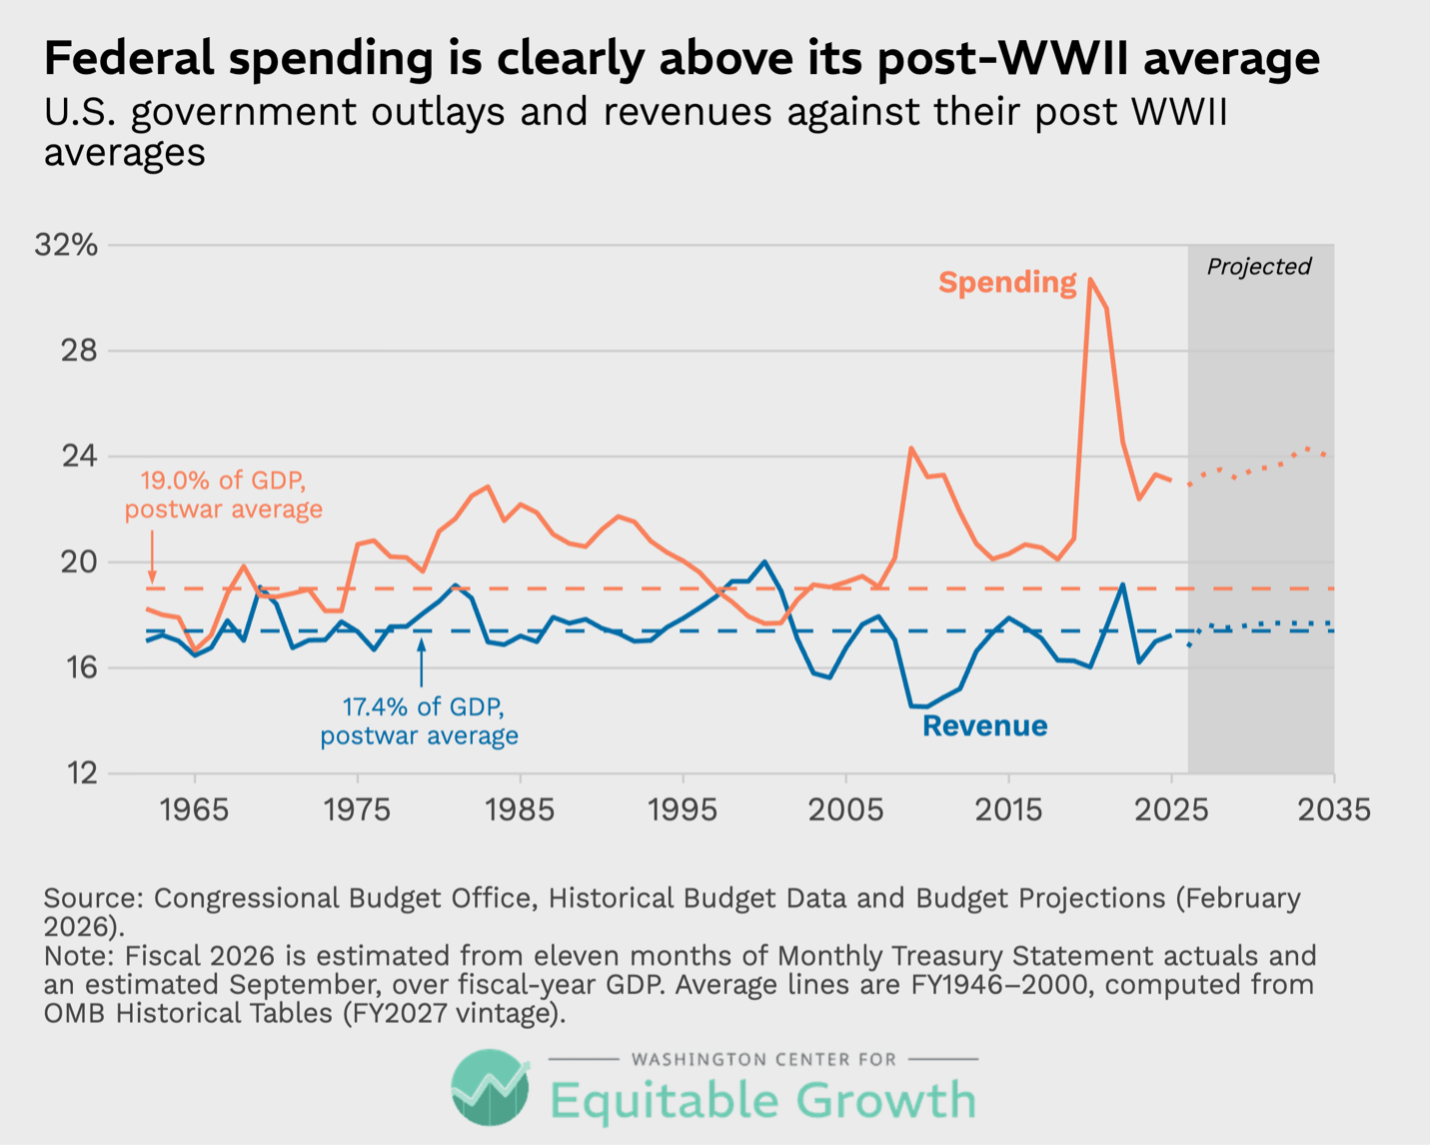
At the same time, revenue levels today are not substantially lower than their historical average. Since the end of World War II, federal revenue has averaged 17.4 percent of GDP. That makes the revenue level in 2026 only slightly lower than average. Put simply, federal spending today is substantially different from its historical average, but federal revenues are not.
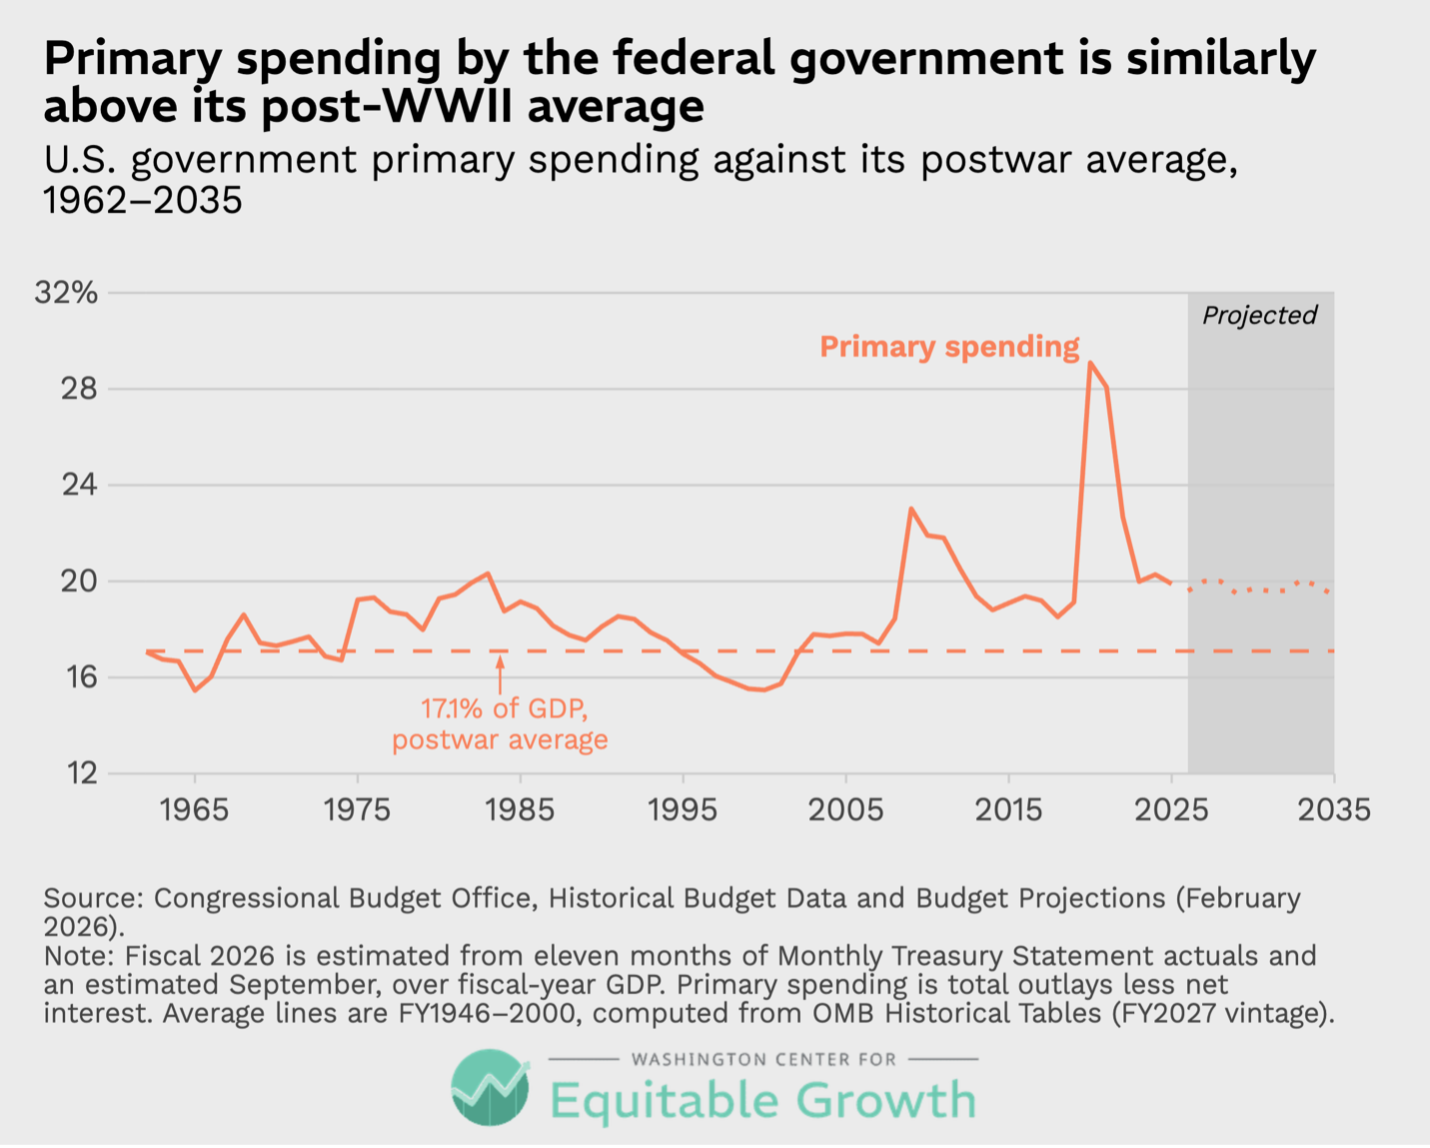
Moreover, while some of today’s spending deviation from the historical experience is driven by recent increases in costs of interest paid on the federal debt, the underlying observation does not change even after stripping that part out. Primary spending—spending outside of interest payments—was 19.7 percent of GDP in 2026. That is more than two percentage points of GDP higher than the post-WWII average for primary spending. In other words, the federal government is spending more than it used to. (See Figure 3.)
Figure 3
The upward trend in spending is being driven exclusively by a handful of very large federal programs. Spending on Social Security, Medicare, Medicaid, and other major health care programs went from 7.1 percent of GDP in 2000 to 11.2 percent in 2025, driven by an increase in the proportion of Americans who are retired, and by rising health care costs. That is a massive increase by any accounting, and it is wholly responsible for the increase in spending over the past 25 years, as all other federal programmatic spending was largely flat over the same period.4 (See Figure 4.)
Figure 4
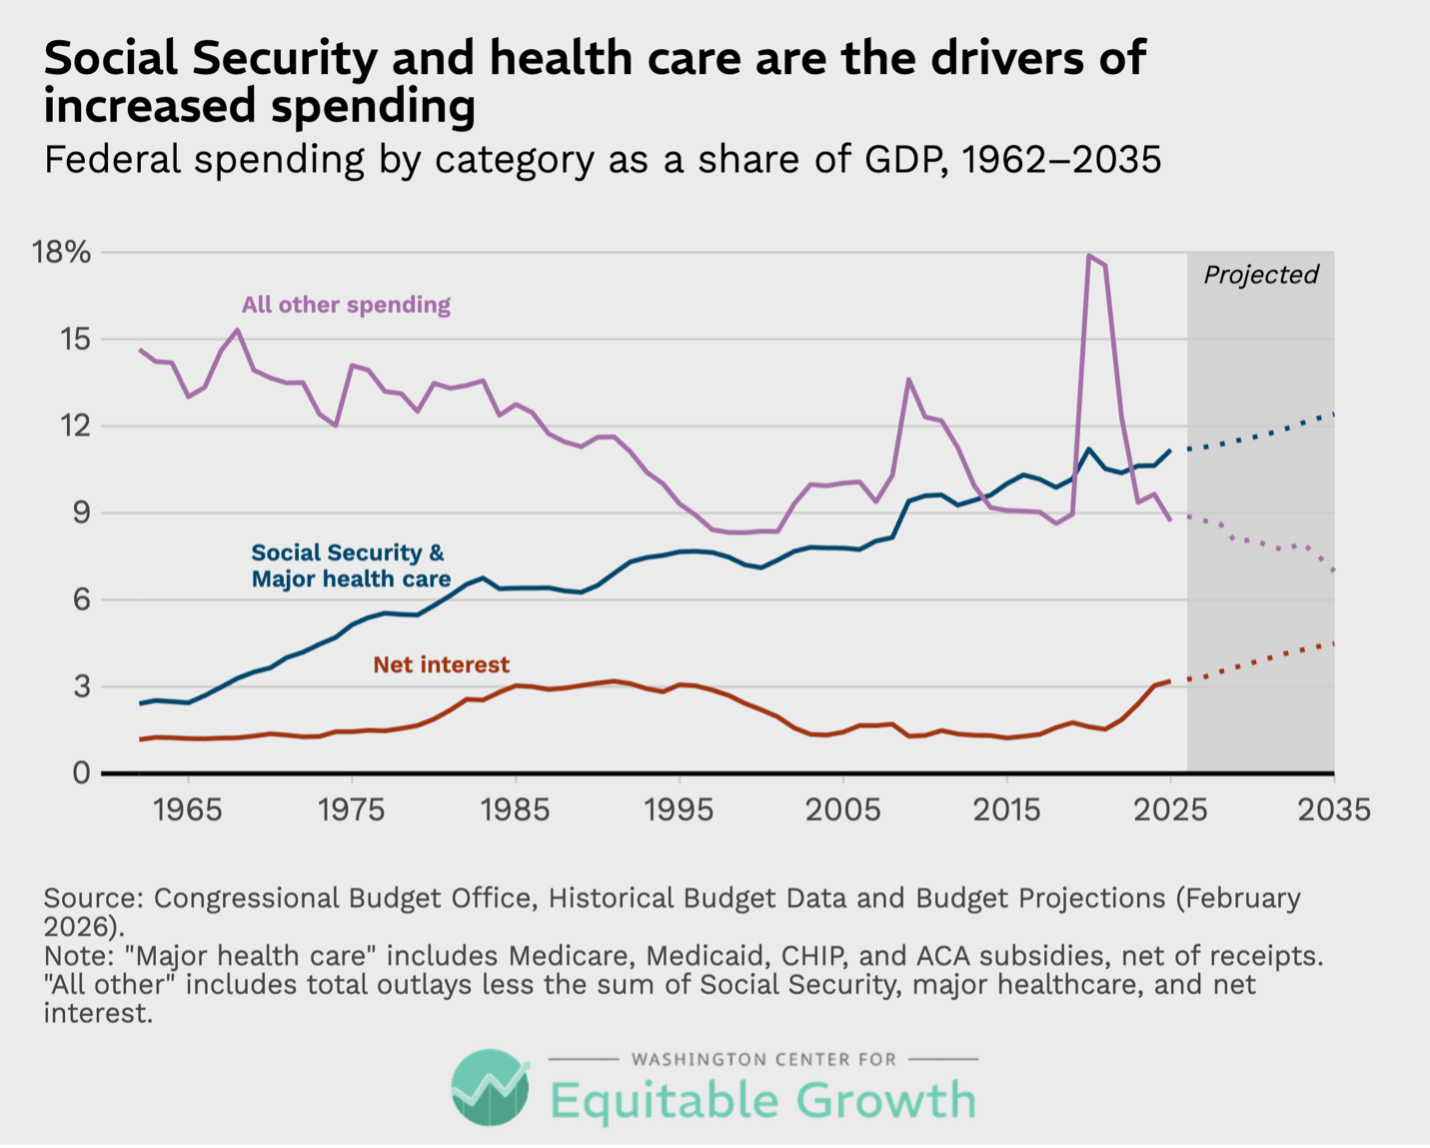
Furthermore, the trend is not expected to stop. The Congressional Budget Office projects that spending on Social Security and major health care programs will rise a further 2 points of GDP over the next two decades, even as everything else is expected to decline slightly. The result is that primary spending will remain significantly elevated, compared to the historical average.5
Any way you cut it, structural, persistent spending is higher today than it has ever been, even as revenue levels are well within their historical range. Consider that if primary spending today were at 17.1 percent of GDP, as it was during the post-WWII period, then the structural gap between primary spending and revenue would be less than 1 point of GDP.
This is the strongest version of the first worldview’s argument and nothing in the preceding numbers can be seriously disputed. Federal spending really is higher today than it was a quarter-century ago, driven entirely by spending on Social Security and health care, largely for senior citizens. And it really is true that spending is now and, without policy changes, will continue to be significantly elevated compared to the post-WWII average.
At the same time, those who adhere to this perspective need to directly acknowledge that holding spending stable as a share of GDP is not a neutral preference as it is sometimes presented. A historical average is not necessarily a useful benchmark against which to judge current levels. The implication of this first worldview is that changes in the U.S. economy, society, national needs or wants should not affect the overall level of spending. Those factors may affect the composition of spending, and the design of programs or benefits, but fundamentally, in this view, the totals should be the same.
This means spending totals that made sense in the 1960s, when the baby-boom generation was entering the workforce, must also be made to work now, when that generation is retiring. If that requires significant changes to how we deliver benefits or the benefits themselves, or significant reductions elsewhere in the budget, then so be it.
The practical implications of this worldview for the future are stark. To bring future spending back in line with the post-WWII historical average—to cut spending by nearly 3 percentage points of GDP—would require either significant cuts to existing commitments to senior citizens or very large reductions to all other parts of the federal government.
Fundamentally, those who see the world through this lens have a defensible viewpoint, but it is not an impartial one.
A budget that moves: Exploring this perspective in its strongest form
The second worldview does not begin from a historical anchor. Instead, it begins with the premise that the federal budget reflects the demands of the current moment. Spending and revenue levels stem from specific policy choices and therefore changes in those policies should be judged against how they affect the path we are on.
This worldview does not and cannot deny that spending has increased over the past quarter-century. Instead, what matters is that this increase was foreseen, expected, and was, most importantly, already accounted for in the federal budget in a way that avoided a permanent fiscal budget gap. This worldview says that an increase in costs does not need to result in a fiscal gap, so long as the revenue base is designed to handle it, which it was.
As of 2000—and, in fact, well before—the U.S. government’s fiscal outlook already foresaw and incorporated the impact of baby-boomer retirement on the federal budget. The Congressional Budget Office issued a long-term budget outlook in the fall of 2000 that projected federal spending on Social Security, Medicare, and Medicaid to rise from 7.5 percent of GDP in 1999 to 11.7 percent by 2020, 14.7 percent by 2030, and to reach 16.8 percent of GDP by 2040.6
The non-partisan CBO was not alone. Every official and reputable projection forecast essentially the same shape of coming spending. The Social Security Trustees projected in 1995 that the program would grow from about 4.8 percent of GDP to 6.4 percent by 2025 to roughly 6.7 percent by 2040. Also, in 1995, the Medicare Trustees expected Medicare to more than double, from 3.2 percent of GDP in 2000 to 6.8 percent by 2025. In 1998, the non-partisan General Accounting Office (now called the Government Accountability Office) offered its own projections showing spending on Social Security, Medicare, and Medicaid rising from 9 percent of GDP in 1997 to more than 15 percent of GDP by 2030.7
These projections were all similar because the coming increase was not hard to predict. The projections were not driven by changes in policies, but rather by changes in the underlying demographics and long-running economic trends such as rising health care costs. (See Figures 5 and 6.)
Figure 5
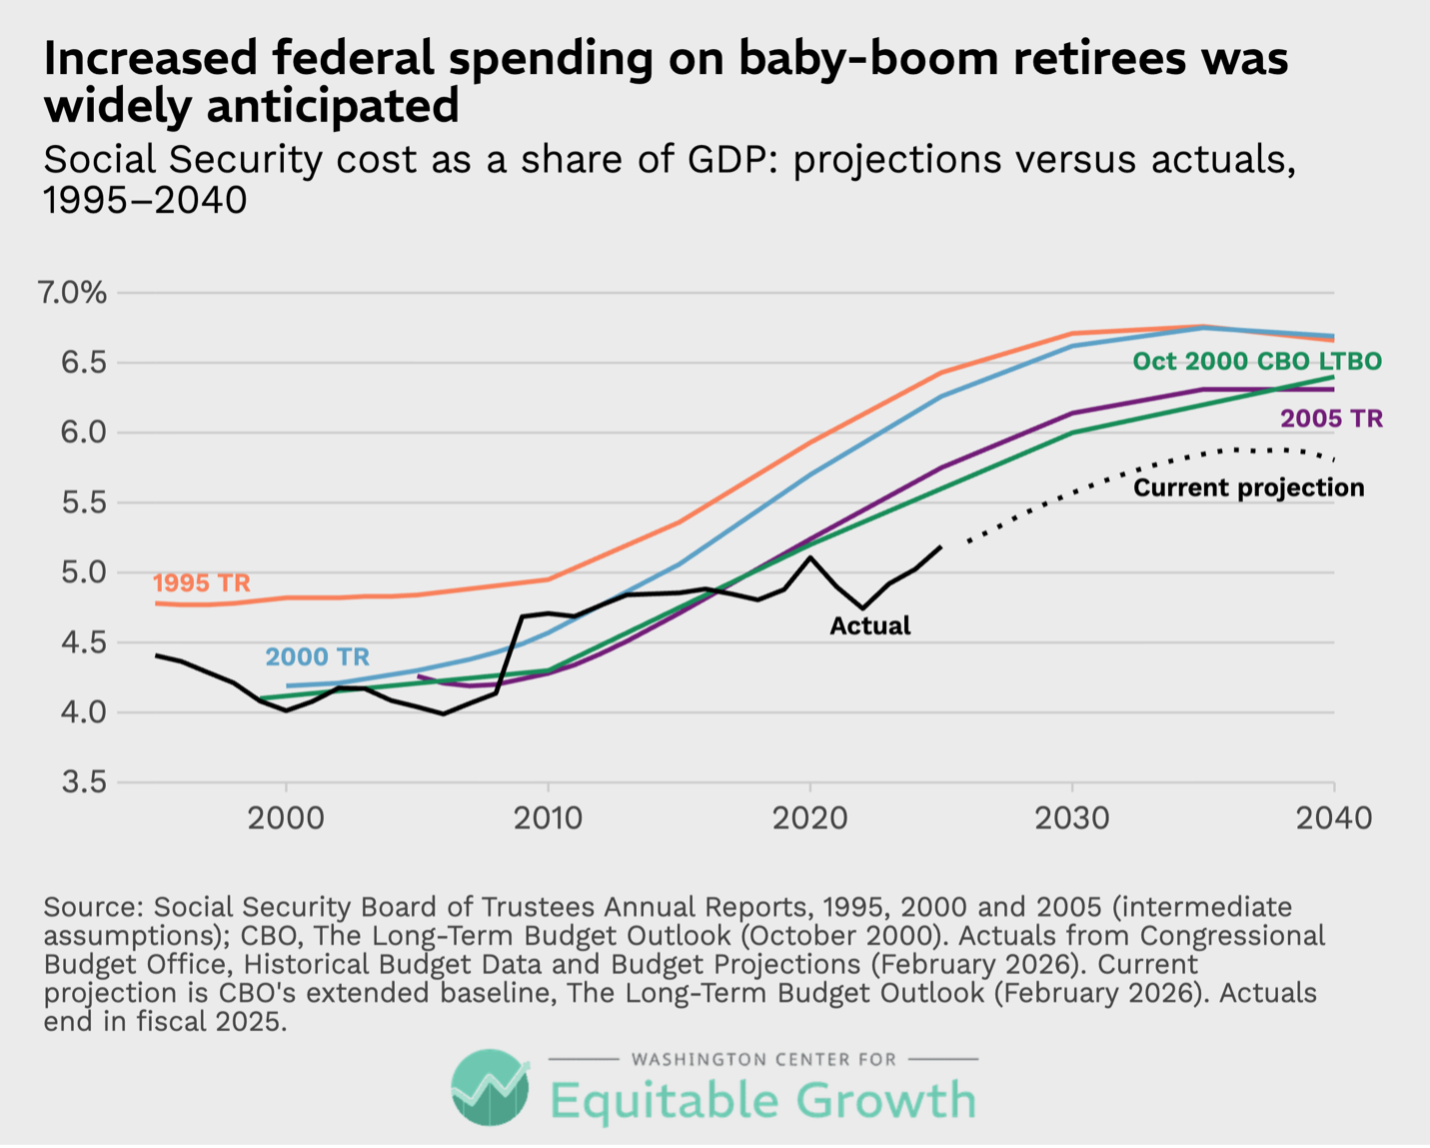
Figure 6
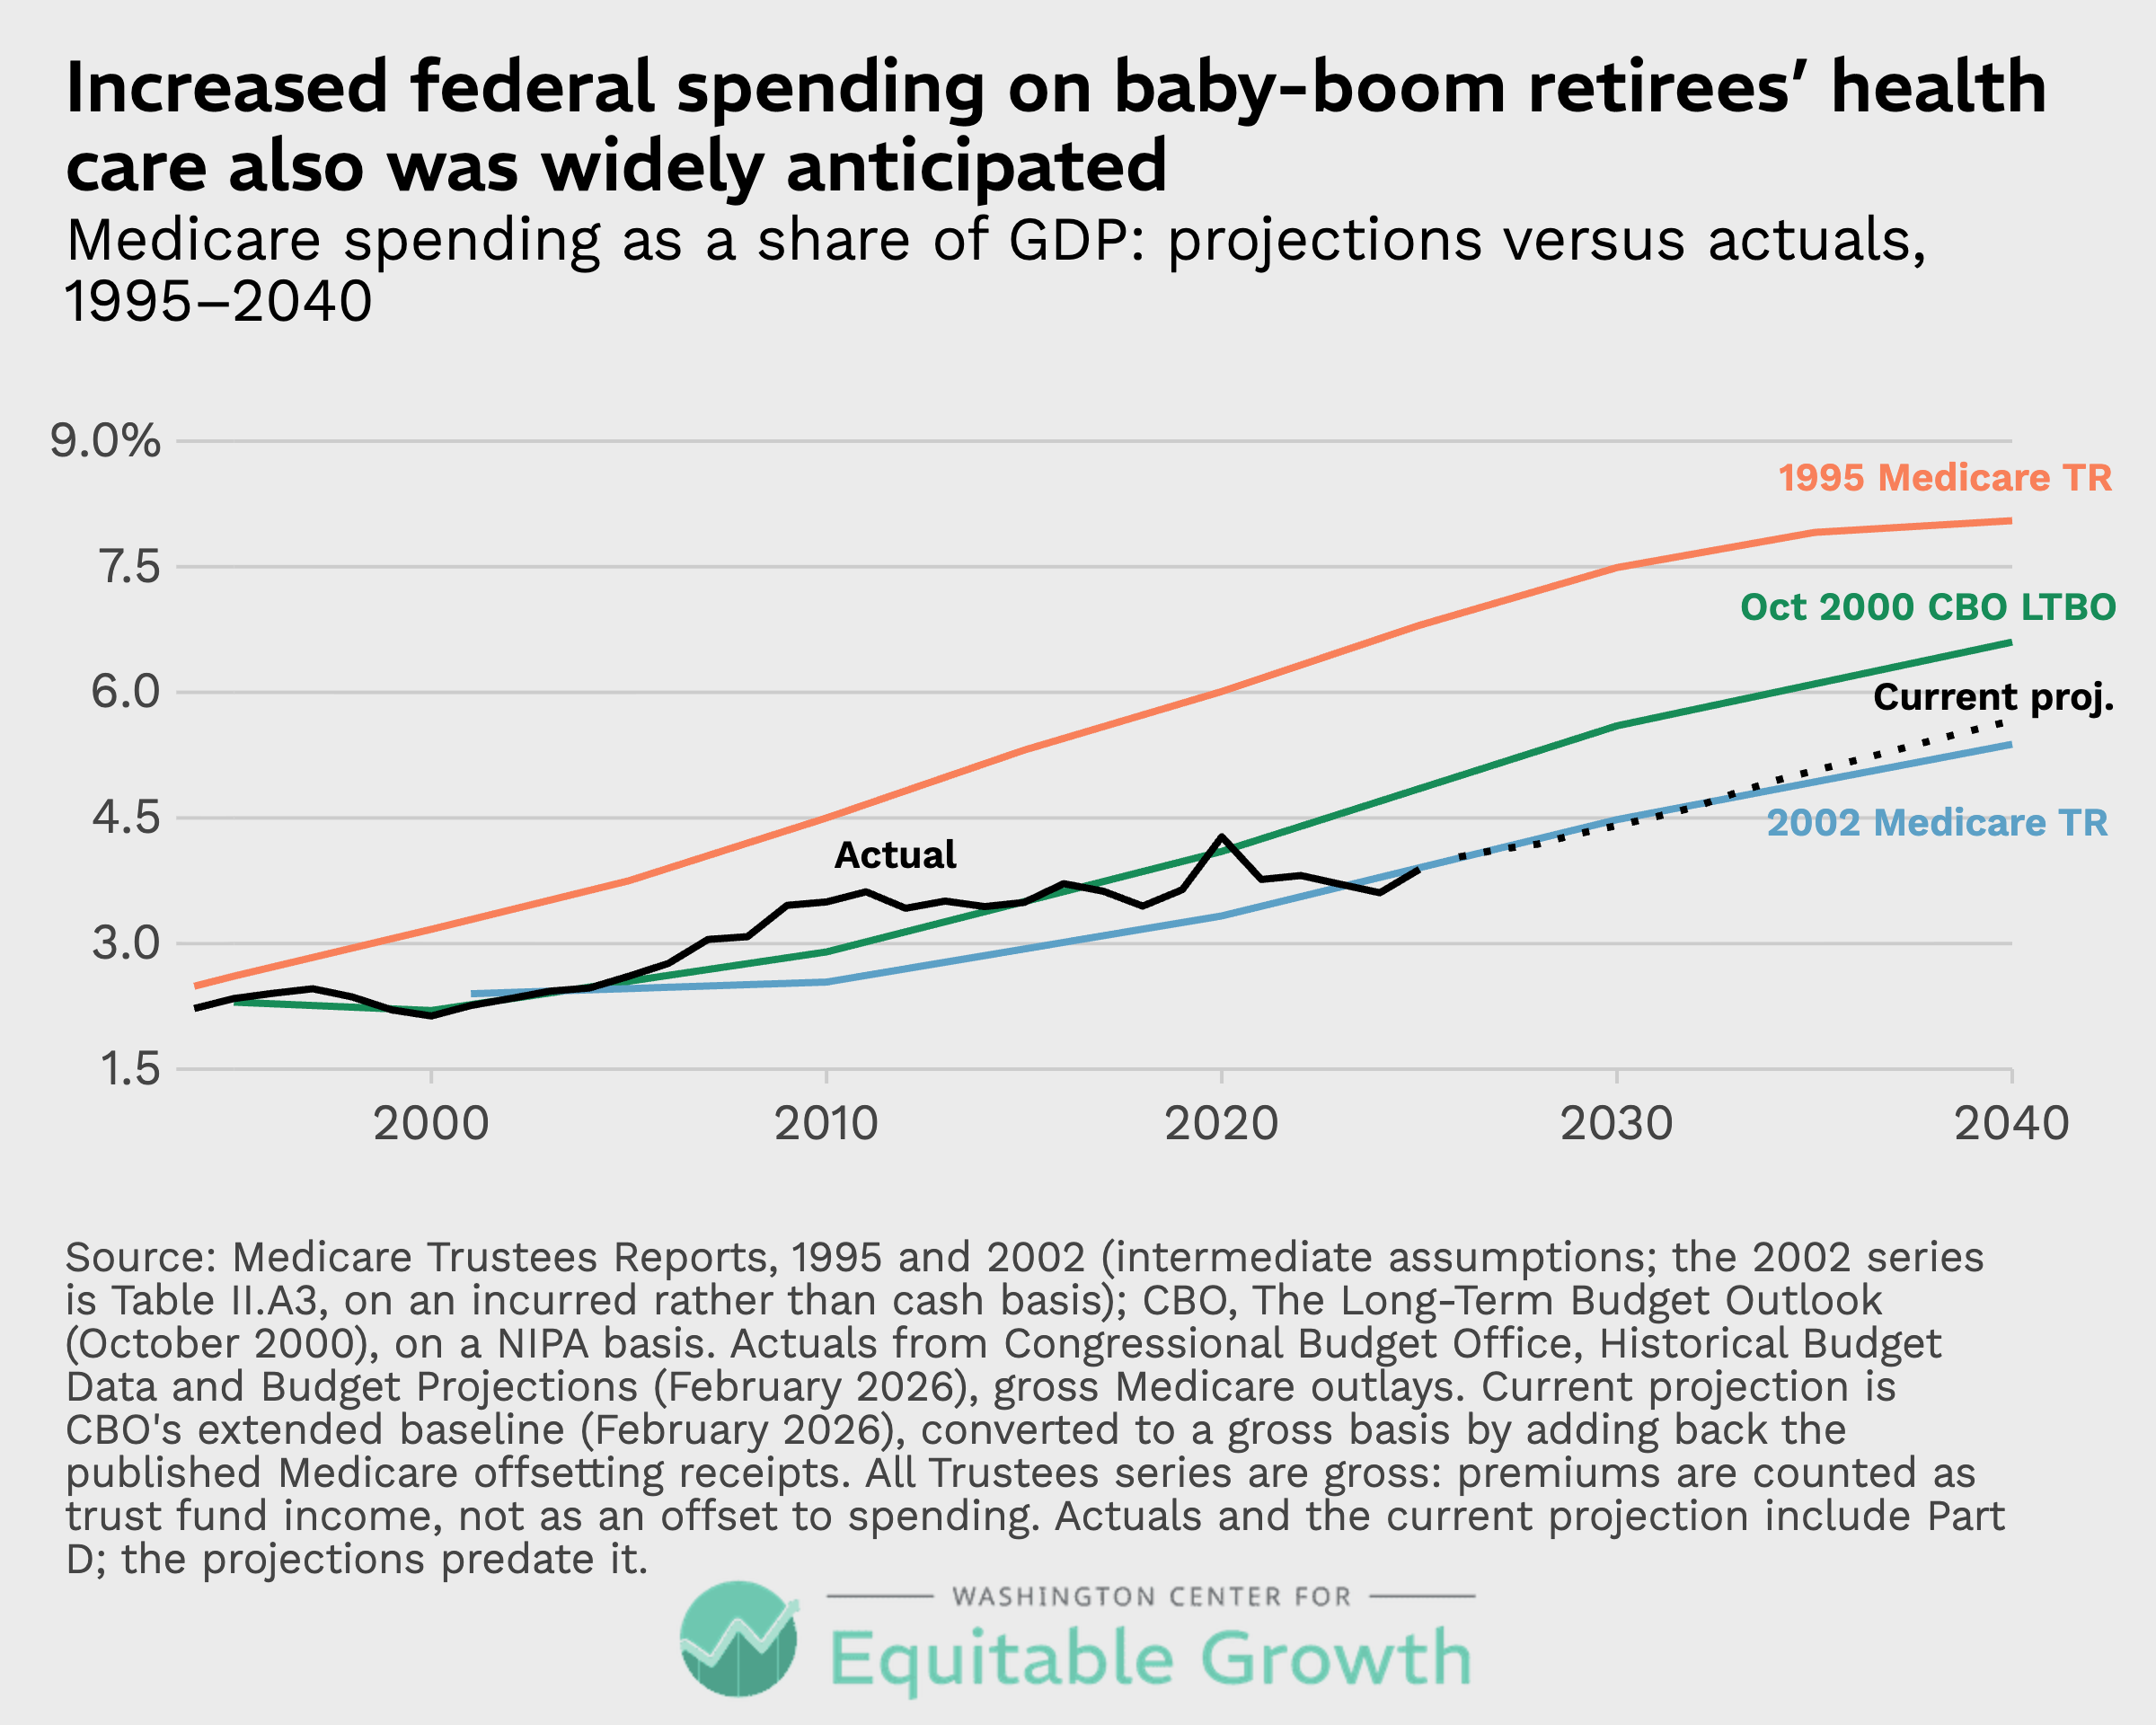
The bottom line is that, at the turn of the 21st century, everyone knew that federal spending was heading for an upward trend driven by the retirement of the baby-boom generation. And yet, those same projections forecast a stable budget outlook with declining debt, not rising. Why?
Because revenue levels were also higher—at 20 percent of GDP—than they had been before and were expected to stay that way. Indeed, that revenue level was the result of specific legislation aimed at increasing taxes. The 1990 budget agreement and the 1993 reconciliation act both raised revenue for the explicitly stated purpose of putting the budget on a sustainable path. And against that goal, they largely succeeded. With revenue at or near 20 percent of GDP, the coming retirement of the baby-boom generation was, for all intents and purposes, paid for.
Indeed, today’s federal spending level is very much in line with what was expected 25 years ago. In 2000, the Congressional Budget Office projected that federal primary spending in 2025 would be just under 20 percent of GDP. Remarkably, that is almost exactly what it was last year. Looking forward, today’s CBO projections of primary spending are lower than what it expected at the turn of the century. Twenty-five years ago, the Congressional Budget Office expected that primary spending would rise to over 24 percent of GDP by 2040.
Today, CBO projections anticipate primary spending in 2040 to be roughly stable at 20 percent of GDP, four points lower than projections from the turn of the century. Total programmatic spending, in other words, has grown more slowly than expected compared to projections from when the budget outlook was stable.8 (See Figure 7.)
Figure 7
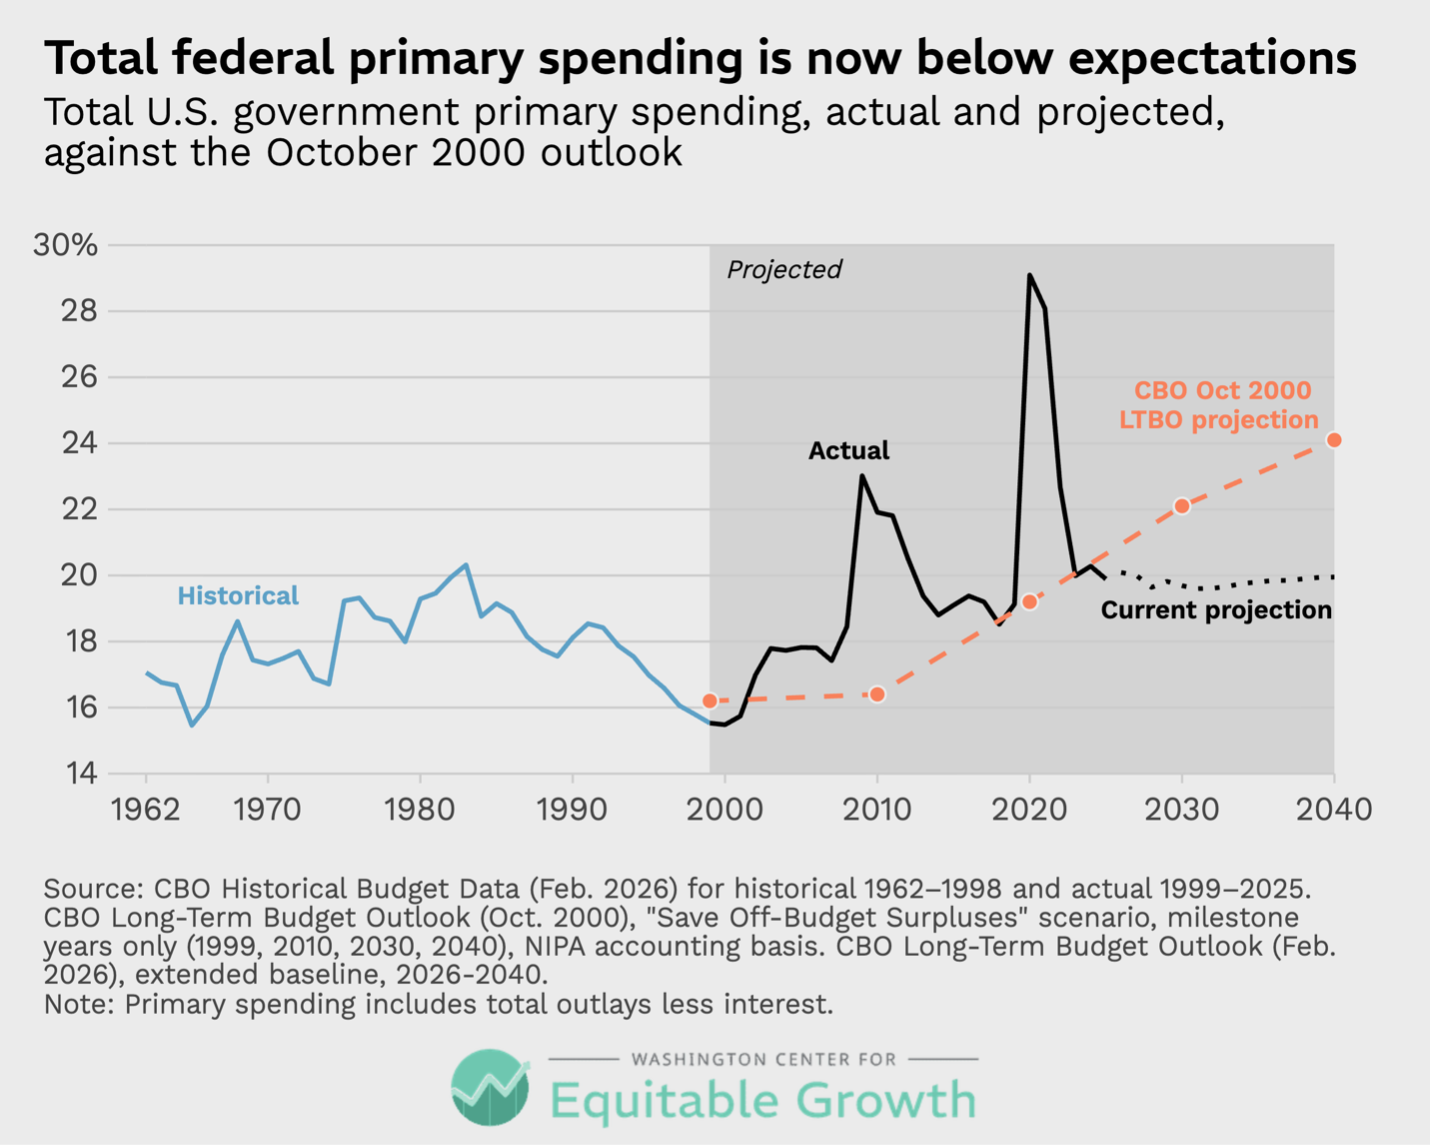
The main programs driving these lower spending projections are the same ones that drove total spending up. Forecasters fundamentally overestimated how expensive it would be when the baby-boom generation retired. Combined spending on Social Security, Medicare, and Medicaid totaled 11.2 percent of GDP in 2025. That’s 2 points lower than the Congressional Budget Office expected in its 2000 projection.9 Other programmatic spending is higher than CBO’s 2000 projections, but the undershoot in costs for Social Security, Medicare, and Medicaid more than offsets growth in other areas. (See Figure 8.)
Figure 8
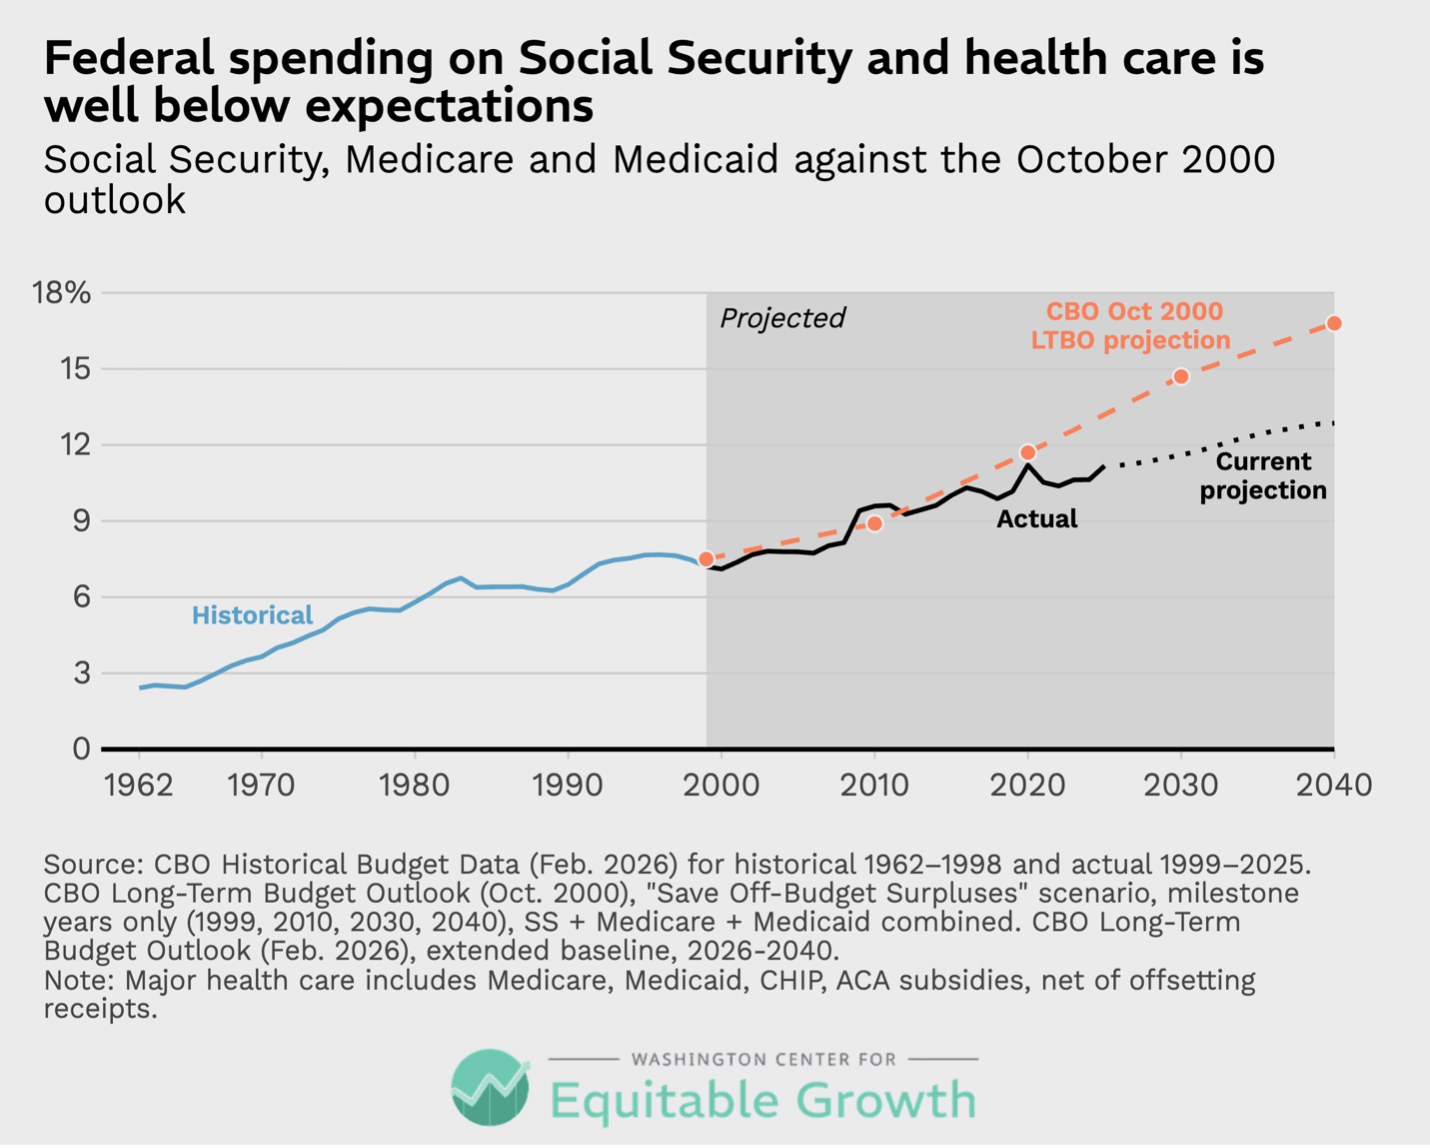
Stepping back, the key takeaway is that the federal budget outlook was stable at the turn of the 20th century, and today, spending is no higher than was expected as part of that stable outlook. And yet, the budget gap is much larger than expected. How can that be?
The reason is because revenue did not stay at 20 percent of GDP, as expected. Instead, tax cuts enacted in 2001 and 2003, followed by the extensions of those tax cuts in 2012, and then new tax cuts in 2017 and 2025, meant that federal government revenue fell short of expectations in every single one of the past 25 years. Today, instead of generating 20 percent of GDP in revenue or more, the tax code generates less than 17 percent.
The bottom line is that tax cuts—not spending increases—have driven the divergence from the stable path we were once on. Yes, spending was always expected to increase, and it has. But that increase would not have meant a permanent structural budget gap had taxes not been deliberately cut. If we had maintained a federal tax code that generated about 20 percent of GDP, as was the case before the tax cuts, then the structural fiscal gap would be zero, and the debt would be declining as a share of GDP.
As with the first worldview, none of the numbers or facts presented as part of the second worldview are in dispute. The budget was on a fully sustainable path even knowing that there was a significant increase in spending coming from the impending retirement of a large generation of workers.
Furthermore, those costs in real life came in lower than expected, which should have provided for even more fiscal room. Changes in spending policies from that point have not significantly altered primary spending projections in the long run (if anything, those long-run projections are lower today than they used to be). But changes in tax policies resulted in much lower revenue. Today, that is the major difference in the fiscal outlook compared to when the budget outlook was stable.
This is all true and indisputable. And yet, like in the first worldview, this analytical framework is not neutral. The worldview that says changes in fiscal policies should be judged against the prior fiscal path gives preference to decisions that were made in the past and have long tails into the future. And while this is how formal analyses of policy changes are typically judged—when the Congressional Budget Office issues a score, it is presented as changes relative to a baseline made up of current policies and laws—it also embeds a certain unearned credibility into the prior path.
As of the year 2000, the budget path was stable. But it was stable because it relied on higher taxes than the country had been used to. And it assumed that the federal government would make no attempt to reduce its commitments to senior citizens. If one opposed the structure or nature or degree of those commitments or the higher revenues they required, then one might not want to judge policy change against that path, stable or not. Nevertheless, one must still acknowledge that the path was, indeed, stable.
In practice, this second worldview preferences the stability of the budget path from 25 years ago, and with it, higher spending and the higher tax revenue that made such stability possible. The fundamental implication of this worldview is that fiscal sustainability should start from the commitments already made to the people of the United States and judge the current needs of the American people, then build a tax code that finances those commitments and investments responsibly.
In practice, this means that the federal government will require higher-than-average revenues because circumstances today are different from what they were 50 years ago.
While both worldviews are valid, one excels when it comes to fiscal responsibility
Having a preference for lower taxes and lower government spending is an entirely valid viewpoint. But those who hold the first worldview and apply it to the federal budget must grapple with several key weaknesses in this perspective. First, the argument rests on the idea that spending levels should remain within a defined historical range. And indeed, as discussed above, it is the case that federal spending between the end of World War II and the turn of the 21st century averaged about 19 percent of GDP, only surpassing 21 percent of GDP a dozen times and 22 percent just 3 times (all in the 1980s). Against that, current spending of 23 percent of GDP and rising seems like a significant change.10
Yet leaning on a historical average as a benchmark is, itself, ahistorical. Federal spending has undergone several major step changes since the turn of the 20th century, as national circumstances changed. Prior to World War I, for example, federal spending averaged about 2 percent of GDP a year. After World War I, annual federal spending roughly doubled to 4 percent of GDP. During the Great Depression of 1929–1939, annual federal spending more than doubled again, to roughly 10 percent of GDP. Then post-World War II spending almost doubled again to 19 percent of GDP a year.
The idea, then, that federal spending cannot exceed some historical average is belied by history itself. When the demands of the American people changed, so did their government’s budget. Why should it be the case that the post-World War II period is the correct level of spending, when no previous level of spending was?11 (See Figure 9.)
Figure 9
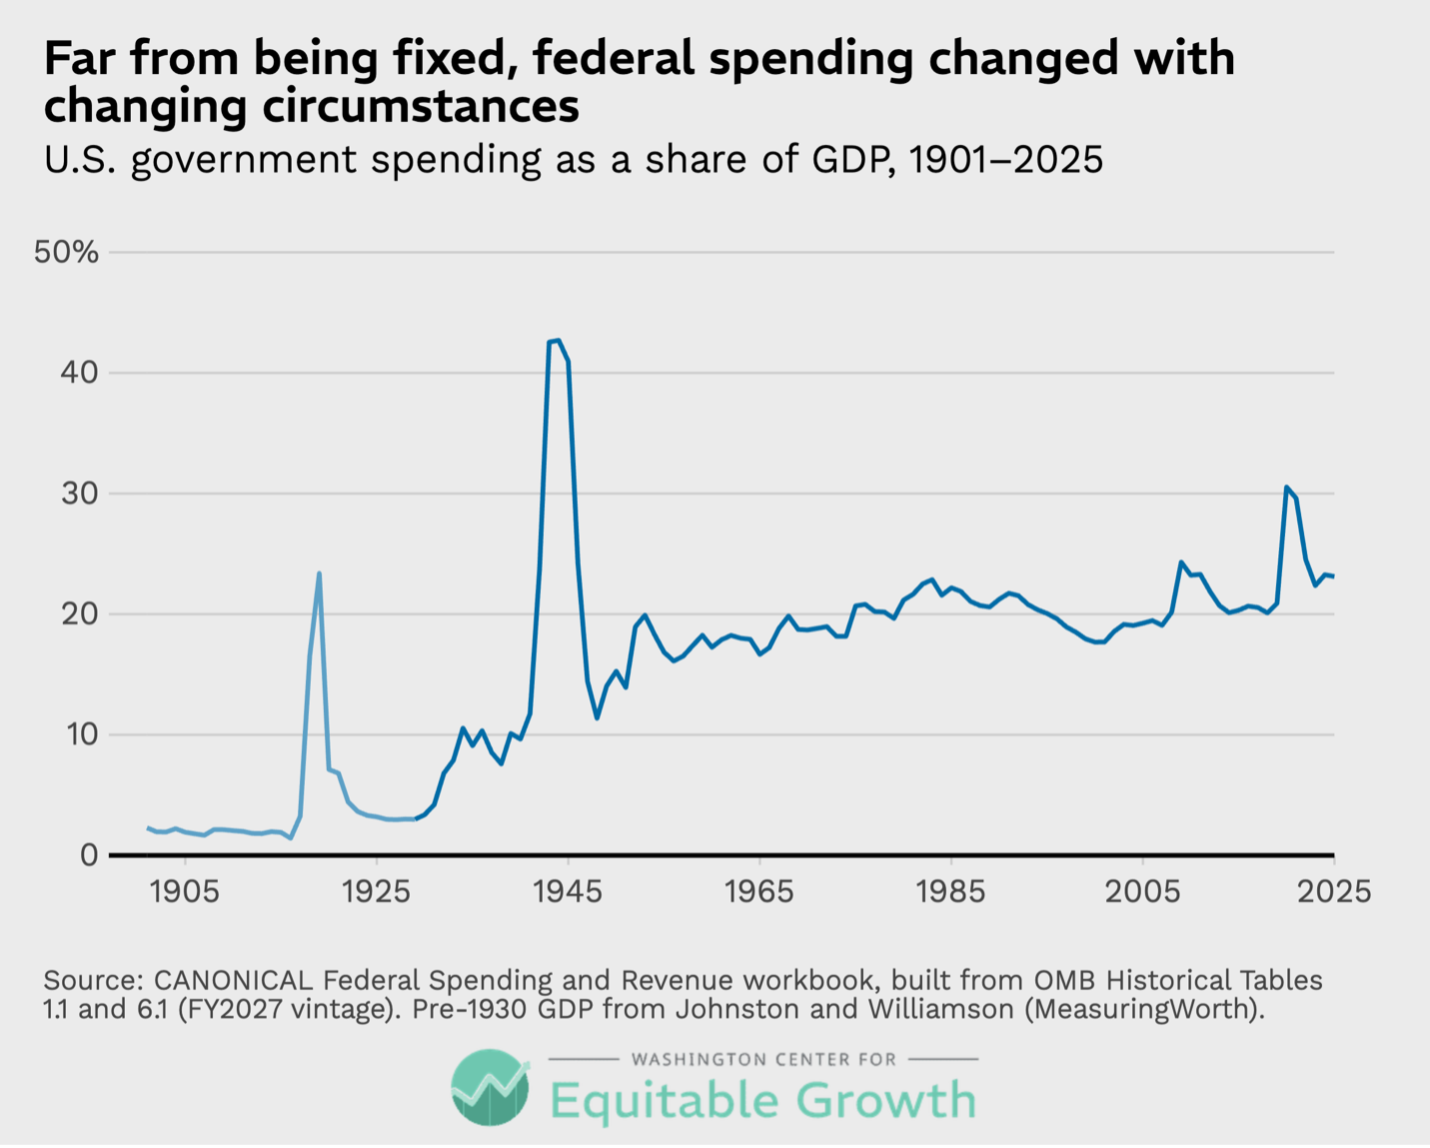
The retirement of the baby-boom generation has added to spending in the federal budget and is likely to add even more over the coming decade. But rather than being an unheard-of violation of some settled level of spending, this increase is mild compared to previous steep changes in federal spending.
The second major challenge to the first worldview is that, in practice, policymakers who claim to hold this view have, instead, revealed strong preference for keeping taxes at their historical average, but not for keeping spending there. In 2000, federal spending was projected to rise well above the average level of spending over the previous 50 years, but the debt was to decline because taxes were also well above their average over the previous 50 years (20 percent of GDP compared to the 1950–2000 average of 17.5 percent of GDP). For those who saw the budget through this first worldview, it would have made sense to pursue policies that both reduced spending back to what was considered the acceptable level, and then tax reductions to match. That would have, at least, been coherent.12
But that is decidedly not what happened. Major fiscal policy changes instead focused exclusively on returning tax levels down to their historical average, with no commensurate spending reductions. The 2001 and 2003 tax cuts were not paired with any changes to federal spending policies at all. Neither were the tax cuts of 2017.13 Even the recent tax cuts in 2025 were paired with spending reductions roughly one-quarter the size of the tax cuts. The result is that tax revenues today are, indeed, below their historical average, but as noted above, spending levels are essentially as predicted 25 years ago.14
While a worldview that posits an acceptable level of government spending is defensible on its own terms, far too often those who claim to espouse it are in fact simply using it as a cover for a different worldview entirely: namely, that taxes must always remain low regardless of fiscal circumstances. Indeed, this alternative version of the worldview matches the true actions of policymakers over the past 25 years far better than that which many of those same policymakers claim to believe. One can be for low taxes and pursue those low taxes at all costs, but one cannot then decry the debt that comes along with those tax cuts and blame it on spending alone.
These two objections—that there is no such thing as an accepted, appropriate historical average level of spending and that, in practice, there was no attempt to reduce federal spending, only successful efforts to reduce federal taxes—are close to being fully fatal. This first worldview is reduced to a preference for lower taxes over higher ones. This may be defensible as a separate premise, but not as a worldview for fiscal responsibility.
By contrast, the practical objections to the second worldview are much weaker. One such objection is that the 20 percent of GDP in revenue from 2000 was an anomaly driven by temporary capital gain realizations that year because of the unsustainable dot-com stock market bubble in the late 1990s that ended in 2000 and would not have persisted going forward. This objection, if true, would undermine this worldview’s contention that the budget outlook was stable heading into the new century.
But this objection does not hold water. While it is true that capital gain realizations were anomalously high in 2000, it does not follow that maintaining revenue at 20 percent of GDP would have been impossible. First, the role of capital gains realizations in federal revenue totals in 2000 is often overstated. Even without a penny of capital gains tax collections, revenue would have been 18.8 percent of GDP in 2000, which was the highest level of non-capital gains tax revenue on record to that point. Second, assuming merely average capital gains revenue that year would still have brought total revenue to more than 19 percent of GDP.
Furthermore, official estimates of the time projected that, absent policy changes, revenue would easily remain around 20 percent of GDP. The Congressional Budget Office’s 2000 budget outlook projected that federal revenue would average 20.1 percent over the coming decade, never dropping below 20 percent of GDP.15 This CBO projection was reaffirmed 10 years later, when, in 2012, it projected that if the tax cuts in 2001 and 2003 were to expire, as the legislation assumed, and the tax code reverted largely to its 2000 form, then revenue would once again return to 20 percent of GDP or more.16 (See Figure 10.)
Figure 10
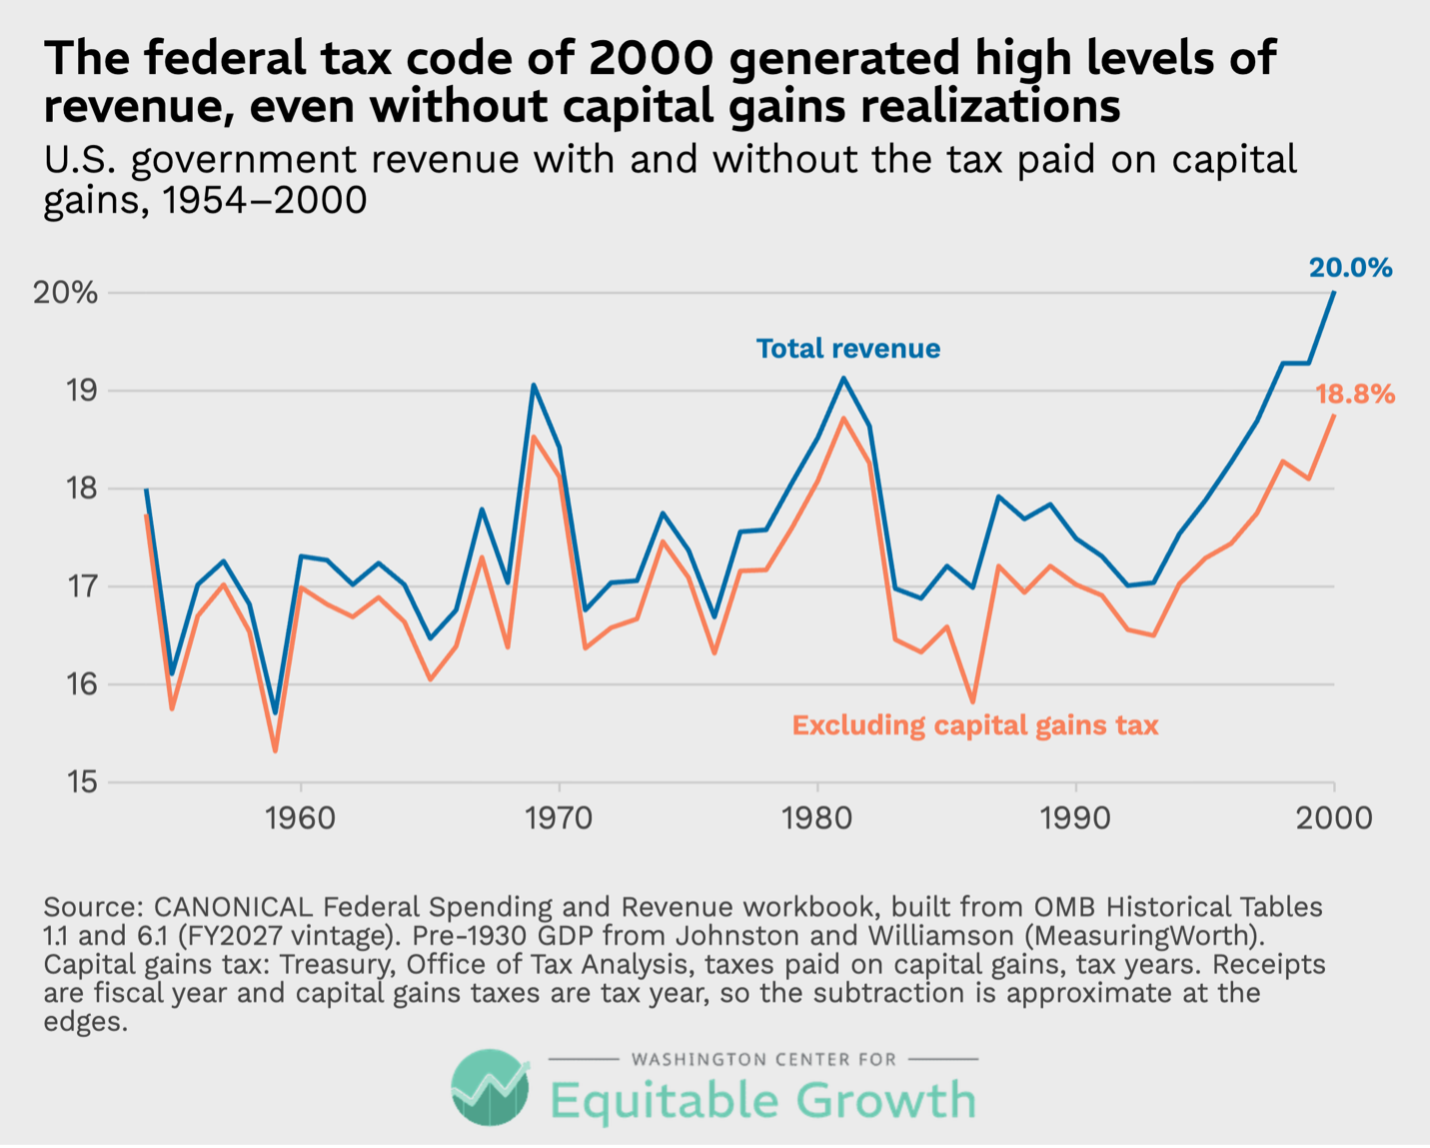
The point is not that the federal tax code of 2000 was perfect or that we necessarily should return to it wholesale. But it was certainly capable of generating roughly 20 percent of GDP, even in years without abnormally high capital gains realizations. And objections that those numbers rested on anomalies or temporary circumstances do not hold up to scrutiny.
A related objection, however, that does not depend on a supposed anomalous circumstance is that, in the entire history of the United States, the federal government has collected 20 percent of GDP in revenue exactly twice, once in 1944 and once in 2000. There is simply no precedent for tax revenue sustained at these levels in US history.17
That is indisputably factually accurate. But once again, as an objection that rests on historical experience, it ignores other aspects of that same experience. After World War I, there was no precedent for federal tax revenues to be sustained at 4 percent of GDP when they had been running at half that before the war. And yet, they averaged 4 percent of GDP over the next decade. What is more, the post-WWII average revenue level of 17.5 percent that adherents of the first worldview cite so often was, itself, unprecedented compared to pre-World War II average tax levels. Indeed, it was roughly four times higher than tax levels between the two World Wars.18 (See Figure 11.)
Figure 11
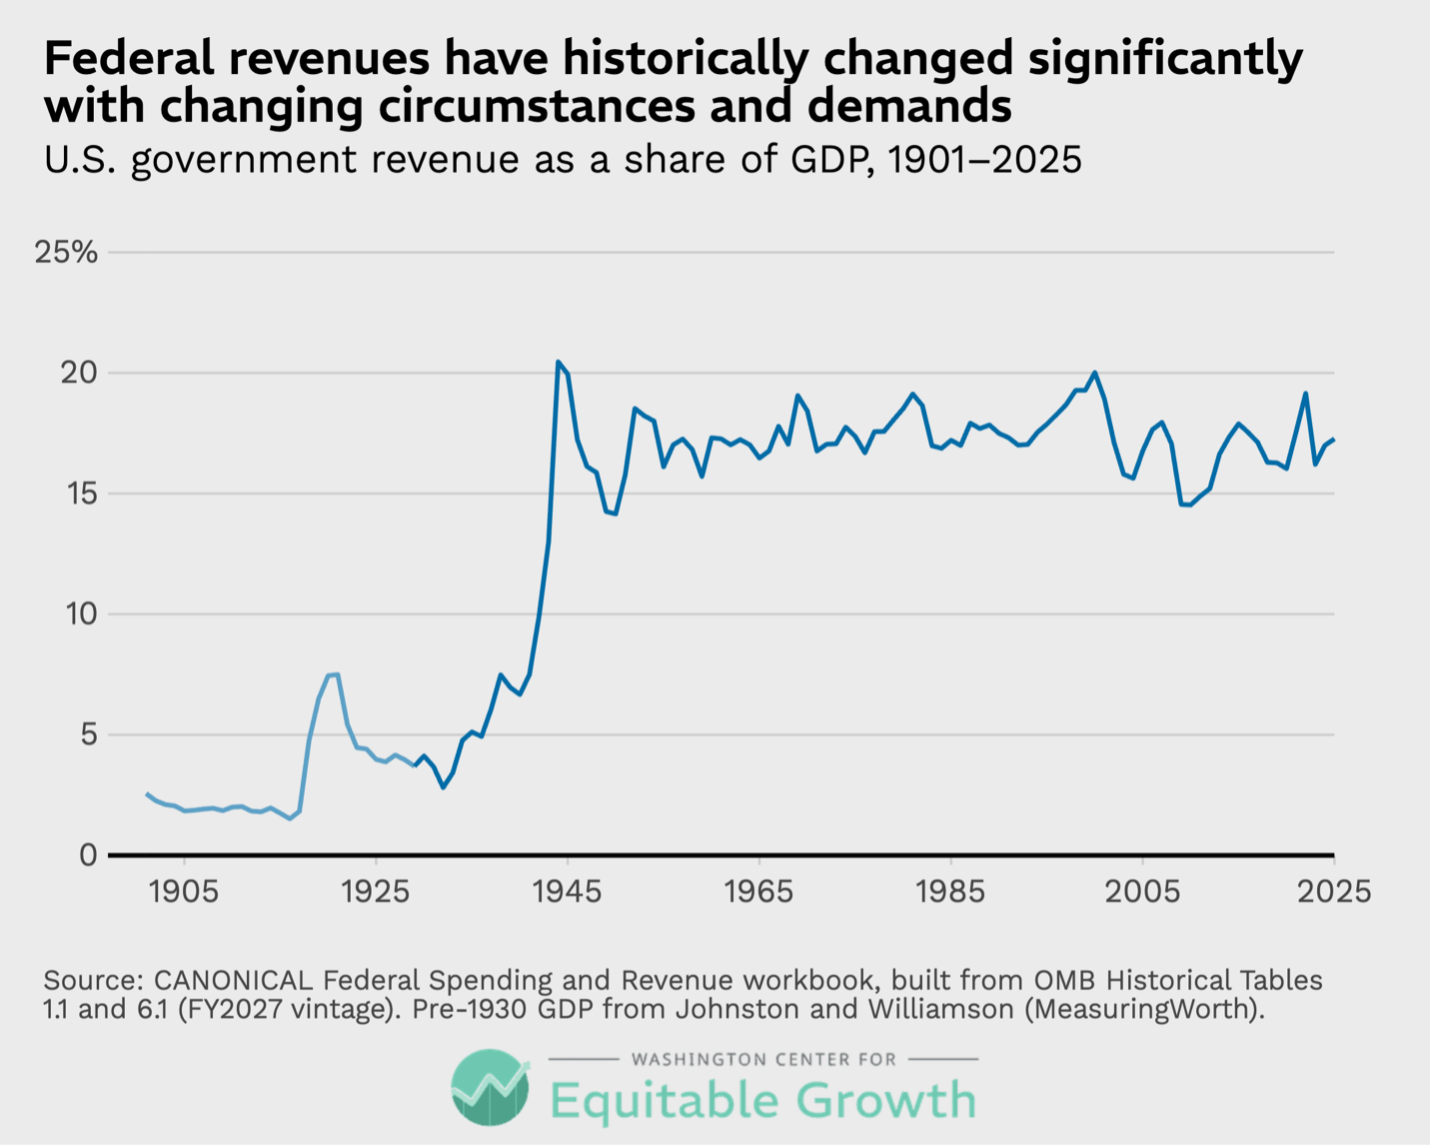
So, just because a revenue level is higher than before does not make it impossible. Our nation’s own fiscal history proves that decisively. Furthermore, there is no economic reason to believe that revenue of 20 percent of GDP for the federal government is out of reach. Nearly every other advanced economy in the world sustains tax revenue levels far higher than our own. The United States ranks eighth from the bottom among the 38 member nations of the Organisation for Economic Co-operation and Development in terms of total tax revenue. Were the United States to raise federal revenues to 20 percent of GDP, it would still be a low-tax country relative to the rest of the OECD members, still ranking in the bottom 10.19
That said, oftentimes the objection to 20 percent of GDP in tax revenue is presented as a political limit, not an economic one. The American public, the argument goes, will not accept a tax code that asks that much from national income. This line of argument is essentially unverifiable. In practice, it has been a bit of self-fulfilling prophecy. We had a tax code that generated 20 percent of GDP in taxes, and then federal policymakers cut taxes. Does that prove the American people would never accept higher overall tax levels? Unclear.
Certainly, the most recent two rounds of tax cuts in 2017 and again in 2025 were largely unpopular among the American public, which cuts against the argument. Additionally, there is clear popular support for some forms of higher taxation. But it is also true that most Americans feel they already pay enough in taxes.20
With all that said, the mirror of this argument is similarly unfalsifiable. The American people will not accept significant reductions in funding for Social Security or for health care for senior citizens. The evidence in the form of current polling and political history that supports this version of the argument is just as strong, if not stronger, than the evidence for the tax version.21 And the same logic that presents 19 percent or 20 percent of GDP as a hard political limit on tax revenue argues for a hard political floor for primary spending at a much higher level.
In fact, the second worldview rejects both arguments. Nothing in the budget is fixed. There is neither some settled limit on tax revenues nor a sacrosanct floor on spending. Spending and tax levels are the products of policy choices—any changes in those policies should be judged on their own terms by comparing the effects of those changes to what would happen in the absence of those changes. It is not useful to judge them against arbitrary benchmarks, however cloaked in the language of historical averages they may be.
The budget debate, translated
Very often, the debate over the federal budget is carried out in a clash of one-line arguments. We have a spending problem, not a revenue problem. Or, tax cuts are to blame. These soundbites mask both the real argument and the real stakes.
The real argument is about whether the federal budget should be allowed to adjust to changing circumstances. If it is, then the increase in spending on Social Security, Medicare, and Medicaid that is an inevitable consequence of the aging of the U.S. population and the rise in economy-wide health care costs is not, in and of itself, a fiscal problem. It is only a problem if the tax system cannot generate sufficient revenue to finance those costs, which is what happened after repeated rounds of tax cuts over the past 25 years.
But, if instead, you start from the premise that tax revenue should always remain within a predetermined band of acceptable levels, then that increase in costs in Social Security, Medicare, and Medicaid, no matter the cause, is indeed a fiscal problem because you are holding taxes fixed. It necessitates either massive cuts to Social Security, Medicare, and Medicaid, or even more massive cuts to everything else in the federal budget, including investments in our nation’s economic future.
In the end, endless debates about who is to blame for our current fiscal situation only go so far. The fiscal history is plain.
At the turn of the 20th century, the budget outlook was stable. This was true even though everyone knew that spending was about to rise significantly due to cost pressures associated with a very foreseeable aging U.S. population in the first half of the 21st century. The reason the budget outlook was, nevertheless, stable was because higher than average revenue was expected to persist. In other words, both spending and revenue were expected to rise roughly in tandem so that deficits stayed manageable; but both would end up meaningfully higher than in previous experiences.
Policy changes since that time focused heavily on bringing revenues back into line with (or at times below) their historical average, but those changes did not focus on reducing spending. In fact, more often than not, new spending was added. Some of those additions were cyclical and temporary. Others have persisted, especially military spending in the 21st century.
The expected federal spending increases stemming from the foreseen aging of the U.S. population did indeed materialize, as projected, and they have contributed to pushing spending higher than the historical band. But they have not run past expectations, and in fact, those costs have come in lower than expected. The result is that spending today is higher than average but roughly equal to long-standing expectations. Revenue is roughly at its post-WWII average, but down significantly from when the budget outlook was last stable. (See Figure 12.)
Figure 12
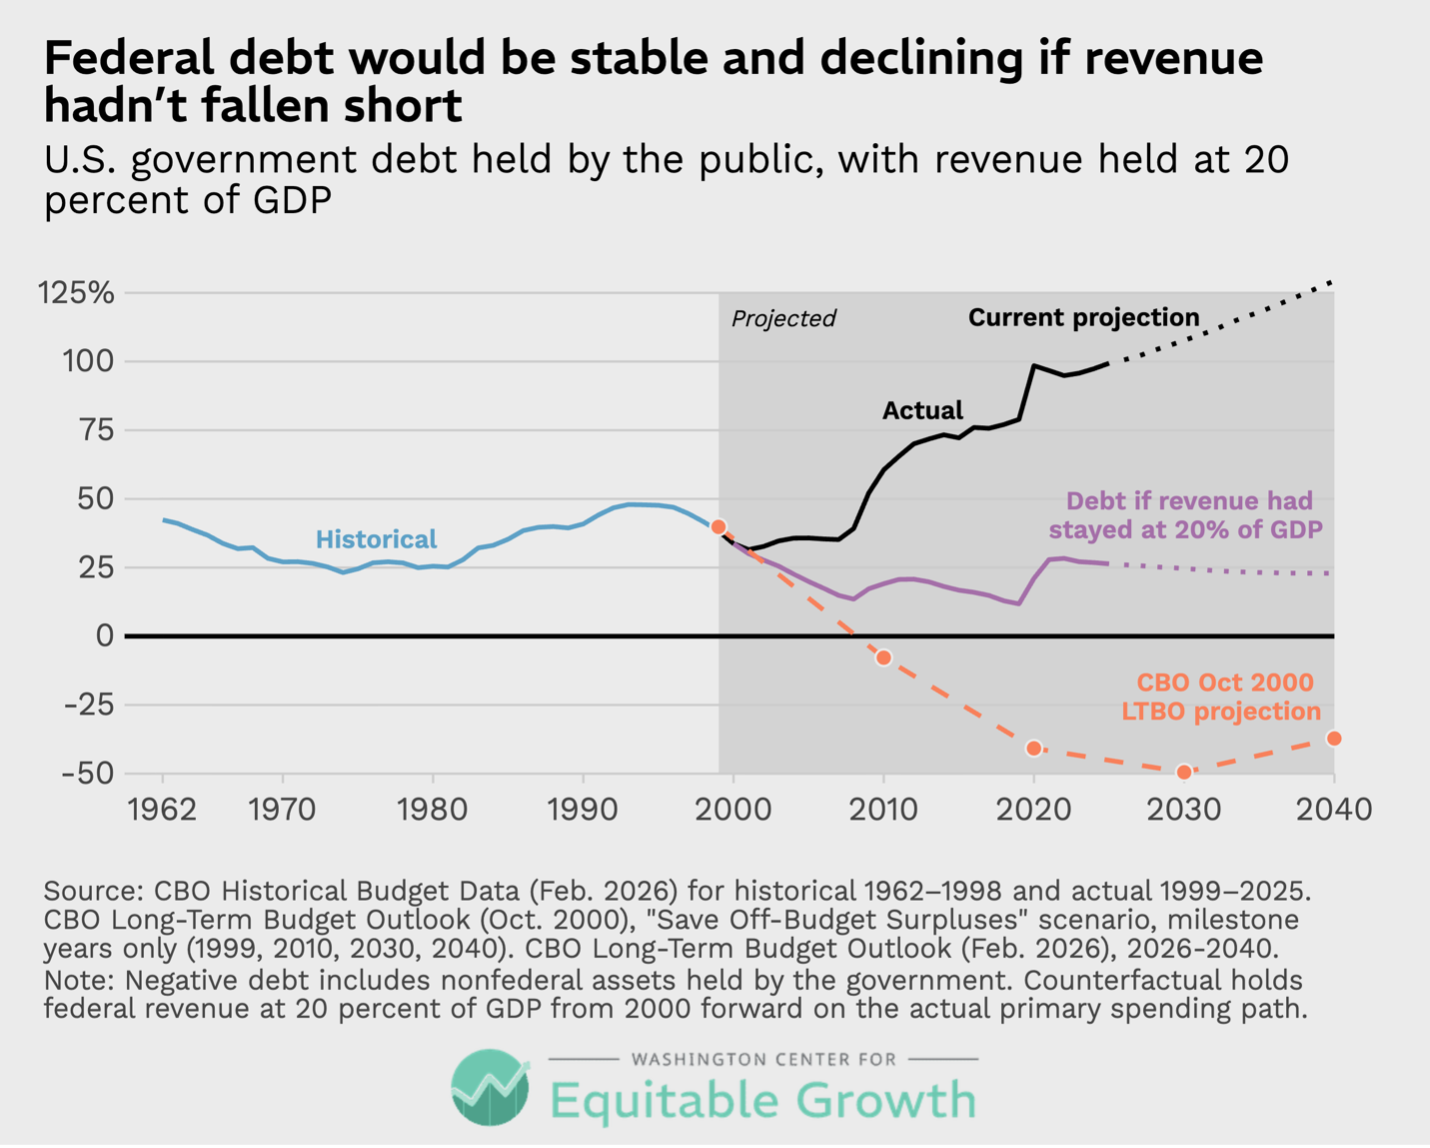
That is the fiscal history of the modern United States in a nutshell.
If federal policymakers look at this fiscal history and then argue that we have a spending problem, then what they are really saying, is “We prefer low taxes, even if it means higher deficits.” But if they look at this history and argue that tax cuts are the problem, then what they are really saying is, “We can and should provide health care and retirement security to senior citizens, but it will require higher taxes if we want to avoid excessive borrowing.”
Once again, both perspectives are valid, but only the second one takes fiscal responsibility seriously.
Did you find this content informative and engaging?
Get updates and stay in tune with U.S. economic inequality and growth!
End Notes
1. There are a handful of theoretically temporary tax provisions in place right now. For example, “no tax on tips” and a new larger deduction for senior citizens are both slated to expire after 2028. These temporary policies added roughly $50 billion to the deficit last year. Joint Committee on Taxation, Estimated Revenue Effects Relative to the Present Law Baseline of the Tax Provisions in “Title VII – Finance” of the Substitute Legislation as Passed by the Senate to Provide for Reconciliation of the Fiscal Year 2025 Budget (JCX-35-25), July 1, 2025, available at https://www.jct.gov/publications/2025/jcx-35-25/; and Joint Committee on Taxation, Estimates of Federal Tax Expenditures for Fiscal Years 2025-2029 (JCX-45-25), December 3, 2025, available at https://www.jct.gov/publications/2025/jcx-45-25/.
2. Author’s calculation from the Monthly Treasury Statement for August 2026, Tables 1 and 9, U.S. Treasury Fiscal Data, available at https://fiscaldata.treasury.gov/datasets/monthly-treasury-statement/. Eleven months are actual; September 2026 is estimated from the relationship between September and an average month in prior years, corrected for benefit payment timing shifts. Fiscal year GDP is the average of the four quarterly figures from the Bureau of Economic Analysis, available at https://www.bea.gov/data/gdp/gross-domestic-product, with the third quarter of 2026 estimated.
3. Office of Management and Budget, Historical Tables 1.1 and 6.1 (fiscal year 2027 vintage), over fiscal years 1946 through 2000, available at https://www.govinfo.gov/app/details/BUDGET-2027-TAB.
4. Congressional Budget Office, Historical Budget Data, February 2026, available at https://www.cbo.gov/system/files/2026-02/51134-2026-02-Historical-Budget-Data.xlsx. Major health care comprises Medicare, Medicaid, the Children’s Health Insurance Program and subsidies for health insurance purchased through the marketplaces, net of offsetting receipts.
5. Congressional Budget Office, The Long-Term Budget Outlook Data: 2026 to 2056, February 2026, extended baseline, available at https://www.cbo.gov/publication/62044.
6. Congressional Budget Office, The Long-Term Budget Outlook, October 2000, available at https://www.cbo.gov/publication/12749. Figures are reported on a national income and product accounts basis and are published for milestone years only: 1999, 2010, 2020, 2030 and 2040.
7. Social Security Board of Trustees, 1995 Annual Report, available at https://www.ssa.gov/oact/tr/TR95/index.html; Boards of Trustees of the Medicare Trust Funds, 1995 and 2002 Annual Reports, intermediate assumptions, available at https://www.cms.gov/research-statistics-data-and-systems/statistics-trends-and-reports/reportstrustfunds/trustees-reports-items/1992-1996 and https://www.cms.gov/research-statistics-data-and-systems/statistics-trends-and-reports/reportstrustfunds/downloads/tr2002.pdf. Trustees’ figures are gross: premiums are counted as income to the trust funds rather than as an offset to spending. The General Accounting Office reached the same conclusion in its own long-term simulations, first published in 1992 and updated in 1995 and 1997; see Budget Issues: Analysis of Long-Term Fiscal Outlook (GAO/AIMD-OCE-98-19, October 1997), available at https://www.govinfo.gov/app/details/GAOREPORTS-AIMD-OCE-98-19, and Budget Issues: Long-Term Fiscal Outlook (GAO/T-AIMD/OCE-98-83, February 1998), available at https://www.gao.gov/assets/t-aimd/oce-98-83.pdf.
8. Congressional Budget Office, The Long-Term Budget Outlook, October 2000, available at https://www.cbo.gov/publication/12749, and The Long-Term Budget Outlook Data: 2026 to 2056, February 2026, available at https://www.cbo.gov/publication/62044. The 2000 figures are on a national income and product accounts basis.
9. It is notable that the 2000 projections were before the expansion of Medicare in 2003 with the addition of Part D, as well as the expansion of Medicaid in 2010 and the addition of the Affordable Care Act tax credits in 2010. Despite these expansions of coverage and benefits, total spending on health care has been lower than expected.
10. Author’s calculation from Office of Management and Budget, Historical Tables 1.1 and 6.1 (fiscal year 2027 vintage), fiscal years 1946 through 2000, available at https://www.govinfo.gov/app/details/BUDGET-2027-TAB.
11. Author’s calculation from Office of Management and Budget, Historical Tables 1.1 and 6.1 (fiscal year 2027 vintage), available at https://www.govinfo.gov/app/details/BUDGET-2027-TAB. OMB does not publish gross domestic product before 1930; for earlier years the denominator is calendar year nominal GDP from Louis Johnston and Samuel H. Williamson, MeasuringWorth, available at https://www.measuringworth.com/datasets/usgdp/.
12. Author’s calculation from Office of Management and Budget, Historical Tables 1.1 and 6.1 (fiscal year 2027 vintage), fiscal years 1950 through 2000, available at https://www.govinfo.gov/app/details/BUDGET-2027-TAB.
13. Gallup, January 2 to 7, 2018, among 1,024 adults: 33 percent approved of the new tax law and 55 percent disapproved, available at https://news.gallup.com/poll/225137/americans-remain-negative-tax-bill-passage.aspx. On the 2025 law, see the KFF polling cited below in endnote 20.
14. Congressional Budget Office, Estimated Budgetary Effects of Public Law 119-21, to Provide for Reconciliation Pursuant to Title II of H. Con. Res. 14, Relative to CBO’s January 2025 Baseline, July 21, 2025, available at https://www.cbo.gov/publication/61570. Over the 2025–2034 period CBO estimates that the law reduces revenues by $4.5 trillion and reduces outlays by $1.1 trillion, for a net increase in the deficit of $3.4 trillion. The outlay figure is a net change, combining reductions in Medicaid, nutrition assistance and student loan programs with increases for defense, border security and other functions.
15. Since 2000, the CBO—following the Bureau of Economic Analysis—changed its concept of GDP several times, most consequentially in 2013, when it began treating research and development spending as investment rather than as a cost of doing business. The effect was to raise the measured level of GDP. The consequence is that applying a modern GDP concept to older projections would reduce any statistic reported as a percent of GDP by about 4 percent. So projected revenue levels that were reported as being 20 percent of GDP would today be reported as being about 19.2 percent of GDP. This adjustment only applies to old projections. Historical data already uses a modern conception of GDP.
16. This is true even after accounting for the revenue effects from an assumption that the Alternative Minimum Tax would remain frozen. CBO’s revenue estimates from 2012, fully stripping out their reported AMT effect, still yielded revenue near 20 percent of GDP. Capital gains tax collections are from the Department of the Treasury, Office of Tax Analysis, taxes paid on capital gains for returns with positive net capital gains, by tax year, available at https://home.treasury.gov/system/files/131/Taxes-Paid-on-Capital-Gains-for-Returns-with-Positive-Net-Capital-Gains-12202016.pdf, divided by fiscal year GDP from OMB Historical Table 6.1, available at https://www.govinfo.gov/app/details/BUDGET-2027-TAB. Because receipts are reported by fiscal year and capital gains taxes by tax year, the subtraction is approximate at the edges. Revenue projections are from Congressional Budget Office, The Budget and Economic Outlook: An Update, July 2000, Table 1-2, available at https://www.cbo.gov/publication/12477, and The 2012 Long-Term Budget Outlook, June 2012, extended baseline scenario, available at https://www.cbo.gov/publication/43288.
17. Author’s calculation from Office of Management and Budget, Historical Tables 1.1 and 6.1 (fiscal year 2027 vintage), available at https://www.govinfo.gov/app/details/BUDGET-2027-TAB. Revenue reached 20.5 percent of GDP in fiscal 1944 and 20.0 percent in fiscal 2000; no other year since 1901 reaches 20 percent. OMB does not publish gross domestic product before 1930; for earlier years the denominator is calendar year nominal GDP from Louis Johnston and Samuel H. Williamson, MeasuringWorth, available at https://www.measuringworth.com/datasets/usgdp/.
18. Author’s calculation from Office of Management and Budget, Historical Tables 1.1 and 6.1 (fiscal year 2027 vintage), available at https://www.govinfo.gov/app/details/BUDGET-2027-TAB. OMB does not publish gross domestic product before 1930; for earlier years the denominator is calendar year nominal GDP from Louis Johnston and Samuel H. Williamson, MeasuringWorth, available at https://www.measuringworth.com/datasets/usgdp/.
19. Organisation for Economic Co-operation and Development, Revenue Statistics 2025, Table 1, total tax revenue as a percentage of gross domestic product, available at https://www.oecd.org/en/publications/revenue-statistics-2025_3a264267-en.html. On provisional 2024 figures the United States collected 25.6 percent of GDP against an OECD unweighted average of 34.1 percent; only Mexico, Colombia, Chile, Ireland, Türkiye, Costa Rica and South Korea collected less. Federal revenue was 17.0 percent of GDP in fiscal 2024, so reaching 20 percent would add three points and raise the United States total to roughly 28.6 percent, moving it from eighth to ninth from the bottom among the countries reporting provisional 2024 figures, and leaving it more than five points below the OECD average.
20. On the 2025 law, KFF Health Tracking Poll, conducted June 4–8, 2025 among 1,321 adults: 64 percent held an unfavorable view against 35 percent favorable, available at https://www.kff.org/medicaid/kff-health-tracking-poll-views-of-the-one-big-beautiful-bill/. On attitudes toward taxation, Pew Research Center, surveyed January 20–26, 2026 among 8,512 adults: 61 percent say they are bothered a lot by the feeling that some wealthy people do not pay their fair share and 60 percent say the same of corporations, while 60 percent say that they themselves pay more than their fair share, available at https://www.pewresearch.org/short-reads/2026/04/06/top-tax-frustrations-for-americans-feeling-that-some-wealthy-people-corporations-dont-pay-fair-share/.
21. Associated Press-NORC Center for Public Affairs Research, conducted March 16–20, 2023 among 1,081 adults: 79 percent opposed reducing Social Security benefits and 67 percent opposed raising Medicare premiums, while 58 percent supported raising taxes on households earning more than $400,000 a year to fund Medicare, available at https://apnorc.org/wp-content/uploads/2023/06/APNORC_Mar2023_Topline.pdf.
Related





Explore the Equitable Growth network of experts around the country and get answers to today's most pressing questions!
Stay updated on our latest research