Overview
Public investments in education, in both physical structures and in services, are key to long-run economic growth and human well-being. Some of these investments are especially effective in promoting more equitable economic growth—economic growth that is not only enduring and substantial but also narrows an array of economic inequalities by benefitting the vast majority of the populace, including the middle class in general and those at the lower end of the income distribution in particular. Many of those hit hardest by the coronavirus pandemic and the recession it sparked—among them front-line employees and their families, especially employees and families of color—benefit the most from these investments in education.
Certain types of public investments in education pay for themselves in the form of economic growth, additional tax revenues, and long-term savings on public expenditures. What’s more, some education investments, if financed properly, can provide a significant macroeconomic stimulus to help jump-start our depressed economy into a sustained recovery. In short, public investments in education can address some of our most urgent economic needs by rapidly inducing greater economic activity and higher earnings, and quickly putting people back to work once the devastating coronavirus outbreak is effectively contained.
Download FilePublic investments in education can spur equitable growth, pay for themselves, and create jobs for a stronger economic recovery
This paper examines the importance of educational physical structures and services, and details how public investments in education affects economic growth and human well-being. The paper then provides three examples of interrelated and complementary public investments in education, specifically high-quality:
- School facilities
- Pre-Kindergarten services
- Kindergarten through grade 12 educational services
Each of these investments will rapidly increase Gross Domestic Product, create jobs, and largely pay for themselves while providing a host of other social benefits. Here are the three broad summaries of the detailed findings in this report of today’s value—the present value—of the costs and benefits of the investment that occur over set periods of investment:
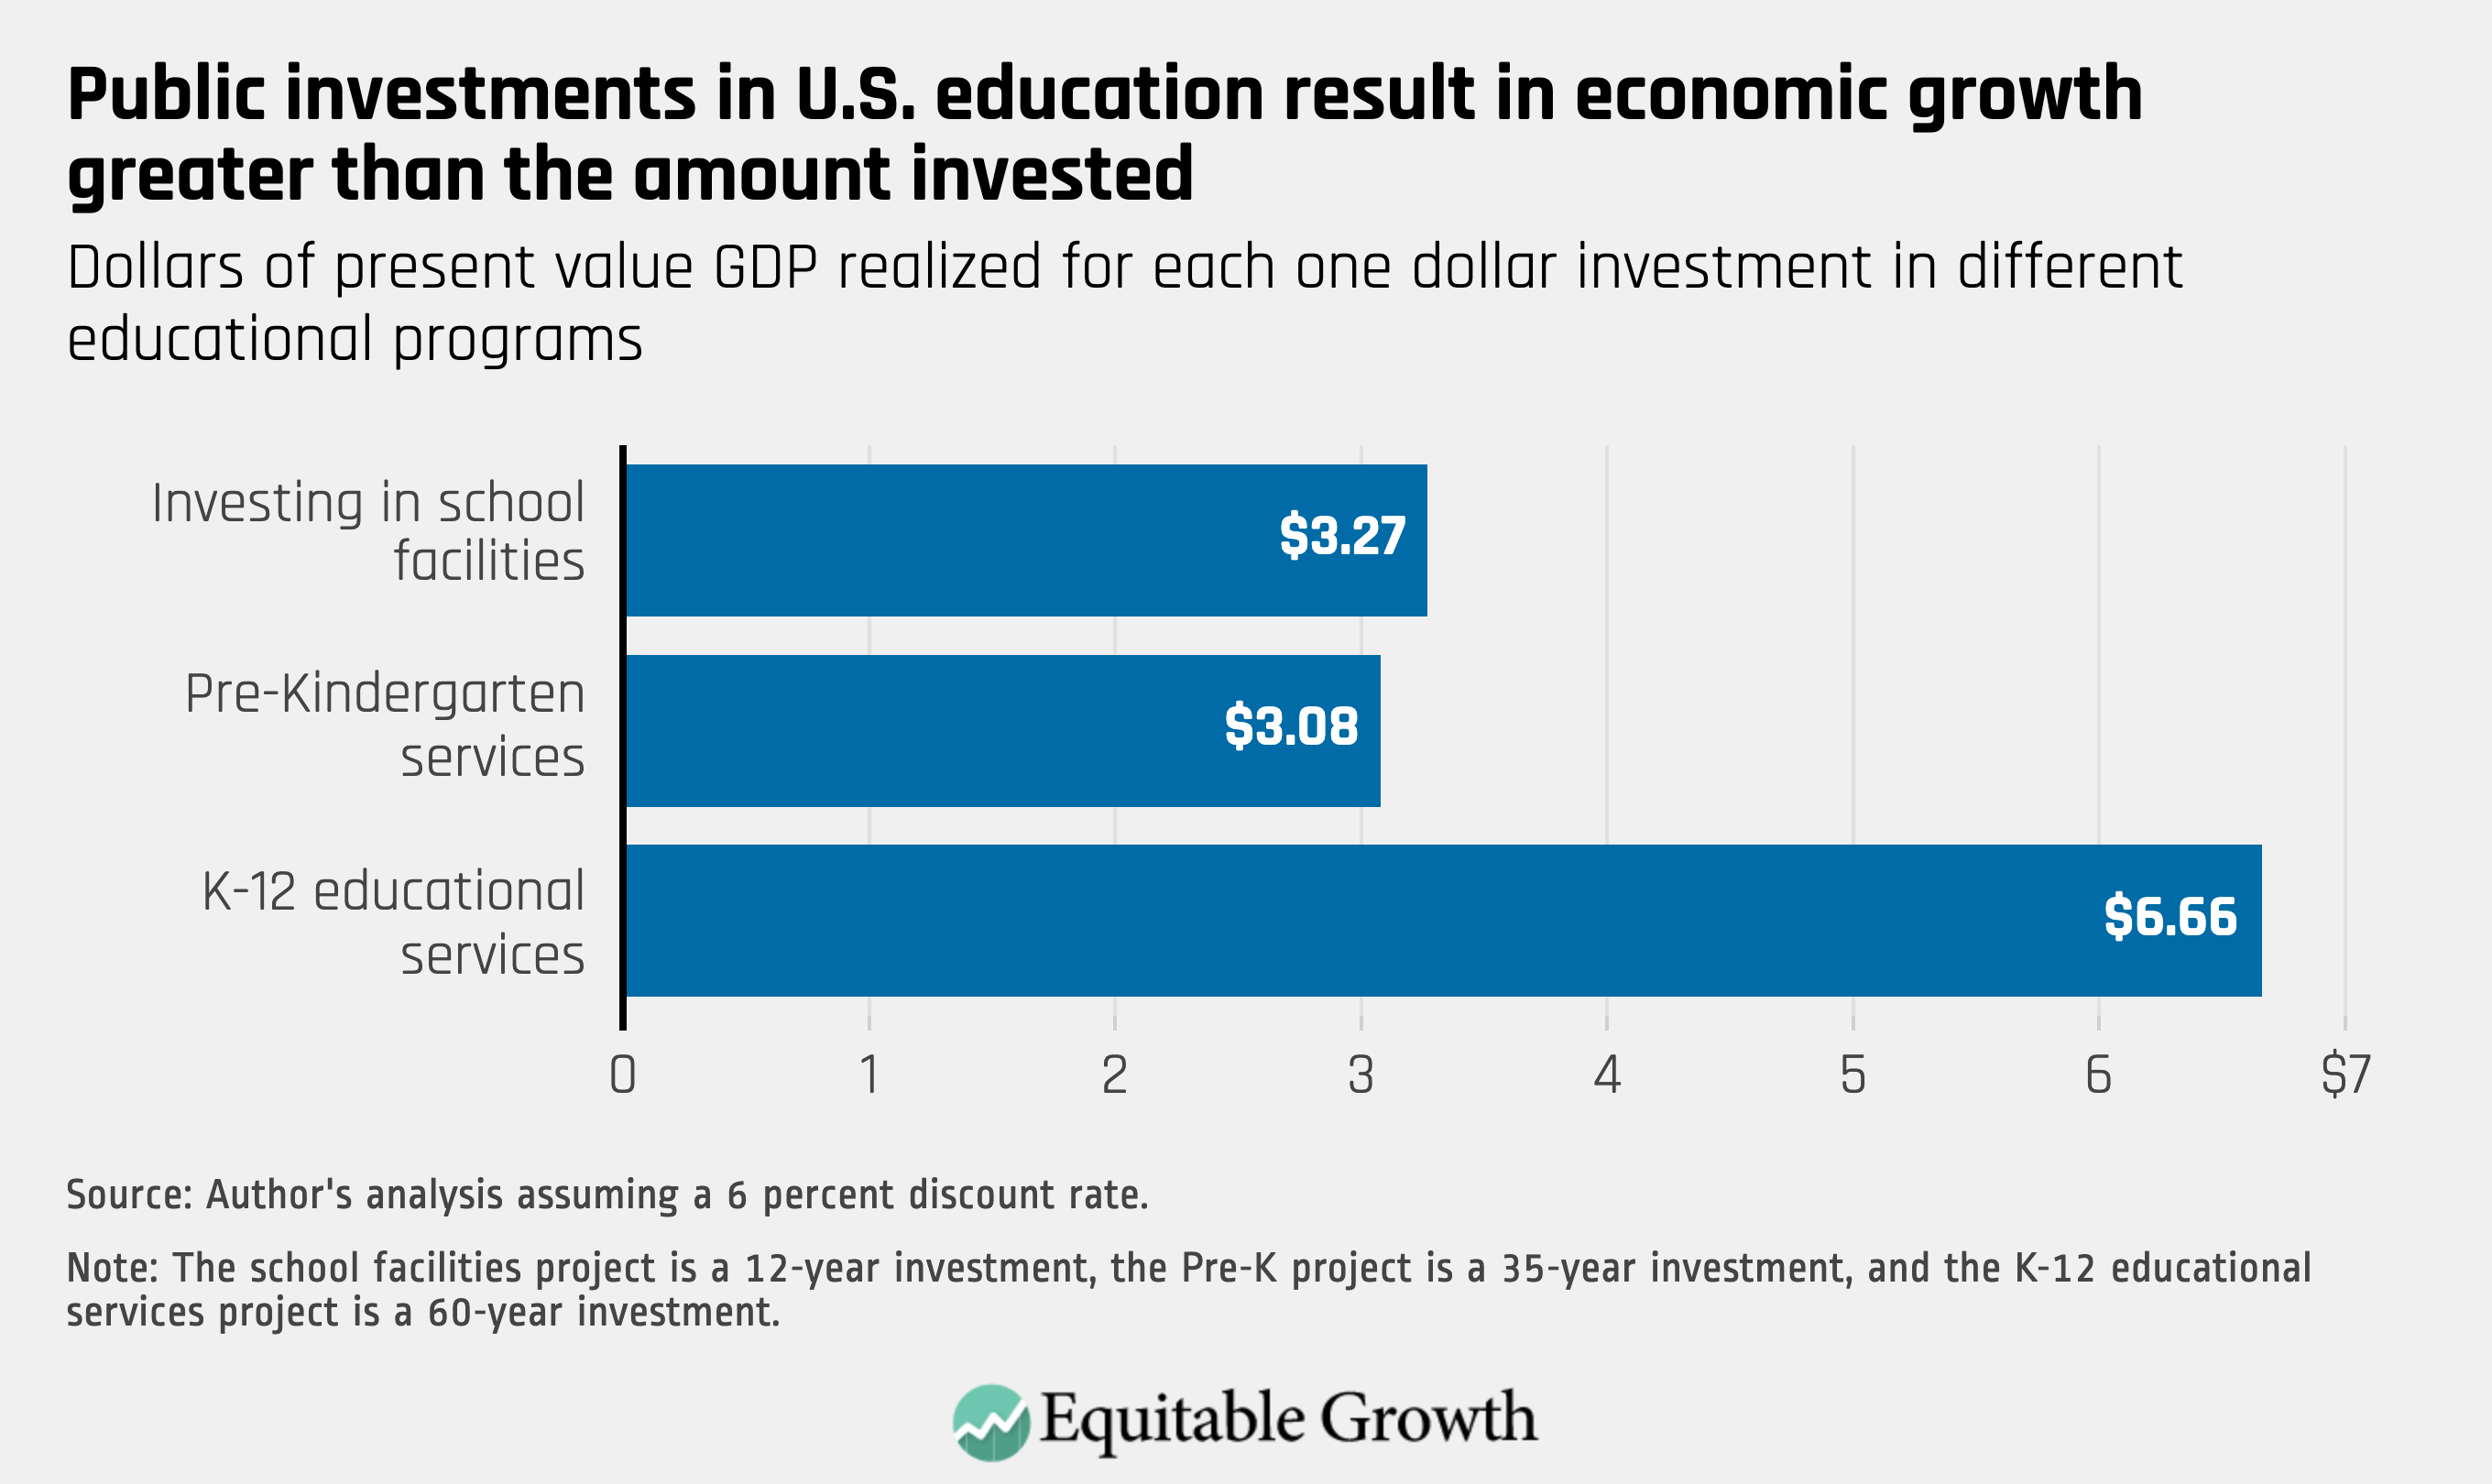
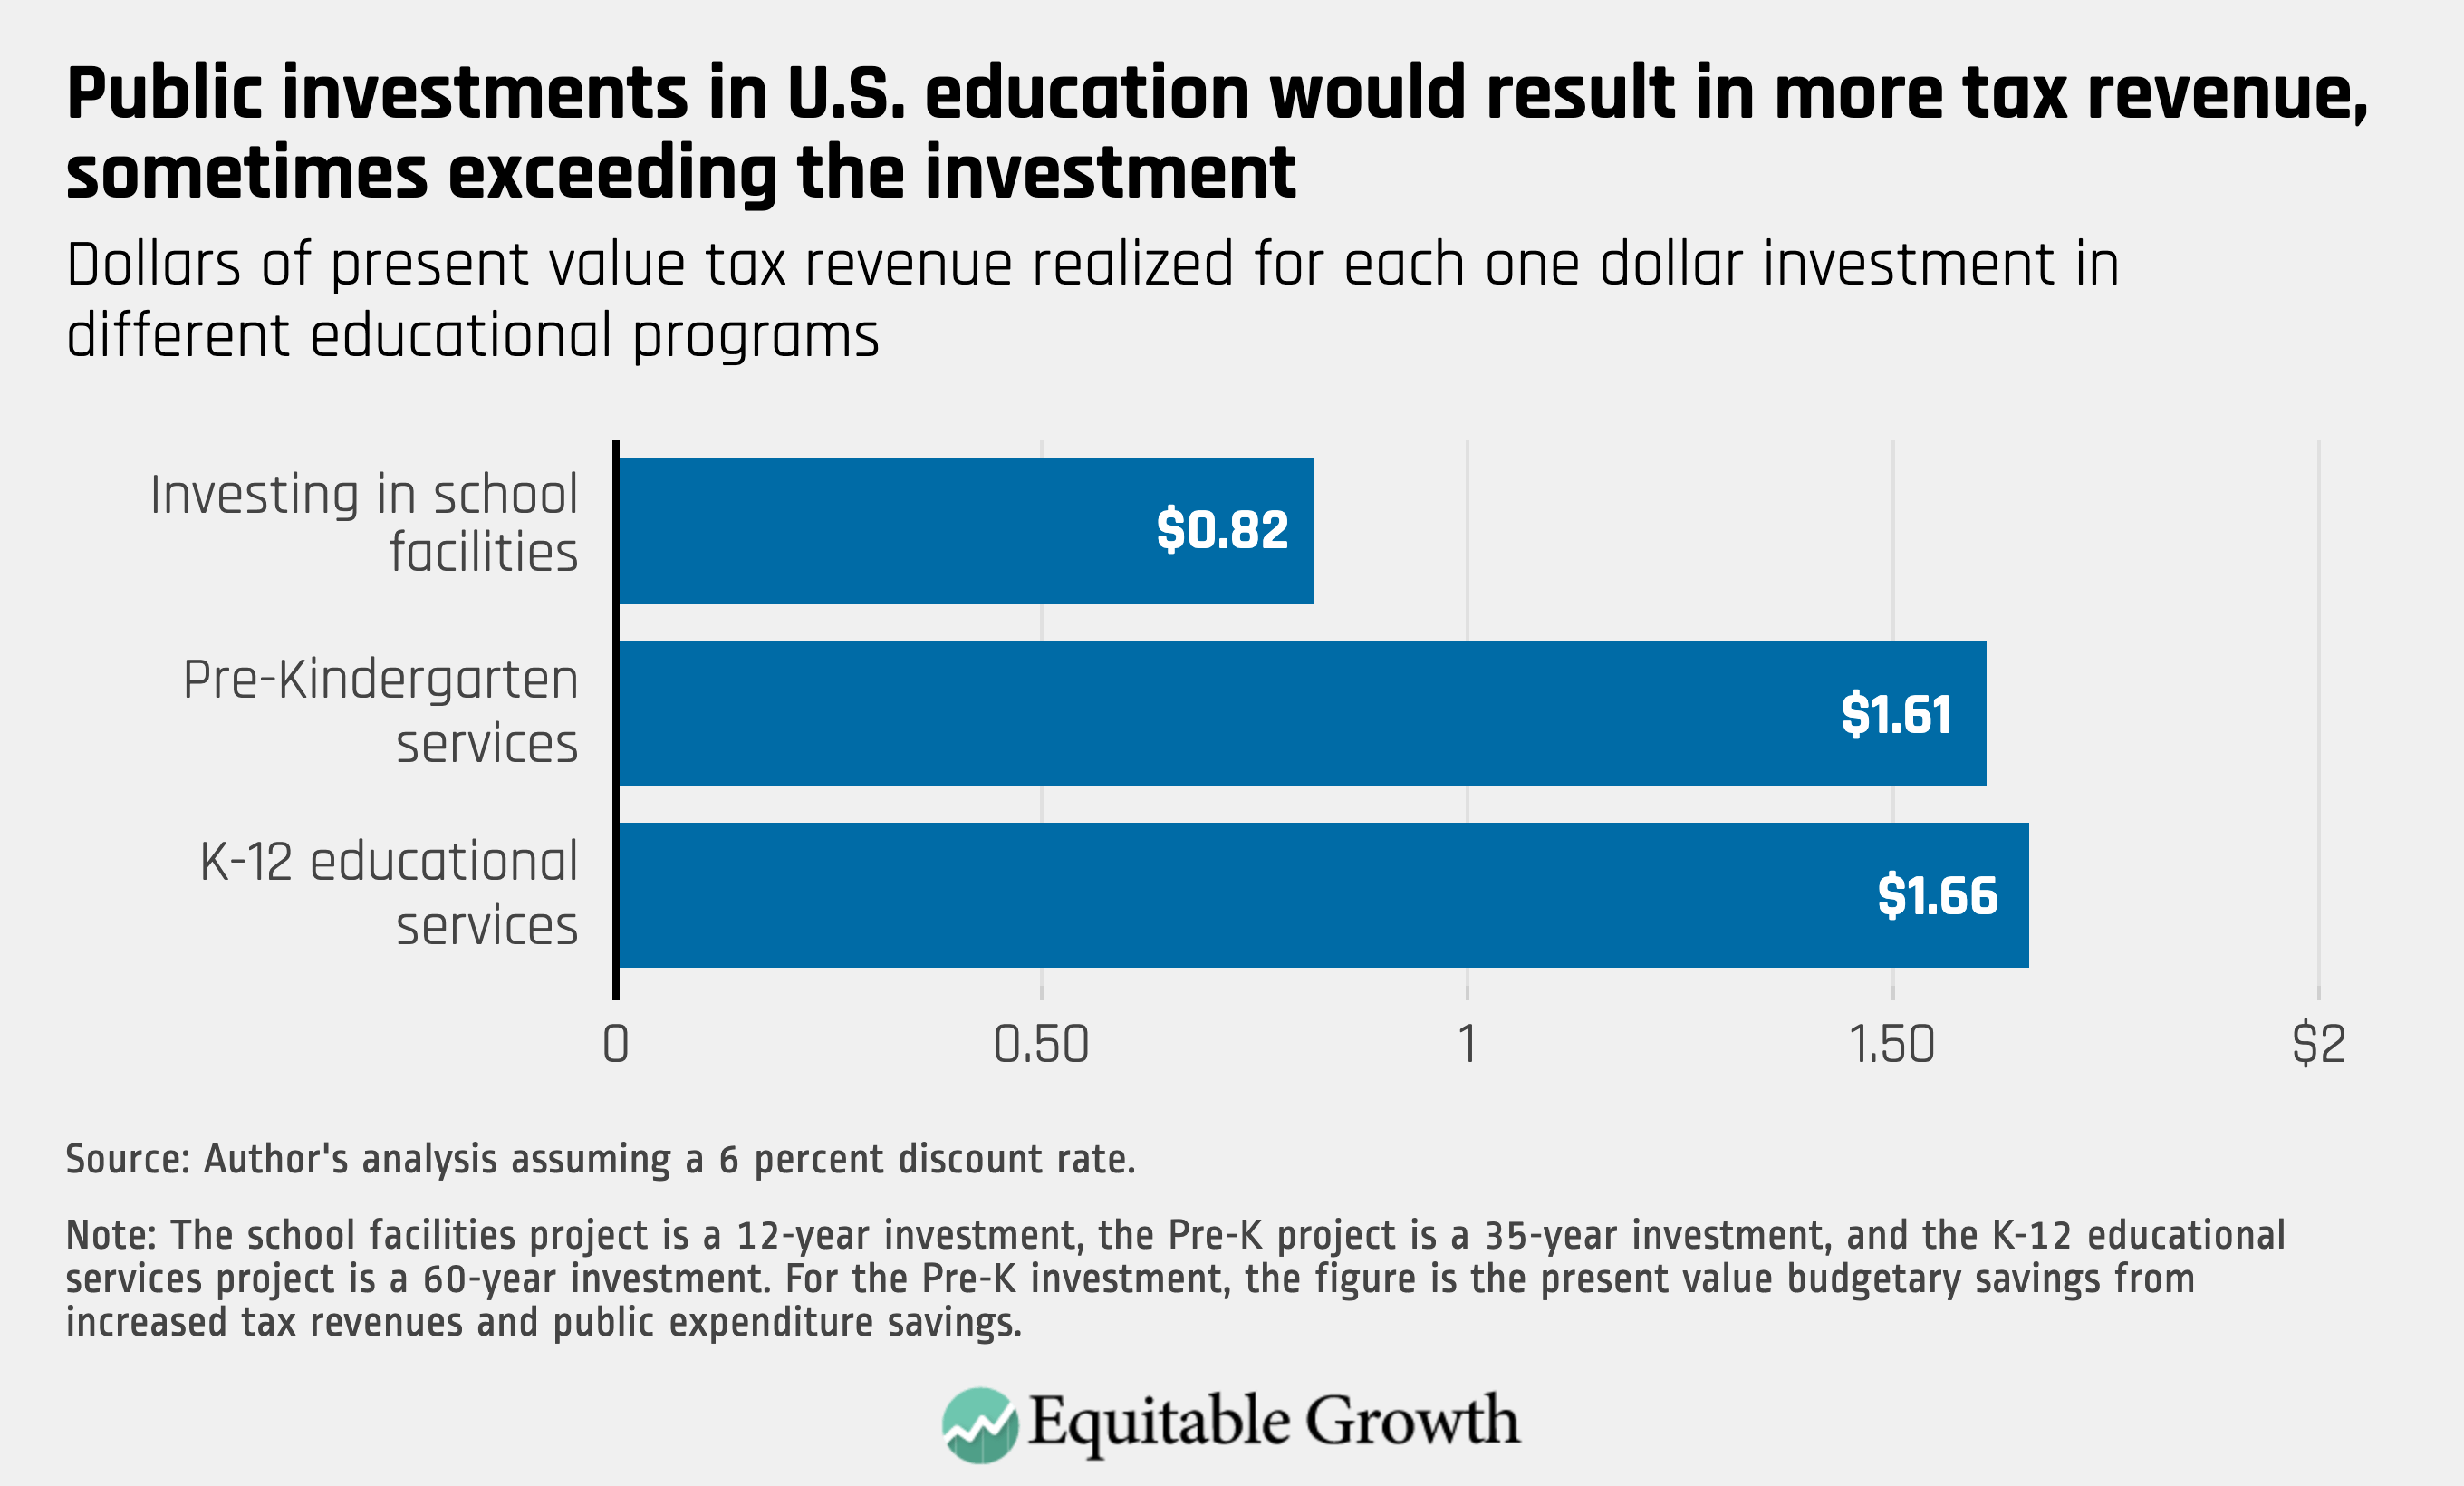
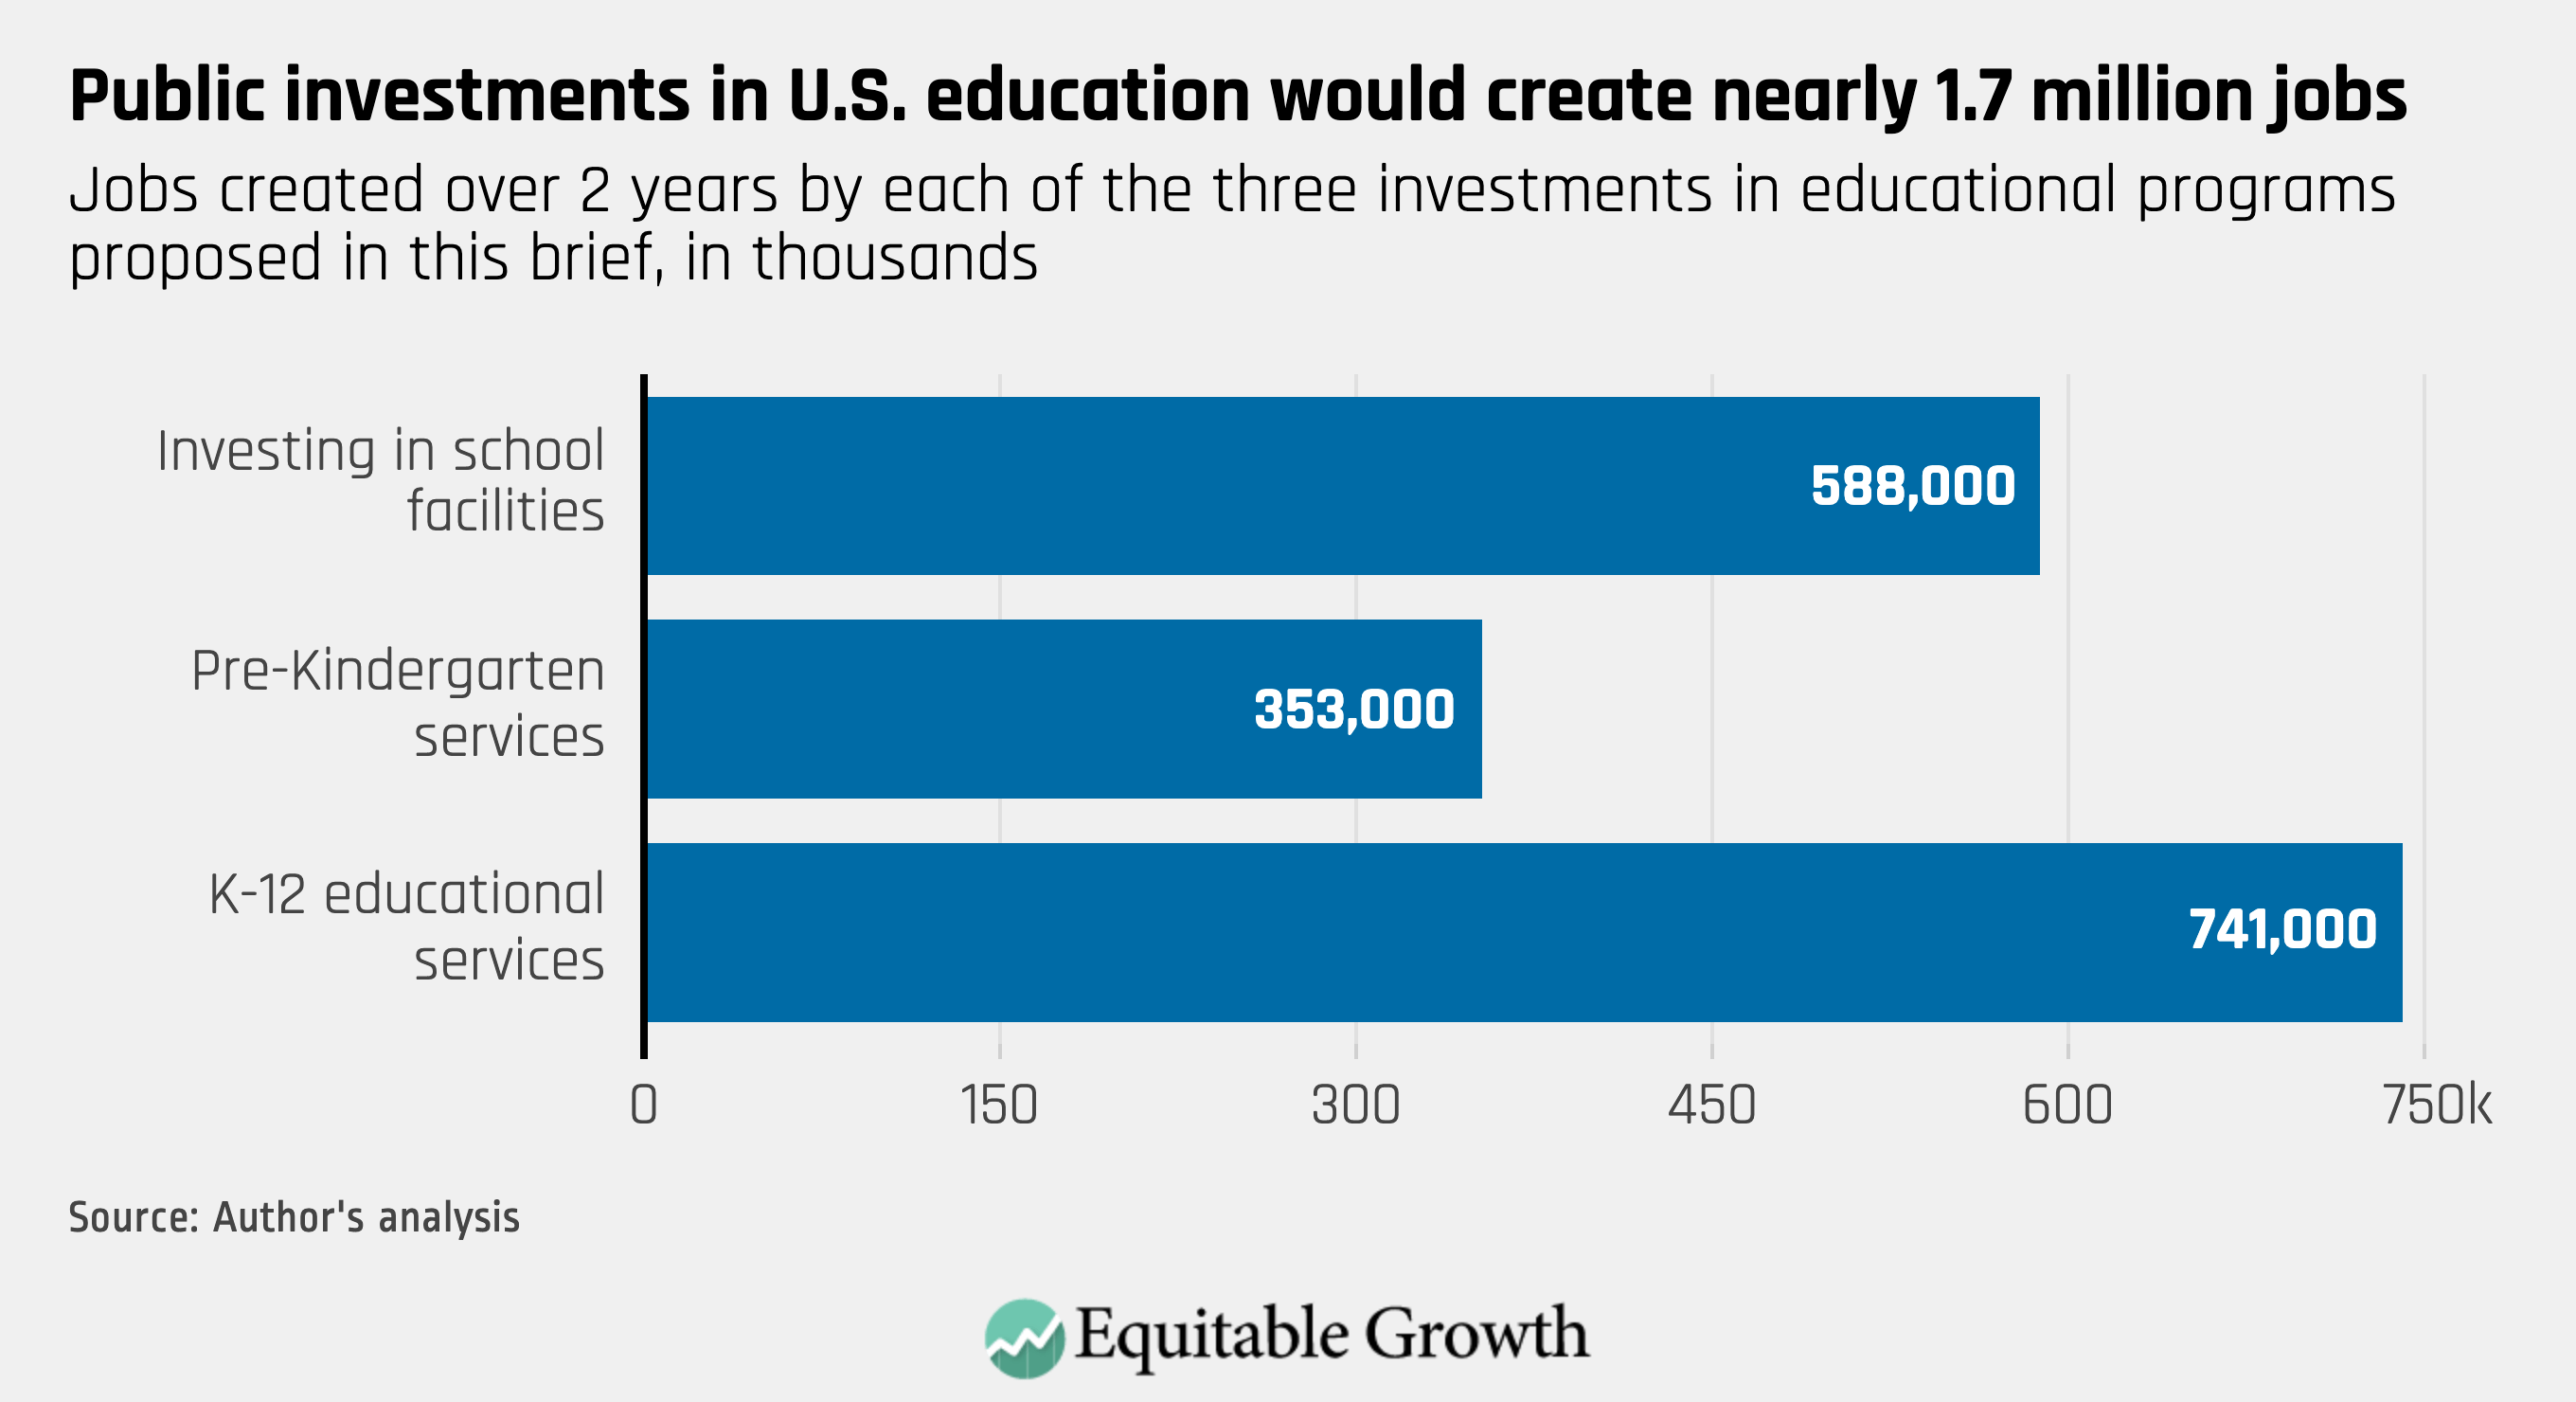
- A $50 billion annual investment in school facilities over 12 years generates an increase in present-value GDP that exceeds the cost of the investment by a ratio of 3.27-to-1 and creates 588,000 jobs over the first 2 years that persist over the course of the 12-year investment period. In addition, the investment produces additional present-value tax revenues that cover 82 percent of the cost of the proposal.
- A $30 billion annual public investment in high-quality pre-K schooling over 35 years causes an increase in present-value Gross Domestic Product that outstrips the cost of the investment by $3.08 for every dollar invested and creates 353,000 jobs within 2 years. The present-value budgetary savings from increased tax revenues and expenditure savings surpass the cost of the program by a ratio of 1.61-to-1. This means that the investment more than pays for itself both in the form of greater GDP and budgetary savings.
- A $63 billion annual investment in K-12 educational services over 60 years increases present-value GDP by 6.66 times the cost of the program and creates 741,00 new jobs. The investment also generates an additional $1.66 in present-value taxes for every dollar of its cost, meaning the investment pays for itself in budgetary terms alone, as well as in GDP growth.
After briefly discussing the economic importance of infrastructure and investments in education, this report details the economic and financial calculations that undergird these estimates of increased economic growth, jobs growth, and tax revenue growth. It then closes with an analysis of current policy considerations to explain why it would be best to finance these annual investments over the next several decades with debt rather than tax increases or savings from reductions in other public expenditure programs.
There may be some policymakers who might choose to ignore the important socioeconomic benefits these investments would generate—investments sorely needed after nearly a half century of sluggish growth, stagnating median incomes, and rising economic inequality—but importantly, all three investments pay for themselves in growth and income, and largely pay for themselves from the narrow perspective of government budgets. Together, these investments will promote rapid and equitable economic growth that narrows inequalities, creates jobs, and improves the quality of life for millions today and in the future.
The importance of infrastructure

Infrastructure of all sorts plays a vital role in the U.S. economy, much in the way a skeleton and circulatory system are central to the functioning of the human body. Infrastructure enables various other components of the economy to function and thrive. It allows workers, consumers, firms, and markets to produce, exchange, and consume goods and services in an effective and efficient manner. Just as the health and growth of the human body requires the upkeep and maintenance of our skeleton and circulatory system, the health and growth of our economy requires investments in the maintenance, repair, and improvement of our economic infrastructure.
In its broadest sense, infrastructure refers to both physical structures and services without which the private sector of the economy cannot function effectively.1 Physical infrastructure includes school buildings but also roads, bridges, ports, airports, energy grids, communication networks, water supply facilities, and hospitals. Service infrastructure, often referred to as soft infrastructure, includes a variety of complementary systems that provide services, such as the education system, as well as healthcare, legal, research, statistical, informational, regulatory, and financial systems. Both the physical and service components of infrastructure are required in the production and exchange of virtually all goods and services. Likewise, both components are fundamental to the enrichment, promotion, and enhancement of human happiness, comfort, and security.
Infrastructure is often referred to as “social overhead capital.” It consists of goods and services that are basic to economic activity because their use is required for private-sector production regardless of the specific nature of that production, whether it be an automobile, an article of clothing, or a computer. Thus, social overhead capital may be best understood in comparison to “directly productive capital,” which refers to physical capital in the form of machinery, equipment, tools, and factories designed to produce final goods or services. Social overhead capital, by contrast, provides the intermediate goods and services that make possible the efficient use of directly productive capital in the production of final goods and services.
Think of the relationship between private production and infrastructure in the following ways. It is difficult for a private auto firm to produce and sell cars without the existence of an educated workforce and a network of roads. It is challenging for a doctor or teacher to provide health or education services without hospitals and school buildings. And it is impossible for workers to be fully productive in the absence of adequate education services and clean drinking water. Thus, public investments in infrastructure in general—and in education in particular, as explained in more detail below—are central to the economic development of our nation and the human well-being of our society.
How public investments in education promote economic growth and human well-being
Both theoretical and empirical research suggest that investments in the quantity and quality of education are important determinants of productivity and economic growth. Education, by adding to human capital (the education, training, and health of workers), increases labor productivity (output per worker), which, in turn, propels growth to higher levels.2 Education creates new knowledge, technologies, and products that promote innovation and progress.3
Education also accelerates the diffusion and transmission of new knowledge through the workforce, which allows a wider use of cutting-edge technology and advanced equipment and, in turn, spurs economic growth.4 Although the distinction between the two is not always easy to tease out from the available data, research also shows that the quality of education services matters as much, if not more so, as the quantity of time children spend in school.5
Better-educated people tend to be healthier than those with less education.6 Thus, when governments invest in education, the quality of the workforce improves and output grows because better-educated and healthier workers are more productive. In addition, the quality of life of those workers and their families improve as they are not only better educated and healthier, but also earn higher wages and thus are able to consume more food, clothing, shelter, and other amenities. By increasing the stock of both physical capital and human capital, public investments in education increase productivity, which is a long-run driver of economic growth and earnings.
Public investments in education can also leverage private investment and job creation, and thus promote faster growth. When governments build schools and hire teachers in an area to provide high-quality education services, they encourage private entrepreneurs to invest in that area. In other words, public investments in education may precede and encourage private investment, thereby spurring growth. In the economic literature, this phenomenon is often referred to as the “crowding-in” effect of public infrastructure investments.
The construction of schools by itself can spur economic growth by creating employment and income for workers and their families. This macroeconomic stimulus effect is most pronounced during economic downturns, when there is high unemployment, monetary policy that keeps interest rates low, and the investments are financed by borrowing rather than by savings generated by cutting other government expenditures or by revenues from higher taxes. And the investments can enhance well-being by crafting a desirable public service. The building of a new school building, for example, can create thousands of new construction, teaching, and other jobs, and provide a convenient educational service that improves the quality of life of the citizens who have access to the new facility and educational services.
Public investments in education can bring about various forms of justice by correcting the inequitable distribution of social and economic resources by income, race and ethnicity, and gender, as well as maximize economic growth and human well-being. When education is produced and bought in the private sector, it will often be inadequate in supply, unevenly located, and serve the needs of the most well-off. This exacerbates economic inequalities and income-, racial-, ethnic-, and gender-based disparities. The private market will provide education only to those willing and able to pay for the product, not necessarily to those who made the largest efforts to produce income or with the greatest need or who would benefit the most from the service.
Family income and wealth, which determines their ability to pay for privately produced education, can be related to work effort but may also have little correlation with merit and productivity. Instead, family income and wealth may be a function of a host of other factors, such as inheritance, power, race and gender discrimination, theft, fraud, and deceitfulness. In addition, a growing body of economic research demonstrates that inequality, including in the distribution of education, can constrict and weaken growth, undermine the competitiveness of the economy, and reduce social welfare.7
This is why public investments in education are critical—to ensure they are shared equitably to overcome racial and gender discrimination in the distribution of the benefits of education, and to rectify harms committed in the past by the unfair distribution of education and the economic benefits it provides. These equity benefits are in addition to the positive impacts that public investments have on boosting worker productivity and maximizing economic growth.
Public investments in education also can improve economic outcomes because of the existence of two well-known market failures in the private production and exchange of education services. These two market failures, which economists call positive externalities and imperfect information, cause the private production and consumption of education to be inadequate and inappropriate—shortcomings that public investments can help to correct.
Consider first how education sometimes suffers from positive externalities. This means the benefits of education are not always fully captured by the buyer, causing the private sector to underproduce the optimal amount of the good. Say an educational service costs $15,000 to produce and generates $10,000 in benefits to a student in the form of higher future earnings and another $10,000 in benefits to society in the form of greater future production and tax revenue from the better-educated student and subsequently higher-paid worker. Given that the total benefits to the student and society ($20,000) exceed the total costs ($15,000) of the service, it would be best for the economy to produce the service. But if left to the private market, the educational service will not be produced and sold because the student will not pay $15,000 (the total costs) for a product that only generates $10,000 in benefits to the student. Consequently, for an adequate amount of education, public investments are required.
The market for education suffers from information failures, too. This happens when the buyer does not have access to the same information as the seller about the quality and prices of the services being exchanged. A private producer of education services has a monetary incentive to retain control of the information and exaggerate its effectiveness to increase sales and the selling price. If consumers do not have accurate or adequate information about the quality of education services, then they cannot spend their money efficiently to buy the services in quantities that make them most well-off. This may cause the consumer to purchase inappropriate quantities of the product: too much, or the wrong type, of education.
Information failures may be particularly pronounced in the provision of education services. After all, a main reason why consumers purchase education services is precisely because they lack the information that the producers own. Evidence from the U.S. Department of Education’s National Center for Education Statistics illustrates this market failure in education by debunking the widely held notion that private schools, on average, are more effective than public schools. Adjusted for the characteristics of children (such as race and gender, and family income as indicated by eligibility for free or reduced meals), children in public schools scored higher in fourth grade mathematics, equally well in fourth grade reading and eighth grade mathematics, and less well on eighth grade reading than children in private schools.8
Yet parents pay thousands of extra dollars annually to purchase private school education services for their children. Public investments in the quantity and quality of local public education services could bring about a more appropriate expenditure of consumer dollars on education by inducing parents to enroll their children in public schools.
For all of these reasons, public investments in education are essential to economic growth and human well-being. To be sure, there are costs to doing so and difficult choices must often be made about which investment projects to pursue. Still, some investments in infrastructure stimulate brisk and equitable economic growth that reduce inequalities, ameliorate the quality of life for millions, and pay for themselves over time. Pursued in a coordinated fashion, they complement each other and increase the returns to each asset.
Three examples of high-payoff and complementary public investments in infrastructure include investments in school physical infrastructure, in high-quality pre-K education services, and in K-12 education services. The net benefits of each of these investments, in terms of economic growth, job creation, tax revenue growth, and inequality tapering, are described below.
Public investments in education that can spur equitable growth, create jobs, and pay for themselves
The U.S. economy is in the midst of its sharpest, and perhaps most severe, economic downturn in history. Dramatic cutbacks in spending by households and businesses due to the severity of the coronavirus pandemic and the recession it caused, alongside the disastrous response to the pandemic, have resulted in record levels of unemployment not experienced since the Great Recession. Large swathes of the private sector today are increasingly unable to sell the goods and services they produce, leading to the layoffs of tens of millions of workers, contributing to further wage losses, spending drops, and economic decline.
This shortfall in aggregate demand for goods and services compounds two pre-existing problems that became acute in the United States in the 1970s: the long-run deceleration in productivity growth and growing economic inequality.9 Productivity is the output generated by an average hour of work. The pace of productivity growth largely determines long-run wage and economic growth. Hence, slowdowns in productivity growth lead to deteriorating wage and economic growth. Productivity deceleration exacerbates the effects of growing income and wealth inequality by reducing the growth in the size of the economic pie that is available to be shared.
Sustained increases in public investments in education can address all three of these issues: the immediate economic catastrophe once the pandemic is brought under control, income inequality as an economic recovery takes hold, and the long-term waning of productivity growth by alleviating shortfalls in aggregate demand, providing services to our most underserved people and promoting private-sector productivity. By boosting demand, productivity, wages, and economic growth, some forms of public education investments will raise tax revenues and partially or totally pay for themselves over time.
This section of the report details three investments in education that can create jobs, spur equitable growth, and pay for themselves. Specifically, investments in:
- Schools’ physical infrastructure
- High-quality pre-Kindergarten services
- High-quality kindergarten through grade 12 educational services
These three educational investments promote widely shared or equitable growth because they positively affect middle- and lower-income families more than the most advantaged families. Here’s a snapshot of their investment returns in terms of net present value GDP. (See Figure 1.)
Figure 1
These investments are also synergistic and interdependent. The combined benefits of the group of them are thus likely to be larger than their individual benefits. Here’s a snapshot of how these investments would largely pay for themselves in tax revenues over time. (See Figure 2.)
Figure 2
Moreover, these investments would lead to the creation of more than one-and-a-half million new jobs over two years. Here’s a snapshot of where those jobs would be created. (See Figure 3.)
Figure 3
Let’s now examine in detail how each of these investments—in schools’ physical infrastructure, in high-quality pre-Kindergarten services, and in high-quality kindergarten through grade 12 educational services—result in these progressive economic gains.
Public investments in schools’ physical infrastructure
Schools are essential for the transfer of knowledge to children, the creation of knowledge by those children when they become adults, and the building of a productive workforce in the future. Good schools enable us to compete globally by reducing achievement gaps with the rest of the world and with each other, so that children from disadvantaged backgrounds across the United States can both contribute and benefit as much as children from advantaged backgrounds. Public investments in the physical infrastructure of schools strengthens education and drives worker productivity, economic growth, jobs, earnings, tax revenues, and, eventually, social amenities in the form of first-rate public services.10
School physical infrastructure in the United States is in poor condition, contributing to the impairment of instruction and learning and undermining the health and safety of students, teachers, and staff. Issues such as mold, poor ventilation, and problems controlling temperature and humidity can trigger asthma, allergies, and respiratory problems that undermine student performance.11 All of these poor conditions are particularly dangerous amid the coronavirus pandemic.
What’s more, existing school facilities are inadequate to accommodate the growth in enrollment and expanding public pre-K and child care programs. Many existing schools also need to upgrade their technology and their technical and scientific facilities for safety and quality teaching.12
Numerous studies find associations between school physical infrastructure and student performance.13 Not surprisingly, students do better in well-maintained schools.14
School infrastructure also plays a key role in the health and vitality of surrounding communities. Schools often serve as voting centers, emergency shelters, and spaces for after-school programs, public meetings, and private community organizations. Housing values often depend, in part, on the quality of the local schools. Unfortunately, the uneven quality of school infrastructure worsens income, wealth, and racial inequalities because poorer neighborhoods have less funding for construction, maintenance, and repair of schools than wealthier neighborhoods.15
The poor condition of our nation’s school infrastructure is well-documented by the 21st Century School Fund, the National Council on School Facilities, and The Center for Green Schools.16 They find that school districts in 2014 needed to spend an additional $46 billion annually for 10 years on new construction, renovation and alteration of existing facilities, and maintenance and operation of facilities to achieve industry standards for good conditions. They noted that because the vast majority of infrastructure projects are paid for by local taxes, the ability of school districts to maintain their facilities “is tied to the wealth of their community, perpetuating inequity in school facility conditions.”17 A federally funded program, as proposed here, by contrast, would be able to disperse the investment funds equitably.
These data on the state of school infrastructure were analyzed by the American Society of Civil Engineers in their 2017 Infrastructure Report Card. The condition of school infrastructure earned a “poor” grade of D+ in the report. It estimated that “more than half (53 percent) of public schools need to make investments for repairs, renovations, and modernizations to be considered to be in ‘good’ condition.”18
An annual $46 billion investment in 2014 would amount to about $50 billion annually in today’s dollars. So, what would be the economic impact of a $50 billion annual public investment in school infrastructure? The economic consequences of public investments are largely a function of the size of two distinct, growth-inducing effects—the scale of the immediate or short-run macroeconomic stimulus and the magnitude of the long-run effect on productivity, which boosts private-sector output, caused by the investments.
Many researchers have analyzed the overall short-run impacts (usually during the first year or two) of public investments in the United States and in Europe on GDP growth amid the Great Recession and the immediate aftermath, from late 2007 into 2010. This was a period of time when, like today, there was a sharp economic decline, high unemployment, and an accommodating monetary policy that kept interest rates low. These studies find that when there was significant slack in the labor market, monetary policy that kept interest rates low, and public investments that were paid for by borrowing, a dollar of infrastructure investments resulted in an extra $1.50 to $2.00 in GDP.19 This 1.5 to 2 macroeconomic multiplier effect stimulated output growth that, in turn, generated jobs, earnings, and tax revenue.
Other economists studied the overall long-term impacts (beyond 1 or 2 years) of public investments in infrastructure on productivity and subsequent private-sector output and GDP growth. While these studies vary in their conclusions, they generally find positive impacts on private-sector productivity.
For example, in an analysis of 578 estimates from 68 studies of the effects of public infrastructure investments in various countries in the 1983–2008 time period, economists Pedro Bom and Jenny Ligthart at Tilburg University find that these investments boost private-sector productivity by 12.2 percent.20 For the subset of the 33 studies that analyzed public investments in infrastructure in the United States, the effects are even larger. As summarized by Josh Biven at the Economic Policy Institute, Bom and Ligthart find that public investments in infrastructure in the United States:
provided a significant boost to productivity in the long run by boosting the public capital stock. The rate of return to infrastructure investment is large; the median and average estimates of a review of dozens of studies on infrastructure indicate that each $100 spent on infrastructure boosts private-sector output by $13 (median) and $17 (average) in the long run.21
It is noteworthy that the positive productivity effects of public investments reviewed by Bom and Ligthart rise as the newer studies use better data and methodologies. This implies that returns to infrastructure may be higher than indicated above.
Bom and Ligthart’s review also suggests that different types of infrastructure investments may have different implications for productivity growth. In particular, “core” infrastructure, which includes roads, railroads, and utilities, may have a stronger impact on private-sector productivity than noncore infrastructure, such as school buildings. Bom and Ligthart do not, however, provide a rate of return estimate for public investments in school facilities in the United States. To err on the conservative side, instead of using their 17 percent (average) or 13 percent (median) return on public infrastructure investments in the United States, in the analysis below of the proposed school facilities investments, I will use the lower 12.2 percent return on public capital for all types of infrastructure investments in all countries. For the other two education investments this study proposes, the long-run productivity outcomes specific to those proposals are used.
In addition to generating faster productivity growth, infrastructure investments are likely to create jobs and reduce unemployment in the long run by allowing the economy to function at lower levels of unemployment without increasing inflation.22 Yet the magnitude of the long-run jobs effect from increases in productivity is uncertain: Estimates vary from substantial to modest, at best.23 Thus, the long-run employment effects are imprecise.
What do these overall data tell us about additional economic growth from public investments in physical school infrastructure? Using the data reviewed above—assuming a short-run macroeconomic multiplier of 1.6 and a long-run productivity boost of 12.2 percent—the effects of a $50 billion-a-year public investment over 12 years (totaling $600 billion) in school infrastructure, financed by public borrowing in today’s highly favorable, near-zero interest rate monetary policy environment, would more than pay for itself in the form of higher GDP growth.
Indeed, this $600 billion investment would largely pay for itself through enhanced tax revenues alone, while creating hundreds of thousands of new jobs. These outcomes are a function of both the short-term stimulus and long-run productivity effects of the investment.
More specifically, a $50 billion annual investment over 12 years times a multiplier of 1.6 generates an extra $80 billion increase in GDP within just the first 2 years that persists over the 12 years of the investment project. To calculate today’s value—the present value—of the costs and benefits of the investment that occur over 12 years so that they can be compared, the future costs and benefits are discounted at 6 percent.24 At a 6 percent discount, the 12-year cost of the program in present value is $444 billion, with the present value of the increased GDP over the 12 years from the short-term stimulus amounting to $671 billion.
Taxes in the United States are roughly 25 percent of GDP.25 Hence, the $80 billion increase in GDP will increase tax revenues by $20 billion per year, or $240 billion over the first 12 years. Applying that 6 percent discount, the present value of the increased tax revenue over the 12 years is $168 billion.
In addition to the immediate stimulus effect, there is the long-term productivity effect on the economy from this $600 billion investment in schools’ physical infrastructure. The $50 billion investment over 12 years increases the public capital stock by $539 billion, once the effects of the depreciation of the investment over time are included.26 This increase in public capital stock (government-owned physical assets) will boost private-sector output and GDP by $66 billion (12.2 percent of $539 billion) per year once the productivity increases are fully phased in.
Gradually phasing in the productivity effects over the first 12 years of the project and measured over the 60 years of useful life of the new school facilities and the work-life years of the students who use them27 generates another $781 billion in present-value GDP and $195 billion in present-value tax revenue. These long-term productivity-induced gains are on top of the short-term gains described above.
Summing up the short- and long-run economic effects over 60 years, the ratio of present-value GDP to present-value costs is 3.27, and the ratio of present-value tax revenues to present-value costs is 0.82. Thus, the investment more than pays for itself in the form of GDP growth, and the increases in material well-being that growth enables. This increase in future production and, ultimately, consumption of goods and services due to this public investment in schools’ physical infrastructure is nearly free as the investment also largely pays for itself in the form of enhanced tax revenues.
Then, there are the short-term job gains to be had from this investment amid a crushing economic downturn. The short-run $80 billion increase in GDP will create 588,000 jobs over the first 2 years that will persist over the course of the 12-year investment period.28 The subsequent long-run $66 billion annual increase in GDP is likely to produce some additional permanent jobs, but, as noted above, the empirical research does not allow for an estimate of a precise number of additional jobs.
What this analysis demonstrates is that a debt-financed public investment in school construction and rehabilitation will generate sizable economic benefits and be largely self-financing. If the school infrastructure investments were targeted to the most underresourced schools—those with a disproportionate share of the most socioeconomically disadvantaged students—then the investments would also help reduce economic inequality.
It should be further noted that rather than paying the total costs upfront, policymakers should borrow the funds to invest in school construction because these buildings are in service for many decades and their benefits accrue mostly to future generations. Thus, it would be inefficient to pay the full costs upfront and impose them on those who capture only part of the total benefits while charging nothing to those who get most of the benefits. All beneficiaries should share in the shouldering of the costs.
Public investments in high-quality pre-Kindergarten programs
Public investments in high-quality early childhood education programs generate large payoffs. Long-term studies of high-quality pre-Kindergarten programs and their participants consistently find that investing in children delivers a great number of lasting, important benefits for the children, their families, and society at large, including taxpayers. Over time, these investments boost productivity and amply pay for themselves.
Specifically, assessments of well-designed and well-executed pre-K programs establish that participating children are more successful in school and in life after school than children who are not enrolled in high-quality programs. In particular, children who participate in high-quality pre-K programs tend to have higher scores on math and reading achievement tests and greater language abilities.29 They are better-prepared to enter elementary school, experience less grade retention, and have less need for special education and other remedial coursework.30
They also experience lower dropout rates, higher high school graduation rates, and higher levels of schooling attainment.31 And they experience less child abuse and neglect, and are less likely to be teenage parents.32 Additionally, they are better-fed, gain improved access to healthcare services, have higher rates of immunization, and experience better health as children.33
As adults, high-quality pre-K recipients boast higher employment rates, higher earnings, and lower rates of turning to public assistance programs such as the Supplemental Nutrition Assistance Program and the Temporary Assistance for Needy Families program. They exhibit lower rates of drug use and less frequent and less severe criminal behavior, engaging in fewer criminal acts both as juveniles and as adults and having fewer interactions with the criminal justice system, as well as lower incarceration rates. They also experience better health outcomes in adulthood, such as fewer episodes of depression and less tobacco use.34
In short, the benefits of early childhood development programs to participating children enable them to enter school “ready to learn,” and help them achieve better outcomes in school and throughout their entire lives.35
Parents and the families of children who participate in public pre-K programs also benefit. They benefit both directly from the services they receive in high-quality programs and indirectly from the subsidized child care provided by publicly funded early childhood development programs.
In general, parents take advantage of the child care these programs provide by increasing their employment and earnings, and by investing in their own health and education.36 Mothers have fewer additional births, have better nutrition, and smoke less during pregnancy.37 Parents complete more years of schooling, have higher high school graduation rates, are more likely to be employed, have higher earnings, engage in fewer criminal acts, have lower rates of drug and alcohol abuse, are less likely to turn to public assistance programs, and are less likely to abuse or neglect their children.38
These investments in high-quality preschool programs pay for themselves over time by generating high rates of return for participants, the nonparticipating public, and government itself. Studies of high-quality pre-K programs find that they produce $2.63 or more in present-value benefits for every dollar of investment, with the programs whose subsequent benefits were studied over the longest time periods generating in excess of $7 in benefits per dollar of investment.39 The participants and their families get part of these total benefits, as detailed above, but the benefits to the rest of the public and government are large, on their own outweighing the costs of these programs.
The increased lifetime earnings of the adults who receive a pre-K education as children and their parents enlarge the tax payments they make to federal, state, and local governments, pay for the programs, and help fund other public services for society. Thus, it is advantageous even for nonparticipating taxpayers to help pay for these programs.
Although children across the income distribution benefit from a high-quality pre-K education, the largest positive effects are on disadvantaged children from lower socioeconomic backgrounds.40 For mothers of pre-K participants, the largest employment increases occurred among mothers without a high school degree.41 Thus, public investments in pre-K reduce economic inequality.
Economist Lynn Karoly and public policy researcher Anamarie Whitaker at the RAND Corporation review the findings from 16 high-quality preschool programs and report estimates of the economic returns for four of these publicly funded programs.42 They report benefit-to-cost ratios that vary from a minimum of $2.63 to a high of $17.07 for every tax dollar spent on the high-quality pre-K programs. They observe that the largest benefits were measured for programs that were able to follow the progress of the children for many years.
One program, measured to age 28, the Chicago Child Parent program, generated $10.83 in benefits for every dollar invested in the program. Another program, measured to age 40—the Perry Preschool program—netted $17.07 in benefits for each dollar of investment. The long-term follow-up enabled researchers to quantify the benefits of pre-K that manifest only in adulthood. Karoly and Whitaker note that the benefit-cost ratios for the programs that followed children only through kindergarten or at most third grade might have been equally high had they been able to follow the children for more years and then quantify the long-term impacts of the programs.
Karoly and Whitaker did not include the high-quality Abecedarian program or the nearly identical Carolina Approach to Responsive Education program in their review of preschool programs because they began serving children at 8 weeks and, therefore, their effects could not be attributed solely to their pre-K educational component. Yet a large part of their effects are likely attributable to the pre-K portions of the programs, and they have measurable long-term follow-up of participants into their mid 30s. So, we include them here.
Specifically, data-based research this year by economists Jorge Liss Garcia at Clemson University, James Heckman at the University of Chicago, and Duncan Ermini Leaf and María José Prados at the University of Southern California estimates that the costs and benefits of the two programs yielded a statistically significant aggregate benefit-cost ratio of $7.33 for every dollar of public investment.43
In short, research shows that investments in high-quality pre-K have an enormous impact on behavior, academic achievement, and educational attainment, which are key determinants of productivity that drives economic growth and earnings. Most of the economic impacts of pre-K educational programs are derived from their long-run enhancement of productivity, but during economic downturns when unemployment is high and interest rates are low, these investments also have short-run macroeconomic stimulus effects that complement and augment the productivity effects.
What would be the effects of debt-financed, public investments in a voluntary, high-quality, universal pre-Kindergarten program made available to all 3- and 4-year-olds in the United States, modeled after the high-quality Chicago Child Parent program? Although one noted study in 2011 calculated a benefit-cost ratio of $10.83 by age 28, this report uses a 2015 estimate calculated by the author of this report and Kavya Vaghul, then a research assistant at the Washington Center for Equitable Growth and now a senior manager at the nonprofit equity investment-ranking firm JUST Capital.44 Our calculation is similar but more amenable for our purposes because it focuses only on the long-run productivity and behavioral impacts of the investments over 35 years.
I and Vaghul calculated that a voluntary, high-quality, universal pre-Kindergarten program would generate annual budgetary, health, and crime benefits that would surpass the annual costs of the program within 8 years. Within 35 years, when the first cohort of children would be in their late 30s, the annual benefits would exceed the costs by a ratio of 8.85-to-1. Within 16 years, the budgetary benefits to governments alone—in the form of lower budget outlays for various programs and higher tax revenues—would surpass the costs of the program, and within 35 years, these budget benefits alone would exceed the costs by 2.37-to-1, or more than double the cost of the program.45 And these benefits would exceed the costs by a growing margin each subsequent year.
Here, I update to 2020 the costs and benefits that we first calculated in 2015 to demonstrate the effects of a $30 billion annual debt-financed public investment over 35 years (totaling $1.05 trillion) in high-quality pre-Kindergarten. I take into account both the immediate macroeconomic stimulus effects that Vaghul and I did not consider in 2015, as well as the long-run productivity effects, which we did estimate.
Assuming a 1.6 multiplier, this $30 billion annual investment would generate a $48 billion increase in the level of GDP. To calculate the present value of the costs and benefits of the investment that occur over 35 years so that they can be compared, the future costs and benefits are discounted at 6 percent.46 At a 6 percent discount, the 35-year cost of the program in present value is $461 billion, and the present value of the increased GDP over the 35 years from the stimulus is $696 billion.
With taxes in the United States amounting to 25 percent of GDP,47 the $48 billion increase in GDP would increase tax revenues by $12 billion. At a 6 percent discount, the present value of the increased tax revenue over the 35 years is $174 billion.
In addition to the immediate stimulus effect, there are the long-term productivity effects on the economy, as estimated in our 2015 report. To calculate the budgetary impacts of the investment in a universal pre-K program, we phased in, over 35 years, only the impact of the four tax revenue increases and seven budget expenditure savings.48 The present value of these budgetary savings is $567 billion. Of these long-term budgetary benefits, $181 billion are increased tax revenues, which implies that the investment will generate another $724 billion in present-value GDP over 35 years from the boost to private-sector productivity.
Summing up the short- and long-run economic effects over 35 years, the ratio of present-value GDP to present-value costs is 3.08. And the ratio of present-value budgetary effects to present-value costs is 1.61.49 Thus, even ignoring the numerous social benefits of a high-quality, universal pre-K program detailed above—such as less suffering from child abuse and neglect, fewer victims of crime, less distress from depression, higher after-tax wages, and free child care—the investment more than pays for itself over 35 years, both in the form of greater GDP and budgetary savings.
What’s more, the short-run $48 billion increase in GDP from the fiscal stimulus would create 353,000 jobs to help us recover from the current coronavirus recession.50 The subsequent long-run, productivity-induced increase in GDP will likely produce some additional permanent jobs, but the precise number is uncertain.51
In sum, an investment in universal, high-quality pre-Kindergarten would:
- Boost academic achievement and educational attainment
- Improve markedly a variety of human behaviors
- Strengthen the economy’s competitiveness by boosting the productivity of the future workforce
- Improve economic growth rates
- Create hundreds of thousands of new jobs
It would also raise standards of living across the income spectrum while simultaneously reducing economic inequality because its largest positive effects would be on the most socioeconomically disadvantaged children.
This investment in high-quality, universal pre-K would benefit taxpayers and government budgets as well, by saving government spending on kindergarten through 12th grade education, child welfare, the criminal justice system, and public healthcare. Higher tax revenues would flow into government coffers because of increasing taxes paid by participating children and their parents. This investment more than pays for itself and generates faster and more widely shared economic growth.
Public investments in kindergarten through grade 12 educational services
Unfortunately, children in the United States—whether they come from low-income, middle class, or wealthy families—do not always have adequate access to high-quality kindergarten through grade 12 educational opportunities. As a result, many of them fall short of achieving their academic potential in primary and secondary school. In fact, the academic outcomes of American children are poor in comparison to children living in other wealthy countries. (See box.)
In addition to these mediocre average educational outcomes, compared to their peers and near peers around the globe, there are large gaps in the educational outcomes of children in the United States between families with lower and higher socioeconomic status. (See box.) A disproportionate share of U.S. children in low-income families are children of color. Thus, these educational achievement gaps contribute to subsequent racial and ethnic inequality in economic outcomes. The relatively poor performance of children from lower socioeconomic backgrounds also constrains overall U.S. economic growth.54 Closing these income- and race-based educational gaps would promote faster, fairer, and more widely shared economic growth.
Over decades and across countries, theoretical and empirical investigations into the causes of long-run economic growth have produced a large and growing body of research that finds K-12 education plays a pivotal role in the economic growth and well-being of people and nations.55 In particular, studies find that additional years of schooling and academic achievement translate into:
- Increases in individual earnings56
- Improvements in health
- Reductions in crime57
- Increases in productivity58
- Increases in the rate of technological innovation59
All of these dynamics help boost economic growth.
Academic achievement, while related to years of schooling and educational attainment, is also a function of a host of other factors. In particular, research highlights the link between socioeconomic status and student academic achievement.60 Low-income parents have vastly fewer means to provide educationally stimulating environments outside of school, such as books in the home, music, sports, arts, drama, and dance lessons, trips to museums and theatrical performances, travel, and summer camps.61 Low-income parents also tend to have less education and a smaller vocabulary with which to engage their children, compared to higher-income parents.62
These differences in out-of-school investments in children have become more pronounced over time as economic inequality has deepened. In the 1970s, families in the top quintile of income spent about four times as much on the enrichment of their children as did families in the bottom quintile of income. By 2006, they spent nearly seven times as much.63
Making matters worse, low-income children educated in economically and geographically segregated schools with high percentages of other low-income children perform worse on achievement tests than do low-income children educated in less economically and geographically segregated, lower-poverty schools.64 Poor, segregated communities have less access to key resources crucial to children’s success, such as experienced and appropriately credentialed teachers, adequate school facilities, low crime rates, lead-free homes, and parks and other green spaces.65
The consequences are, sadly, telling. Children from poor families are two times to four times more likely than children from wealthy families to have classmates in kindergarten through 12th grade with low cognitive skills and behavioral problems.66 These are attributes that are likely to complicate classroom-management challenges for teachers and have negative effects on child learning. Moreover, children attending schools in low-income neighborhoods are less likely to be exposed to rigorous curricula, such as advanced science and mathematics courses.67
Children of color also suffer various forms of racial and ethnic discrimination that may further undermine achievement. In schools and in the justice system, for example, children of color often receive harsher penalties for the same rule violations than do White children.68 Children of color are also less likely to be tested, diagnosed, and treated for illnesses and learning disabilities that influence their school performance.69
Research also establishes that economic disadvantage and racial discrimination have strong associations with parents’ psychological distress and the cognitive stimulation and emotional support they can provide their young children.70 The stress of low-income parents is linked to the tension of living in poor, highly policed, high-crime neighborhoods.71 Thus, income gaps and racial discrimination contribute to gaps in effective parenting and to parents’ psychological health, which, in turn, lead to gaps in young children’s social, psychological, and emotional development and to gaps in their later-life educational outcomes.
The bottom line is that numerous factors combine to undercut the success of children of color and those from low-income families. These factors include income and wealth inequality, access to quality child care and preschool programs, inadequate levels of public investments in schools, opportunities for out-of-school enrichment, the number of books in the home, nutrition, health, neighborhood safety, exposure to lead paint and other environmental factors, segregation, systemic racism, interaction with the criminal justice system, and the emotional and psychological stress of parents and children. By adversely affecting academic achievement, these socioeconomic and racial disparities weaken overall U.S. economic growth, undermine individual earnings and productivity, and widen U.S. race- and class-based inequality.
Accordingly, raising the academic achievement of all children and narrowing socioeconomic and race-based education gaps by raising the educational attainment and achievement of children from lower socioeconomic families would have large effects on wages, GDP growth, tax revenues, and the quality of life of millions of Americans. Indeed, in a 2015 study, I calculated the consequences of improving academic achievement and narrowing achievement gaps.72 It estimated the economic effects of potential policy reforms that would both improve the educational achievement of U.S. children and reduce disparities in educational outcomes among them.
In the first and most modest scenario, the PISA math and science scores of the three-quarters of U.S. children living in the most-disadvantaged families were improved just enough so that the average U.S. PISA scores matched the OECD average PISA scores in math and science, instead of lagging behind them. The assumed 17-point improvement in PISA scores over 20 years was relatively small, less than those achieved by Germany, Poland, and Italy in 9 years. And yet, it had large effects. In 60 years, when the policy reform effects were fully phased in, the U.S. economy was estimated to be 5.8 percent, or $4.1 trillion, larger than it would otherwise have been, and the cumulative increase in GDP over the 60-year period from 2015 to 2075 amounted to $14 trillion in present value, an average of $234 billion per year.73
My 2015 research also found that narrowing educational achievement gaps while raising average academic outcomes to match the OECD average PISA scores had significant positive consequences for federal, state, and local government revenues. I calculated that the additional revenues over 60 years would total more than $5.1 trillion expressed in present value, an average of about $86 billion per year.74 Hence, policies that modestly improve and equalize academic achievement, as described above, and which cost $86 billion or less for each of the next 60 years, would pay for themselves in budgetary terms alone.
Finally, even under the most modest of the three proposals I detailed in that 2015 report, the study found that narrowing achievement gaps substantially reduced income inequality. The lifetime earnings of children from the bottom three-quarters of socioeconomic status increased by an additional 4.3 percent relative to the income of children at the top of the income spectrum.75
The benefits of raising cognitive achievement and narrowing educational achievement gaps would amount to more than just the increased GDP, jobs, tax revenues, and earnings. The current generation of children would be better-off as adults because they would have higher earnings, higher material standards of living, and an enhanced quality of life. Future generations of children would be more likely to grow up in families that are able to offer them the enriching opportunities of a middle-class lifestyle—and would therefore be less likely to grow up in families struggling in poverty. And present-day adults, whether working or in retirement, would benefit from higher-earning workers being better able to financially sustain the public health and retirement programs they rely on, such as Medicaid, Medicare, and Social Security.
But how could we bring about such an increase in academic achievement as described with an investment of $86 billion or less annually? Given that there are a wide variety of specific causes of poor academic achievement and achievement gaps, there are a wide-ranging set of public policies that could help improve outcomes and narrow gaps. Below, I will briefly describe some of the most effective out-of-school policies before describing the costs and benefits of a $63 billion public investment in K-12 public school finances.
Effective out-of-school policies
Research shows that the academic skills children acquire by age 5, when they typically enter kindergarten, are strongly correlated with their subsequent achievement in school and success in the labor market.76 In a thorough review of the academic literature on this topic, economists Douglas Almond of Columbia University and Janet Currie of Princeton University find that child and family characteristics at the start of formal schooling explain labor market outcomes as much as educational attainment does.77 In other words, the first 5 years of a child’s life and what goes on outside of school may be as important to success in the workplace as all subsequent years of formal education.
This means a comprehensive and integrated set of early childhood support systems that encourage, nurture, and stimulate early care, alongside a variety of other out-of-school social policies, could help close achievement gaps. Fortunately, there are many effective approaches. As discussed in detail above, one approach is to provide access to high-quality, early child care and pre-Kindergarten programs.
Specific policies to support low-income parents and caregivers also may be effective at reducing educational achievement gaps. The health of pregnant mothers and the practice of breastfeeding affect the emotional and physical health of infants and their ability to learn.78 Thus, comprehensive prenatal and postnatal care for pregnant mothers and their infants leads to healthier babies and children who are better-equipped to learn.79
Research also shows that the amount of time parents spend with their children can influence academic achievement, enhance emotional well-being, reduce teen pregnancy, and lower high school dropout rates.80 Therefore, paid family medical leave policies and paid sick days that allow workers to care for a newborn, adopted, or ill child, alongside paid vacation time and flexible work schedules that enable parents and children to spend more time together, could help reduce achievement gaps.
Likewise, studies find that the health and stress levels of parents and caregivers—especially those of pregnant mothers—affect children’s development, ability to learn, and educational attainment.81 Stress during the early childhood years, such as that brought on by parental unemployment or demanding jobs or racial discrimination, can diminish children’s subsequent academic and labor market accomplishments.82 Thus, expanding healthcare coverage for physical and emotional health, particularly for low- and moderate-income families, could help reduce achievement gaps. The Affordable Care Act provides this type of coverage, and the expansion of Medicaid at the state level would especially benefit some of the most stressed out low-income parents and caregivers.
Similarly, public policies that promote higher wages, higher employment, and higher family incomes may reduce educational achievement gaps. Several studies find that increases in family income due to public policies—such as expansions of the Earned Income Tax Credit and the Child Tax Credit—significantly improve test scores.83 Importantly, families use their higher incomes to improve their children’s learning environment through higher-quality child care and increased participation in early education programs.84 Hence, a higher minimum wage, anti-wage-theft labor market policies, an expanded Earned Income Tax Credit and Child Tax Credit, and broader macroeconomic policies that support higher employment and higher wages are examples of policies that could reduce educational achievement gaps.
Policies that meaningfully reform the juvenile and criminal justice system also can help close achievement gaps. Low-income children in general, and children of color in particular, are more likely to experience violence and have interactions with the police and the juvenile and criminal justice systems. These interactions can damage future well-being.85 Black children, for example, are 4.5 times more likely than White children to be apprehended for the same crime. Hispanic children are 2.5 times more likely than White children to be apprehended for the same crime.86
These children of color are also more likely to have an incarcerated parent, a circumstance associated with a variety of poor educational and economic outcomes.87 Thus, policies that help address violence, reduce racial and ethnic bias in the criminal justice system, eliminate unnecessary contact between youth and the juvenile justice system, reduce or abolish incarceration, provide support for incarcerated parents and family of children, and guarantee quality educational and training opportunities for incarcerated youth can help reduce educational achievement gaps.
Education and school finance reform
Many researchers present data-driven evidence that enhancing academic outcomes can be achieved by improving schools through education and finance reform. Specific recommendations that emanate from this school-reform research show that policymakers can improve educational outcomes through extending learning time for students, lowering class sizes, and improving teacher pay and quality.88 All of these policies necessitate investments in public schools and in per-pupil spending.
About 46 percent of funding for public schools in the United States comes from local sources, with most of the local revenues coming from local property taxes. This means wealthier neighborhoods, with more expensive housing, can generate greater property tax revenue even with lower property tax rates. Hence, wealthier neighborhoods typically have the best-funded schools while simultaneously experiencing the smallest school tax burdens.89 Recent research, based on better datasets and improved methodologies, indicates that the levels of school financing matter for educational outcomes and affect the lifelong earnings of children.
One of those studies is by Diane Schanzenbach of Northwestern University and University of California, Berkeley economists Jessie Rothstein and Julien Lafortune. They find that sustained increases in spending in low-income school districts led to steady rises in test scores of low-income children. They calculated that increases in per-pupil spending from kindergarten through eighth grade that cost $3,400 in present value translated into increases in adult earnings of $5,300 in present value. This implies a benefit-cost ratio of more than 1.5-to-1, even when only earnings impacts are counted as benefits.90
Another key study on the efficacy of school finance reform is by economists C. Kirabo Jackson at Northwestern University, Rucker Johnson at the University of California, Berkeley, and Claudia Persico at the University of Wisconsin-Madison. They follow a nationally representative sample of 15,353 children, born between 1955 and 1985, from 1,409 school districts, in 1,031 counties, and all 50 states, analyzing the impact of court-mandated school finance reform on their long-run outcomes, such as educational attainment and earnings through 2011. They find that “a 10% increase in per pupil spending each year for all 12 years of public school leads to 0.31 more completed years of education, about 7.7% higher wages, and a 3.2 percentage point reduction in the annual incidence of adult poverty.”91
The study further finds that “effects are much more pronounced for children from low-income families. … For low-income children, a 10% increase in per pupil spending each year for all 12 years of public school is associated with 0.46 additional years of completed education, 9.6% higher earnings, and a 6.1 percentage point reduction in the annual incidence of adult poverty.”92 The 9.6 percent higher earnings of low-income children outstrips the 5.5 percent increase in wages for nonpoor children. Hence, the investment in school finance reform lifts the income of all children and lessens income inequality.
They also find that the court-mandated spending increases were “associated with notable improvements in measured school inputs, including reductions in student-to-teacher ratios, increases in teacher salaries, and longer school years.” In addition to decreases in class size, increases in teacher pay and quality, and extensions to the length of instruction, their research suggests that having fewer students per counselor and per administrator matters for student outcomes.
Finally, assuming a 6 percent discount rate, they performed a benefit-cost analysis limited to comparing the present-value benefit of a 7.7 percent increase in the median wage to the present-value cost of increasing spending by 10 percent for all 12 school-age years. This analysis calculated “a benefit-cost ratio of about 3.” This implies that investments in school spending are worthwhile.93
Using the findings of Jackson, Johnson, and Persico, I can examine in this report the economic implications of a debt-financed, long-term, 10 percent increase in K-12 public school funding. Keep in mind that Jackson, Johnson, and Persico’s analysis focused on the wage effects of the long-run productivity increases that resulted from public investments in education. My analysis will take into account both the long-term productivity effects and the immediate macroeconomic stimulus effects to our currently depressed economy.
According to the most recent available data, in 2018, public schools in the United States spent $630 billion on “current spending,” which excludes capital outlays and interest.94 Current expenditures are funds spent on instruction and support services, which allow schools to hire additional teachers, guidance counselors, and social workers, and/or pay them more, reduce class size, and increase the time of instruction. All of these expenditures are consistent with the positive effects of school spending on student outcomes found by Jackson, Johnson, and Persico.
Hence, a federal public investment that would finance a 10 percent increase in current spending would amount to $63 billion per year, or $3.78 trillion over 60 years. At a 6 percent discount rate, the present value of a $63 billion increase in K-12 investment for each of 60 years is $1.08 trillion. The present value of a 7.7 percent increase in the wages of the workers educated over those 60 years is $2.27 trillion. Taking into account only the wage benefit, this implies a benefit-cost ratio of about 2.1, similar to that calculated by Jackson, Johnson, and Persico. It also suggests that the investment would increase GDP in present value by $5.56 trillion over 60 years and present-value tax revenues by $1.39 trillion. This present-value revenue increase alone is more than the present-value cost of the program.95
In other words, the program pays for itself.
The annual $63 billion public investment also would deliver an important macroeconomic stimulus effect in our currently depressed economy. Assuming a 1.6 multiplier, it would boost GDP by an additional $101 billion per year, or $1.63 trillion in present value over 60 years, generate roughly $25 billion in additional annual tax revenues for 60 years, or $407 billion in present value, and create an additional 741,000 jobs.
Summing up these short- and long-run economic effects, the ratio of present-value GDP to present-value costs is 6.66, and the ratio of present-value tax revenues to present-value costs is 1.66. Thus, the investment more than pays for itself over 60 years, both in the form of greater GDP and in enhanced tax revenues.
Finally, the investment would raise the adult incomes of all students while also reducing income inequality. As noted above, Jackson, Johnson, and Persico reported that the adult earnings of low-income children would increase by 9.6 percent while those of nonpoor children would rise 5.5 percent, thereby reducing the relative gap in wages by about 4.1 percent, nearly identical to the 4.3 percent estimated in my 2015 report for a policy that modestly improved average academic achievement while significantly reducing socioeconomic achievement gaps.
Conclusion
This report presents three public investments in education—in school facilities, in high-quality pre-Kindergarten, and in kindergarten through grade 12 education services—all of which collectively increase the quality and quantity of education available to children. In each case, the benefits of the proposals, in the form of the value of output they generate, far exceed their costs.
In addition, in two of the three cases, and almost so in the third as well, the positive budgetary impacts alone are greater than the costs—so that the programs pay for themselves. Specifically, the school facilities infrastructure investment returns $3.27 of output and $0.82 in tax revenues for each dollar invested in the program. The pre-K investment returns $3.08 in output and $1.61 in budgetary savings for each dollar spent on the program. And the K-12 public school investment yields $6.66 in output and $1.66 in tax revenue for each dollar expended.
These investment proposals are not made in a vacuum and should not be judged out of context. The U.S. economy is experiencing one of the severest declines in its history. This is, in part, due to the coronavirus pandemic and the resulting recession. But it is also due to the failed response to both the pandemic and the continuing economic downturn after a much-needed initial burst of economic stimulus. The pandemic caused households and businesses to reduce their economic activity. Unable to sell their wares, business have shuttered and laid off millions of workers, causing massive wage losses and contributing to further declines in spending that intensify the economic downturn. This shortfall in aggregate demand for goods and services exacerbates two pre-existing problems: the long-run deceleration in productivity growth and growing economic inequality, both of which became pronounced beginning in the mid- to late 1970s.
The education investment proposals address all three of these issues: the immediate economic catastrophe once the pandemic is contained, rising income inequality, and the long-term waning of U.S. productivity growth. They boost aggregate demand by injecting tens of billions of dollars in school construction and education services, generating income and jobs. This report estimates that the short-term stimulus engendered by the three investments would create 1.7 million new jobs within 2 years, and the long-term effects could further lift employment levels. The three investments provide education services disproportionately to our most underserved children and positively affect middle- and lower-income families more than the most-advantaged families. They thereby reduce economic inequality and, instead, promote widely shared or equitable growth. Finally, by increasing both physical and human capital over time, they promote long-term private-sector productivity.
The current economic crisis led monetary policy authorities to, appropriately, keep interest rates low. This reduced the federal government’s short- and long-term borrowing costs to close to zero. In mid-August 2020, yields on 1-year treasuries were 0.13 percent and on 30-year bonds were 1.45 percent—both less than the rate of inflation—so that bond investors were effectively paying the government to hold their money.96 It is, in part, for this reason that this report calls for the investments to be financed with public debt. With accommodating monetary policy, government borrowing is unlikely to raise interest rates and crowd out private investment. Nor are the debt-financed investments, in the context of the current depressed state of aggregate demand, likely to bring about excess demand and inflation.
What’s more, the long-term nature of the benefits of these investments suggest that policymakers should not impose the costs of the investments (through lower public services or higher taxes) only on the current beneficiaries. Instead, they should spread them over the lives of the current and future beneficiaries of the programs. Thus, borrowing to pay for these investments makes sense.
Alternative financing methods for these necessary public investments in education could negatively impact growth. Cutting expenditures on other government services or raising taxes to finance education investments could reduce demand and economic growth and thereby partly undermine the short-term macroeconomic stimulus effects of the investments. To the extent that alternatives to borrowing are contemplated, those with the smallest negative multiplier effects should be considered. Research from the period of the Great Recession of 2007¬–2009 and its immediate aftermath suggests that raising taxes on the wealthy and on corporations would have the smallest negative impact.97
Finally, there are reasons to believe that these investments are also synergistic and interdependent, which means they should be undertaken simultaneously. Research shows that the benefits of high-quality pre-K programs may fade if children progress from high-quality pre-K programs into poor-quality K-12 education.98 And, obviously, our nation cannot offer high-quality pre-K, kindergarten, and primary and secondary school educational services without the facilities within which to offer them. Thus, the combined benefits of the three investments are likely to be larger than the individual benefits estimated in this study.
When education facilities and services are inadequate in supply and quality, unevenly located, and serving the needs of the most-advantaged in society, then racial, ethnic, class, and gender-based inequalities worsen. Inequality, in turn, may slow economic growth and degrade social welfare. In contrast, public investments in the quality and quantity of education are important determinants of productivity, growth, and international economic competitiveness. They are also central to human well-being. Investing in the education and skills of our people, our most valuable resource, can immediately boost the economy, create jobs, and help lift us out of our current economic malaise, while simultaneously laying the groundwork for future equitable growth. Investments in the cognitive skills of our people help create pathways for more rapid future growth by enhancing long-run productivity, and they reduce economic disparities by providing ladders of opportunity for all.
About the author
Robert G. Lynch is the Young Ja Lim professor of economics at Washington College, where he has taught since the fall of 1998. Lynch was a visiting scholar at the Washington Center for Equitable Growth in 2015. From 1983 to 1998, he taught at the State University of New York at Cortland, where he served as chair of the Department of Economics between 1991 and 1993. He also taught at Huanghe University (1985–86) in the People’s Republic of China. His areas of specialization include international economics, public policy, public finance, economic development, and comparative economics.
Acknowledgments
I thank Michael Ettlinger for talking through many of the ideas that inspired this paper. I am also grateful to Charles Call, Marcus Corbin, Michael Ettlinger, Louisa Koch, and Guy Molyneaux for being sounding boards and encouraging me to complete the research, and to Kavya Vaghul for her contributions to earlier iterations of parts of this work. I thank Ed Paisley for his superb editing, David Evans and Austin Clemens for their contributions to graphics and design, and Emilie Openchowski for the copy edit. All errors are, of course, my responsibility alone.
End Notes
1. Hirschman defined infrastructure as “those basic services without which primary, secondary, and tertiary productive facilities cannot function.” A.O. Hirschman, The Strategy of Economic Development (New Haven: Yale University Press, 1958).
2. N.G. Mankiw, D. Romer, and D. Weil, “A contribution to the empirics of economic growth,” Quarterly Journal of Economics 107 (2) (1992): 407–437; R.J. Barro, “Human capital and growth,” American Economic Review 91 (2) (2001): 12–17.
3. R.E. Lucas, “On the mechanics of economic development,” Journal of Monetary Economics 22 (1988): 3–42.
4. R.R. Nelson and E. Phelps, “Investment in humans, technology diffusion and economic growth,” American Economic Review 56 (2) (1966): 69–75.
5. E.A. Hanushek and L. Woessmann, “Education and Economic Growth.” In Penelope Peterson, Eva Baker, and Barry McGaw, eds., International Encyclopedia of Education, volume 2 (Oxford: Elsevier, 2010), pp. 245–252.
6. For a recent review of this literature, see Anna Zajacova and Elizabeth M. Lawrence, “The Relationship Between Education and Health: Reducing Disparities Through a Contextual Approach,” Annual Review of Public Health 39 (2018): 273–289.
7. Heather Boushey, Unbound: How Inequality Constricts Our Economy, and What We Can Do About It (Cambridge, MA: Harvard University Press, 2019).
8. H. Braun, F. Jenkins, and W. Grigg, “Comparing Private Schools and Public Schools Using Hierarchical Linear Modeling” (Washington: U.S. Department of Education, National Center for Education Statistics, Institute of Education Sciences, 2006). The survey was based on data from 2003 compiled from 6,900 public schools and 530 private schools for the fourth grade assessments and 5,500 public schools and 550 private schools for the eighth grade assessments.
9. Thomas Piketty, Capital in the Twenty-First Century (Cambridge, MA: Belknap Press of Harvard University Press, 2014); Thomas Piketty, Emmanuel Saez, and Gabriel Zucman, “Distributional National Accounts: Methods and Estimates for the United States,” Quarterly Journal of Economics 133 (2) (2018): 553–609.
10. Jonathan Weiss, “Public Schools and Economic Development: What the Research Shows” (Cincinnati, OH: Knowledge-Works Foundation, 2004).
11. Environmental Protection Agency, “Indoor Air Quality and Student Performance” (2000).
12. Mary Filardo, “Good buildings, better schools: An economic stimulus opportunity with long-term benefits.” Briefing Paper #216 (Economic Policy Institute, 2008).
13. L. Lemasters, “A Synthesis of Studies Pertaining to Facilities, Student Achievement, and Student Behavior” (Blacksburg, VA: University of Virginia, Educational Leadership and Policy Studies Center, 1997).
14. J. Buckley, M. Schneider, and Y. Shang, “Los Angeles Unified School District School Facilities and Academic Performance” (Washington: National Clearinghouse for Educational Facilities, 2004); M. Lewis, “Where Children Learn: Facility Condition and Student Test Performance in Milwaukee Public Schools” (Scottsdale, AZ: Council of Educational Facility Planners, 2000).
15. Mary Filardo and others, “Growth and Disparity: 10 Years of U.S. Public School Construction 1995-2004” (Washington: 21st Century School Fund, Building Educational Success Together, 2006).
16. 21st Century School Fund, National Council on School Facilities, and The Center for Green Schools, “The State of Our Schools, America’s K-12 Facilities” (2016), available at https://kapost-files-prod.s3.amazonaws.com/published/56f02c3d626415b792000008/2016-state-of-our-schools-report.pdf?kui=wo7vkgV0wW0LGSjxek0N5A.
17. Ibid., p.18.
18. American Society of Civil Engineers, “2017 Report Card for America’s Infrastructure” (2017), available at http://www.infrastructurereportcard.org/.
19. See, for example, Congressional Budget Office, “Estimated Impact of the American Recovery and Reinvestment Act on Employment and Economic Output from October 2011 through December 2011” (2012), available at http://www.cbo.gov/publication/43013; Council of Economic Advisers, “The Economic Impact of the American Recovery and Reinvestment Act of 2009: Fourth Quarterly Report” (2010), available at http://www.whitehouse.gov/files/documents/cea_4th_arra_report.pdf; Mark Zandi, “An Analysis of the Obama Jobs Plan,” Moody’s Analytics’ Dismal Scientist, September 9, 2011; Robert Hall, “By How Much Does GDP Rise If the Government Buys More Output?” Brookings Papers on Economic Activity (2009), pp. 183–231; Michael Woodford, “Simple Analytics of the Government Expenditure Multiplier,” American Economic Journal: Macroeconomics 3 (2011): 1–35; Antonio Acconcia, Giancarlo Corsetti, and Saverio Simonelli, “Mafia and Public Spending: Evidence on the Fiscal Multiplier from a Quasi-experiment,” American Economic Review 104 (7) (2014): 2185–209; Olivier J. Blanchard and Daniel Leigh, “Growth Forecast Errors and Fiscal Multipliers,” American Economic Review 103 (3) (2013): 117–20; Branimir Jovanovic, “Growth Forecast Errors and Government Consumption and Investment,” International Review of Applied Economics 31 (1) (2017): 83–107; Sylvain Leduc and Daniel Wilson, “Infrastructure Spending as Fiscal Stimulus: Assessing the Evidence,” Review of Economics and Institutions 5 (1) (2014): 1–24.
20. Pedro Bom and Jenny Ligthart, “What Have We Learned from Three Decades of Research on the Productivity of Public Capital?” Journal of Economic Surveys 28 (5) (2015): 889–916.
21. For a review of this literature, see Josh Biven, “The potential macroeconomic benefits from increasing infrastructure investment” (Washington: Economic Policy Institute, 2017).
22. Laurence Ball and Gregory Mankiw, “The NAIRU in Theory and Practice,” Journal of Economic Perspective 16 (4) (2002): 115–136
23. Abdul Abiad, Davide Furceri, and Petia Topalova, “The Macroeconomic Effects of Public Investment: Evidence from Advanced Economies.” Working Paper vol. WP/15/95 (IMF, 2015); Panicos O. Demetriades and Theofanis P. Mamuneas, “Intertemporal Output and Employment Effects of Public Infrastructure Capital: Evidence from 12 OECD Economies,” The Economic Journal 110 (465) (2000): 687–712.
24. Present value is a standard economics and financial method of calculating the value in today’s dollars of expected future costs and income.
25. Organisation for Economic Co-operation and Development, “Revenue Statistics” (2019), available at http://oe.cd/revenue-statistics.
26. We assume depreciation at 2 percent per annum in the capital stock. 21st Century School Fund, National Council on School Facilities, and The Center for Green Schools, “The State of Our Schools, America’s K-12 Facilities.”
27. The average age of school buildings is 44 years, and the useful life of school infrastructure is six decades or longer. D. Alexander and L. Lewis, “Condition of America’s Public School Facilities: 2012–13” (Washington: U.S. Department of Education National Center for Education Statistics, 2014), available at http://nces.ed.gov/pubsearch.
28. This assumes $136,000 in additional output per created job, given the ratio of GDP-to-employment in 2019.
29. William T. Gormley and others, “The Effects of Universal Pre-K on Cognitive Development,” Developmental Psychology 41 (6) (2005): 872–884; National Institute for Child Health and Development, “Early child care and children’s development in. the primary grades: Follow-up results from the NICHD study of early child care,” American Educational Research Journal 42 (3) (2005): 537–570.
30. Leonard Masse and W. Steven Barnett, “A Benefit Cost Analysis of the Abecedarian Early Childhood Intervention” (New Brunswick, NJ: National Institute for Early Education Research at Rutgers University, 2002).
31. Hirokazu Yoshikawa and others, “Investing in Our Future: The Evidence Base on Preschool Education” (Ann Arbor, MI and New York: Society for Research in Child Development and Foundation for Child Development, 2013), available at http://www.srcd.org/sites/default/files/documents/washington/mb_2013_10_16_investing_in_children.pdf; Lawrence J. Schweinhart and others, Lifetime Effects: The High/Scope Perry Preschool Study Through Age 40 (Ypsilanti, MI.: High/Scope Educational Research Foundation, 2005); Frances Campbell and others, “Early childhood education: Young adult outcomes from the abecedarian project,” Applied Development Science 6 (1) (2002): 42–57.
32. Lynn Karoly and others, “Assessing Costs and Benefits of Early Childhood Intervention Programs: Overview and Application to the Starting Early Starting Smart Program” (Washington: Rand Corporation, 2001).
33. William T. Gormley and others, “Social-Emotional Effects of Early Childhood Education Programs in Tulsa,” Child Development 82 (6) (2011): 2095–2109.
34. Arthur J. Reynolds and others, “School-Based Early Childhood Education and Age-28 Well-Being: Effects by Timing, Dosage, and Subgroups,” Science 333 (2011): 360–364.
35. David Deming, “Early Childhood Intervention and Life-Cycle Skill Development: Evidence from Head Start,” American Economic Journal: Applied Economics 1 (2009): 111–134; Jens Ludwig and David Miller, “Does Head Start Improve Children’s Life Chances? Evidence from a Regression Discontinuity Design,” Quarterly Journal of Economics 122 (1) (2007): 159–208; National Institute for Early Education Research, “Fast Facts Summary: Getting the Facts Right on Pre-K and the President’s Pre-K Proposal” (2013), available at http://www.nieer.org/sites/nieer/files/Getting%20the%20Facts%20Right%20on%20PreK%20Fast%20Facts%20Summary.pdf.
36. Rasheed Malik, “The Effects of Universal Preschool in Washington D.C., Children’s Learning and Mothers’ Earnings” (Washington: Center for American Progress, 2018).
37. Masse and Barnett, “A Benefit Cost Analysis of the Abecedarian Early Childhood Intervention.”
38. Reynolds and others, “School-Based Early Childhood Education and Age-28 Well-Being: Effects by Timing, Dosage, and Subgroups.”
39. Present-value estimates are the value in today’s dollars of future costs and revenues discounted at a specified rate of interest. They allow us to compare benefits and costs generated over varying time periods, with benefit-to-cost ratios in excess of 1 demonstrating positive economic returns.
40. Debra Phillips and others, “Puzzling it out: The Current State of Scientific Knowledge on Pre-Kindergarten Effects” (Washington: Brookings Institution, 2017); Katherine A. Magnuson and Jane Waldfogel, “Early Childhood Care and Education: Effects on Ethnic and Racial Gaps in School Readiness,” The Future of Children 15 (1) (2005): 169–196, available at http://futureofchildren.org/futureofchildren/publications/docs/15_01_09.pdf; Jim Minervino, “Lessons from Research and the Classroom: Implementing High-Quality Pre-K that Makes a Difference for Young Children” (Seattle: Bill and Melinda Gates Foundation, 2014); Lynn A. Karoly, “Preschool Adequacy and Efficiency in California: Issues, Policy Options, and Recommendations” (Santa Monica, CA: RAND Corporation, 2009); Christina Weiland and Hirokazu Yoshikawa, “Does Higher Peer Socio-Economic Status Predict Children’s Language and Executive Function Skills Gains in Prekindergarten?” Journal of Applied Developmental Psychology 35 (2014): 422–432.
41. Malik, “ The Effects of Universal Preschool in Washington D.C., Children’s Learning and Mothers’ Earnings.”
42. Lynn A. Karoly and Anamarie A. Whitaker, “Informing Investments in Preschool Quality and Access in Cincinnati: Evidence of Impacts and Economic Returns from National, State, and Local Preschool Programs” (Santa Monica, CA: RAND Corporation, 2016), available at https://www.rand.org/pubs/research_reports/RR1461.html.
43. Jorge Luis García and others, “Quantifying the Life-Cycle Benefits of an Influential Early-Childhood Program,” Journal of Political Economy 128 (7) (2020): 2502–2541, available at http://doi.org/10.1086/705718.
44. Reynolds and others, “School-Based Early Childhood Education and Age-28 Well-Being: Effects by Timing, Dosage, and Subgroups”; Robert Lynch and Kavya Vaghul, “The Benefits and Costs of Investing in Early Childhood Education” (Washington: Washington Center for Equitable Growth, 2015).
45. Lynch and Vaghul, “The Benefits and Costs of Investing in Early Childhood Education.”
46. Present value is a standard economics and financial method of calculating the value in today’s dollars of expected future costs and income.
47. Organisation for Economic Co-operation and Development, “Revenue Statistics.”
48. On the revenue side, these are the revenue increases from the higher earnings of the parents of participants, as well as the increased adult earnings of the participants due to higher wages, less work time lost to depression, and less work time lost to the complications associated with smoking. The budget expenditure savings are from less spending on special education, lowered K-12 spending due to less grade retention, reduced child welfare spending due to fewer incidents of child abuse and neglect, reduced criminal justice expenditure due to lower juvenile and adult crime rates, and reduced public healthcare spending due to lower rates of depression and smoking.
49. Nearly half of the budgetary savings result from increased future tax revenues, with the rest emanating from future expenditure savings.
50. This assumes $136,000 in additional output per created job, given the ratio of GDP-to-employment in 2019.
51. Lynch and Vaghul estimate the tax revenue increase in the 35th year to amount to $87 billion in inflation-adjusted dollars, which implies a $348 billion increase in real GDP, enough to support potentially as many as 2.5 million jobs at current levels of productivity. However, this is an upper bound because the pre-K investment increases productivity and output per worker, thereby lowering the average number of jobs created by every dollar increase in GDP.
52. The PISA test, administered by the Organisation for Economic Co-operation and Development to its 34 member nations and roughly 30 other nonmember nations, assesses the scholastic performance of 15-year-old schoolchildren in mathematics, science, and reading. See OECD, “PISA 2012 Assessment and Analytical Framework: Mathematics, Reading, Science, Problem Solving and Financial Literacy” (2010), available at http://dx.doi.org/10.1787/9789264190511-en.
53. OECD, “Strong performers and Successful Reformers in Education: Lessons from PISA for the United States” (2011), p. 247.
54. Robert Lynch, “The Economic and Fiscal Consequences of Improving U.S. Educational Outcomes” (Washington: Washington Center for Equitable Growth, 2015), available at https://equitablegrowth.org/achievement-gap/.
55. See, for example, Gary S. Becker, Human Capital: A Theoretical and Empirical Analysis, with Special Reference to Education, 2nd edition (New York: Columbia University Press, 1975); Jacob Mincer, “Investment in U.S. Education and Training.” Working Paper 4844 (National Bureau of Economic Research, 1994); Robert J. Barro, “Economic Growth in a Cross Section of Countries,” Quarterly Journal of Economics 106 (2) (1991): 407–443; Barro, “Human Capital and Growth.”
56. David Card, “The Causal Effect of Education on Earnings.” In Orley Ashenfelter and David Card, eds., Handbook of Labor Economics, Volume. 3 (Amsterdam, New York, and Oxford: Elsevier Science, North-Holland, 1999): 1801–1863; James Heckman, Lance J. Lochner, and Petra E. Todd, “Earnings Functions, Rates of Return and Treatment Effects: The Mincer Equation and Beyond.” In Eric A. Hanushek and Finis Welch, eds., Handbook of the Economics of Education, Volume 1 (Amsterdam and Oxford: Elsevier, North-Holland, 2006): 307–458; George Psacharopoulos and Harry Anthony Patrinos, ”Returns to Investment in Education: A Further Update,” Education Economics 12 (2) (2004): 111–134.
57. Lance J. Lochner and Enrico Moretti, “The Effect of Education on Crime: Evidence from Prison Inmates, Arrests, and Self-Reports,” American Economic Review 94 (1) (2004): 155–89; Janet Currie and Enrico Moretti, “Mother’s Education and the Intergenerational Transmission of Human Capital: Evidence from College Openings,” Quarterly Journal of Economics 118 (4) (2003): 1495–1532; Kevin Milligan, Enrico Moretti, and Philip Oreopoulos, “Does Education Improve Citizenship? Evidence from the United States and the United Kingdom,” Journal of Public Economics 88 (9-10) (2004): 1667–1695.
58. Jacob Mincer, “Human Capital and Economic Growth,” Economics of Education Review 3 (3) (1984): 195–205; Barro, “Human Capital and Growth”; Eric A. Hanushek and Ludger Woessmann, “The Role of Cognitive Skills in Economic Development,” Journal of Economic Literature 46 (3) (2008): 607–668.
59. Ibid.
60. James S. Coleman and others, “Equality of Educational Opportunity” (Washington: U.S. Department of Health, Education, and Welfare, Office of Education, 1966); Greg Duncan and Katherine Magnuson, “The nature and impact of early achievement skills, attention and behavior problems.” In Greg J. Duncan and Richard J. Murnane, eds., Whither Opportunity? Rising Inequality and the Uncertain Life Chances of Low-Income Children (New York: Russell Sage Foundation Press, 2011); Roland Fryer and Steven Levitt, “Testing for Racial Differences in the Mental Ability of Young Children,” American Economic Review 103 (2) (2013): 981–1005. For a review of the literature on the association between low birth weight, socioeconomic status, and cognitive outcomes, see Mark E. McGovern, “Still Unequal at Birth: Birth Weight, Socio-economic Status and Outcomes at Age 9,” The Economic and Social Review 44 (1) (2013): 53–84.
61. Meredith Phillips, “Parenting, Time Use, and Disparities in Academic Outcomes.” In Greg J. Duncan and Richard J. Murnane, eds., Whither Opportunity? Rising Inequality, Schools, and Children’s Life Chances (New York: Russell Sage Foundation, 2011); Petra E. Todd and Kenneth I. Wolpin, “The Production of Cognitive Achievement in Children: Home, School and Racial Test Score Gaps,” Journal of Human Capital 1 (1) (2007): 91–136.
62. Anne Fernald, Virginia A. Marchman, and Adriana Weisleder,“SES differences in language processing skill and vocabulary are evident after 18 months,” Developmental Science 16 (2) (2013): 234–248; B. Hart and T. R. Risley, Meaningful Differences in the Everyday Experiences of Young American Children (Baltimore, MD: Brookes Publishing, 2003).
63. Greg J. Duncan and Richard J. Murnane, “Introduction: The American Dream, Then and Now.” In Greg J. Duncan and Richard J. Murnane, eds., Whither Opportunity? Rising Inequality and the Uncertain Life Chances of Low-Income Children (New York: Russell Sage Foundation, 2011).
64. David Card and Jesse Rothstein, “Racial Segregation and the Back-White Test Score Gap,” Journal of Public Economics 91 (11-12) (2007): 2158–2184; Heather Schwartz, “Housing Policy is School Policy: Economically Integrative Housing Promotes Academic Success in Montgomery County, Maryland” (Washington: The Century Foundation, 2010).
65. For reviews of this literature, see Marilyn Dabady, “Measuring Racial Disparities and Discrimination in Elementary and Secondary Education: An Introduction,” Teachers College Record 105 (6) (2003): 1048–1178.
66. Duncan and Magnuson, “The nature and impact of early achievement skills, attention and behavior problems”; George Farkas, “Middle and High School Skills, Behaviors, Attitudes, and Curriculum Enrollment, and Their Consequences.” In Greg J. Duncan and Richard J. Murnane, eds., Whither Opportunity? Rising Inequality and the Uncertain Life Chances of Low-Income Children (New York: Russell Sage Foundation, 2011).
67. Thomas B. Hoffer, Kenneth A. Rasinski, and Whitney Moore, “Social Background Differences in High School Mathematics and Science Coursetaking and Achievement” (Washington: National Center for Education Statistics, 1995); Jeannie Oakes, Kate Muir, and Rebecca Joseph, “Coursetaking and Achievement in Mathematics and Science: Inequalities that Endure and Change” (Madison, WI: National Institute of Science Education, 2000).
68. T. Fabelo and others, “Breaking Schools’ Rules: A Statewide Study of How School Discipline Relates to Students’ Success sand Juvenile Justice Involvement” (College Station, TX: Council of State Governments Justice Center, 2011).
69. Paul L. Morgan and others, “Risk Factors for Learning-related Behavior Problems at 24 Months of Age: Population Based Estimates,” Journal of Abnormal Child Psychology 37 (2009): 401–413.
70. Eric Knudsen and others, “Economic, Neurobiological, and Behavioral Perspectives on Building America’s Future Workforce,” Proceedings of the National Academy of Sciences 103 (2006): 10155–10162; Greg Duncan and others, “The Importance of Early Childhood Poverty,” Social Indicators Research 108 (2012): 87–98.
71. Amy Schulz and others, “Association Between Socioeconomic Status and Allostatic Load: Effects of Neighborhood Poverty and Tests of Mediating Pathways,” American Journal of Health 102 (9) (2012): 1706–1714.
72. Lynch, “The Economic and Fiscal Consequences of Improving U.S. Educational Outcomes.”
73. Ibid.
74. Ibid.
75. Ibid.
76. Sean Reardon, “The Widening Academic Achievement Gap Between the Rich and the Poor: New Evidence and Possible Explanations.” In Greg J. Duncan and Richard J. Murnane, eds., Whither Opportunity? Rising Inequality, Schools, and Children’s Life Chances (New York, NY: Russell Sage Foundation, 2011).
77. Douglas Almond and Janet Currie, “Human Capital Development Before Age Five.” Working Paper 15827 (National Bureau of Economic Research, 2010): 54–55, available at https://www.nber.org/papers/w15827.
78. Ibid.
79. World Health Organization, “Social Determinants of Health” (2010), available at https://www.who.int/social_determinants/en/.
80. Elizabeth Thomson, Thomas L. Hanson, and Sara S. McLanahan, “Family Structure and Child Well-Being: Economic Resources vs. Parental Behaviors,” Social Forces 73 (1) (1994): 221–242; Roland E. Bulanda and Stephen Lippmann, “Wrinkles in Parental Time with Children: Work, Family Structure, and Gender,” Michigan Family Review 13 (1) (2009): 5–20. Matthew J. Neidell, “Early Parental Time Investments in Children’s Human Capital Development: Effects of Time in the First Year on Cognitive and Non-Cognitive Outcomes.” Working Paper 806 (University of California, Los Angeles Department of Economics, 2000); Daniela Del Boca, Christopher Flinn, and Matthew Wiswall, “Household Choices and Child Development,” The Review of Economic Studies 81 (1) (2014): 137–185.
81. National Scientific Council on the Developing Child, “Excessive Stress Disrupts the Architecture of the Developing Brain.” Working Paper 3 (Harvard University Center on the Developing Child, 2014), available at http://developingchild.harvard.edu/resources/reports_and_working_papers/working_papers/wp3/; Anna Aizer, Laura Stroud, and Stephen Buka, “Maternal Stress and Child Outcomes: Evidence from Siblings.” Working Paper 18422 (National Bureau of Economic Research, 2012), available at http://www.nber.org/papers/w18422; Almond and Currie, “Human Capital Development Before Age Five”; James J. Heckman, “Policies to Foster Human Capital.” Working Paper 7288 (National Bureau of Economic Research, 1999), available at http://www.nber.org/papers/w7288.pdf; Ariel Kalil and Kathleen M. Ziol-Guest, “Single Mothers’ Employment Dynamics and Adolescent Well-Being,” Child Development 76 (1) (2005): 196–211.
82. National Scientific Council on the Developing Child, “Excessive Stress Disrupts the Architecture of the Developing Brain”; Kalil and Ziol-Guest, “Single Mothers’ Employment Dynamics and Adolescent Well-Being.”
83. Sean F. Reardon, “No Rich Child Left Behind,” The New York Times, April 27, 2013, available at http://opinionator.blogs.nytimes.com/2013/04/27/no-rich-child-left-behind/; Greg J. Duncan, Pamela A. Morris, and Chris Rodrigues. “Does Money Really Matter? Estimating Impacts of Family Income on Young Children’s Achievement With Data From Random-Assignment Experiments,” Developmental Psychology 47 (5) (2011): 1263–1279, available at http://www.ncbi.nlm.nih.gov/pmc/articles/PMC3208322/; Kevin Milligan and Mark Stabile, “Do Child Tax Benefits Affect the Wellbeing of Children? Evidence from Canadian Child Benefit Expansions.” Working Paper 14624 (National Bureau of Economic Research, 2008), available at http://www.nber.org/papers/w14624; Gordon B. Dahl and Lance J. Lochner, “The Impact of Family Income on Child Achievement: Evidence from the Earned Income Tax Credit,” American Economic Review 102 (5) (2012): 1927–1956, available at http://econweb.ucsd.edu/~gdahl/papers/children-and-EITC.pdf; Aletha C. Huston and others, “New Hope for Families and Children: Five Year Results of a Program to Reduce Poverty and Reform Welfare” (New York: MDRC, 2003), available at http://www.mdrc.org/sites/default/files/full_457.pdf; Daniela Del Boca, Christopher Flinn, and Matthew Wiswall, “Household Choices and Child Development,” The Review of Economic Studies 81 (1) (2014): 137–85.
84. Lawrence M. Berger, Christina Paxson, and Jane Waldfogel, “Income and Child Development.” Working Paper 938 (Princeton University, Woodrow Wilson School of Public and International Affairs, Center for Research on Child Wellbeing, 2005), available at http://crcw.prineton.edu/workingpapers/WP05-16-FF-Paxson.pdf.
85. See Jennifer Truman, Lynn Langton, and Michael Planty, “Criminal Victimization, 2012” (Washington: Bureau of Justice Statistics, 2013), available at http://www.bjs.gov/content/pub/ascii/cv12.txt.; Robert Brame and others, “Demographic patterns of cumulative arrest prevalence by ages 18 and 23,” Crime & Delinquency (2014); E. Ann Carson and Daniela Golinelli, “Prisoners in 2012: Trends in Admissions and Releases, 1991-2012” (Washington: Bureau of Justice Statistics, 2013), p. 25, available at http://www.bjs.gov/content/pub/pdf/p12tar9112.pdf.
86. Vanessa Cardenas and Sarah Treuhaft, eds., All-In Nation: An America that Works for All (Washington and Oakland: Center For American Progress and PolicyLink, 2013).
87. Bruce Western and Becky Pettit, “Collateral Costs: Incarceration’s Effect on Economic Mobility” (Washington: The Pew Charitable Trusts, 2010); Jeremy Travis and Steve Redburn, eds., The growth of incarceration in the United States: Exploring causes and consequences (Washington: National Research Council, 2014); Kevin Roy, “Fatherhood Arrested: Parenting from within the juvenile justice system,” Social Forces 82 (1) (2003); Carrie Moylan and others, “The Effects of Child Abuse and Exposure to Domestic Violence on Adolescent Internalizing and Externalizing Behavior Problems,” Journal of Family Violence 25 (1) (2010): 53–63.
88. David Farbman, “The Case for Improving and Expanding Time in School: A Review of Key Research and Practice” (Washington: National Center on Time and Learning, 2012).
89. U.S. Census Bureau, “Public Education Finances: 2015” (Washington: Government Printing Office, 2017).
90. Julien Lafortune, Jesse Rothstein, and Diane Whitmore Schanzenbach, “School Finance Reform and the Distribution of Student Achievement: Dataset,” American Economic Journal: Applied Economics (2018), available at https://doi.org/10.1257/app.20160567.
91. Kirabo Jackson, Rucker C. Johnson, and Claudia Persico, “The Effects of School Spending on Educational & Economic Outcomes: Evidence from School Finance Reforms,” The Quarterly Journal of Economics 131 (1) (2015): 157–218.
92. Ibid.
93. When we recalculated their benefit-cost ratio, we found it to be about 2.1. This is similar to the ratio they reported in an earlier NBER version of the paper.
94. United States Census Bureau, “Annual Survey of School System Finances, 2018 Public Elementary-Secondary Education Finance Data” (2020).
95. Per the U.S. Bureau of Labor Statistics, Quarterly Census of Employment and Wages, “Employment and Wages, Annual Averages 2018” (2019), average wages in 2018 were $57,266 and total wages were $8.37 trillion (57,266 times 146,131,754 employees). $8.37 trillion times 0.077 equals an annual $644 billion wage increase when the program is fully phased in. A phased-in annual average wage increase of $644 billion for workers between the ages of 19 and 67 who experience some or all of the 60 years of education investments equals $2.27 trillion in present value at a 6 percent discount rate. GDP in 2018 was $20.49 trillion, or 2.45 times the magnitude of total average wages. Hence, the present-value GDP increase was $2.27 trillion times 2.45, or $5.56 trillion. Present-value taxes were calculated as 25 percent of U.S. present-value GDP, consistent with OECD estimates.
96. Yield rates were retrieved on August 17, 2020 from the U.S. Treasury Department. See “Daily Treasury Yield Curve Rates,” available at https://www.treasury.gov/resource-center/data-chart-center/interest-rates/pages/TextView.aspx?data=yield (last accessed September 16, 2020).
97. See, for example, Congressional Budget Office, “Estimated Impact of the American Recovery and Reinvestment Act on Employment and Economic Output from October 2011 through December 2011”; Council of Economic Advisers, “The Economic Impact of the American Recovery and Reinvestment Act of 2009: Fourth Quarterly Report”; Zandi, “An Analysis of the Obama Jobs Plan.”
98. Janet Currie and Matthew Neidell, “Getting Inside the ‘Black Box’ of Head Start Quality: What Matters and What Doesn’t,” Economics of Education Review 26 (1) (2007): 83–99; Fuhua Zhai, C. Cybele Raver, and Stephanie M. Jones, “Academic Performance of Subsequent Schools and Impacts of Early Interventions: Evidence from a Randomized Controlled Trial in Head Start Settings,” Children and Youth Services Review 34 (5) (2012): 946–954; Kimber Bogard and Ruby Takanishi, “PK–3: An Aligned and Coordinated Approach to Education for Children 3 to 8 Years Old,” Social Policy Report (2005): 3–24.