Introduction
[T]here can be no question but that the slavery … must be injurious to science; since the minds of our slaves are never cultivated. The same reason will always render it unfavourable to trade and manufactures, which have ever flourished in free states. Commerce especially flies from oppression, and rests only on the wings of liberty. If slavery then be necessarily an enemy to arts and sciences, good policy would surely direct us to suppress it.
-Arthur Lee, 17641
Arthur Lee, a member of the famous Lee family of Virginia and one of the more prominent opponents of slavery among the Tidewater planter elite, foreshadowed a long record of research portraying slavery as a backward economic institution that limited investment in education and skills. Developments over the next century would prove Lee largely correct—developments that still inhibit the economy of the American South today and contribute to our polarized politics.
Exciting new series examines whether history can help us understand how technology impacts growth & inequality! https://t.co/wvEW2HO1xH
— Equitable Growth (@equitablegrowth) November 18, 2015
After the American Revolution, Northerners democratized access to education, knowledge, and invention. The number of Northern children attending school rose dramatically; libraries, mechanic institutes, and scientific organizations became increasingly common; and periodicals such as the Journal of the Franklin Institute eagerly reported new technological breakthroughs. This widespread production and distribution of knowledge in the North helped create a culture of inventiveness. By the 1840s, Northerners had the highest patenting rates in the world, outstripping even Great Britain, the undisputed economic power of the Atlantic World.
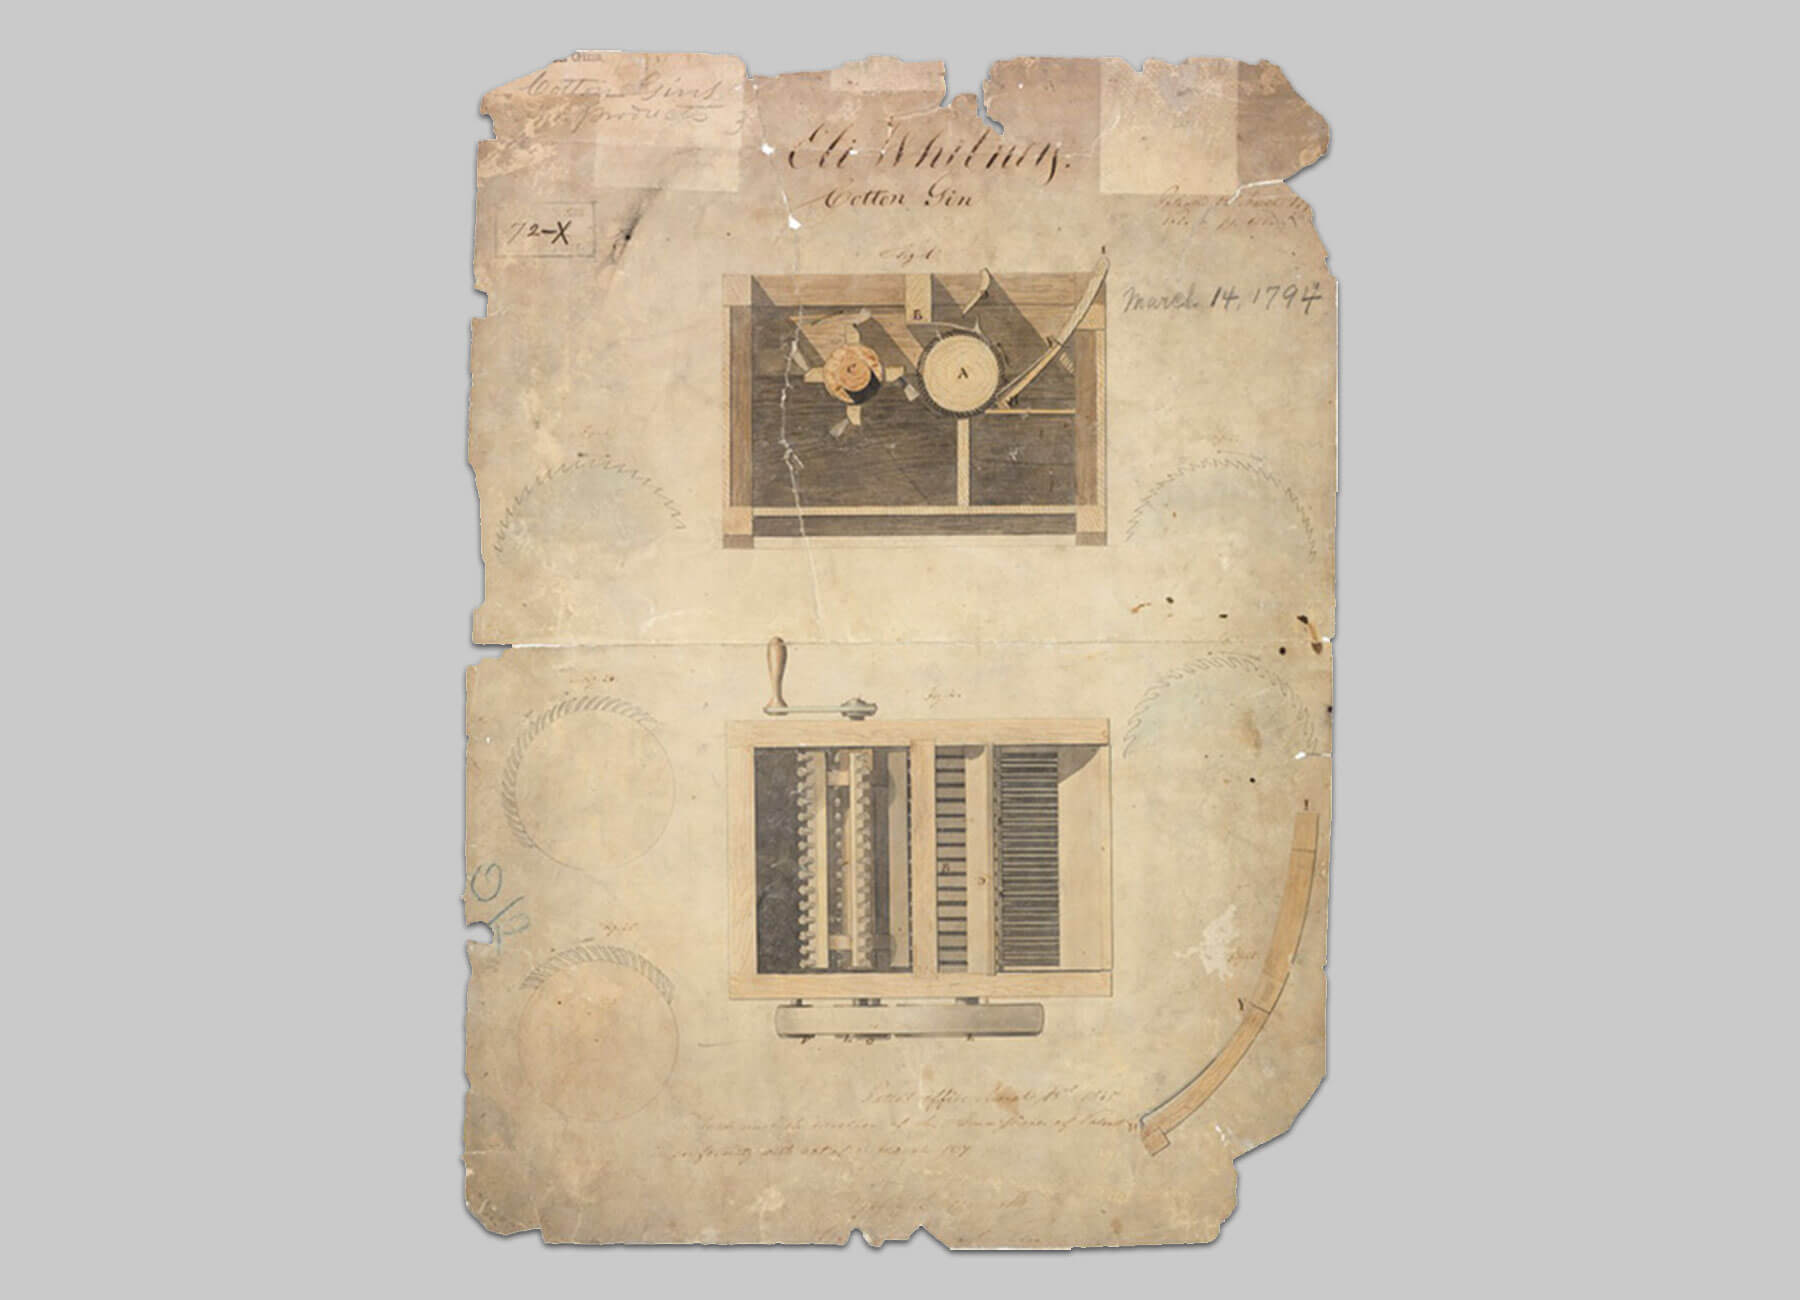
The slave South, in contrast, stood outside this creative culture. Instead of encouraging education and widespread innovation, Southern slaveholders focused on the production of a relatively narrow band of commodities, most especially cotton, sugar, rice, and tobacco. Not surprisingly, the South also lagged behind in inventive activity. In 1860, the South contained about 30 percent of the nation’s population, yet only accounted for 5 percent of the nation’s patents.2 Slavery was indeed “an enemy to arts and sciences.”
To the extent there has been sustained analysis about the South’s lack of economic creativity, scholars have focused on the region’s high levels of inequality and a relative lack of democracy. Southern slaveholders, the argument goes, constituted a powerful economic and political elite that could afford to ignore calls to democratize education and innovation. Politically powerful slaveholders, for example, refused to invest in schools and other economic infrastructure in western Virginia, eastern Tennessee, and the other non-slaveholding portions of the South. 3
Focusing exclusively on the relationship between slavery and inequality, however, does not explain the full story. A number of slave states and localities lacked a strong planter elite, and also had highly competitive electoral systems in which politicians fought for every vote. As this report will demonstrate, these areas had only marginally better school attendance and patenting rates than more aristocratic political cultures in coastal South Carolina and the Tidewater region of Virginia.
Nor is inequality always antithetical to economic creativity. In the antebellum decades, inequality rapidly increased in cities such as New York, Boston, and Philadelphia, where a powerful mercantile and industrial elite emerged that was generally far removed from the concerns of everyday citizens. These cities nevertheless became key centers of innovation. The same is true in our own 21st century economy. New York, Massachusetts, and Connecticut rank among the most economically creative states, yet also have some of the highest levels of inequality.
Analyzing a database of more than 3,000 patents issued from 1848 to 1852, I argue that the inequality inherent in slavery constituted an important cultural and ideological barrier to investment in education and innovation. I also present a case study of the Kentucky Bluegrass Region, a slave economy with a dense population of free workers, a well-developed manufacturing sector, and high levels of urbanization. Despite its close proximity to the Midwest, the school attendance and patenting rates in the Bluegrass resembled those of Alabama and Mississippi, rather than those of Ohio and Indiana. Inequality—at least inequality narrowly defined as the distribution of wealth—was not the culprit. Louisville was no more unequal than Cincinnati, Cleveland, or other Northern cities.
The lesson from the 19th century—which seems applicable to today’s economy as well—is that not all types of inequality are alike. Rather than focusing on economic inequality per se as a factor inhibiting economic creativity, my study encourages scholars to think about particular forms of inequality that discourage innovation and technological change. Slavery was a powerful conservative force that made the spread of knowledge and ideas potentially dangerous, and slaveholders often opposed the democratization of knowledge. Inventors and others with a stake in economic creativity thus avoided slave cities and regions. It was not so much economic inequality per se that deterred inventors from moving into areas with slavery, but the particular form of inequality that slavery represented.
The legacy of this particular form of inequality still lingers across much of the American South. Because of a long legacy of slavery and racism, many states in the Deep South still lack the civic and educational institutions necessary to sustain economic creativity. Rather than invest in economic creativity, many states in the Deep South favor low-cost manufacturing and services. Focusing on low-cost manufacturing and services has led these states to persistently oppose education and health care that can promote the kind of innovation and entrepreneurship necessary for sustained and equitable economic growth. Understanding these forms of inequality is key if policymakers in these states are going to set their sights on reforms that will help eclipse slavery’s enduring legacy.
Slavery and patenting rates
“Economic creativity” is a broad category that captures a set of simultaneous changes that included the development of new technologies, widespread access to education, dissemination of new knowledge, and the growth of markets that encouraged new products and industry. We can think of economic creativity in terms of a Schumpeterian framework, where capitalism is defined as a system that “incessantly revolutionizes the economic structure from within.”4 The emphasis on from within is Joseph Schumpeter’s—his conception of capitalism is an economy that systematically and relentlessly generates change and innovation. It is not surprising that the 20th century Austrian-American economist is famous for coining the term “creative destruction” to denote how economic creativity can upend long-established traditions and industries. Economic creativity is the process that systematically generates change and innovation. In the North, economic creativity produced tens of thousands of new inventions and innovations that collectively set into motion the revolutionary changes we associate with the Industrial Revolution.
How can we measure economic creativity? I use patenting rates as a rough-and-ready proxy for economic creativity. The U.S. patenting system was relatively open and democratic compared to the rest of the world. Following the Patent Act of 1836, patent applicants had to submit a model, write a detailed description, and pay a modest application fee. The patent office published a record of each patent, which included the name and residence of the inventor, allowing historians to construct a county-by-county map of patentees. While many patents had little economic value, even a worthless patent indicates a commitment to economic creativity. We should expect, after all, that innovation and invention would naturally result in a good many missteps and dead ends.5
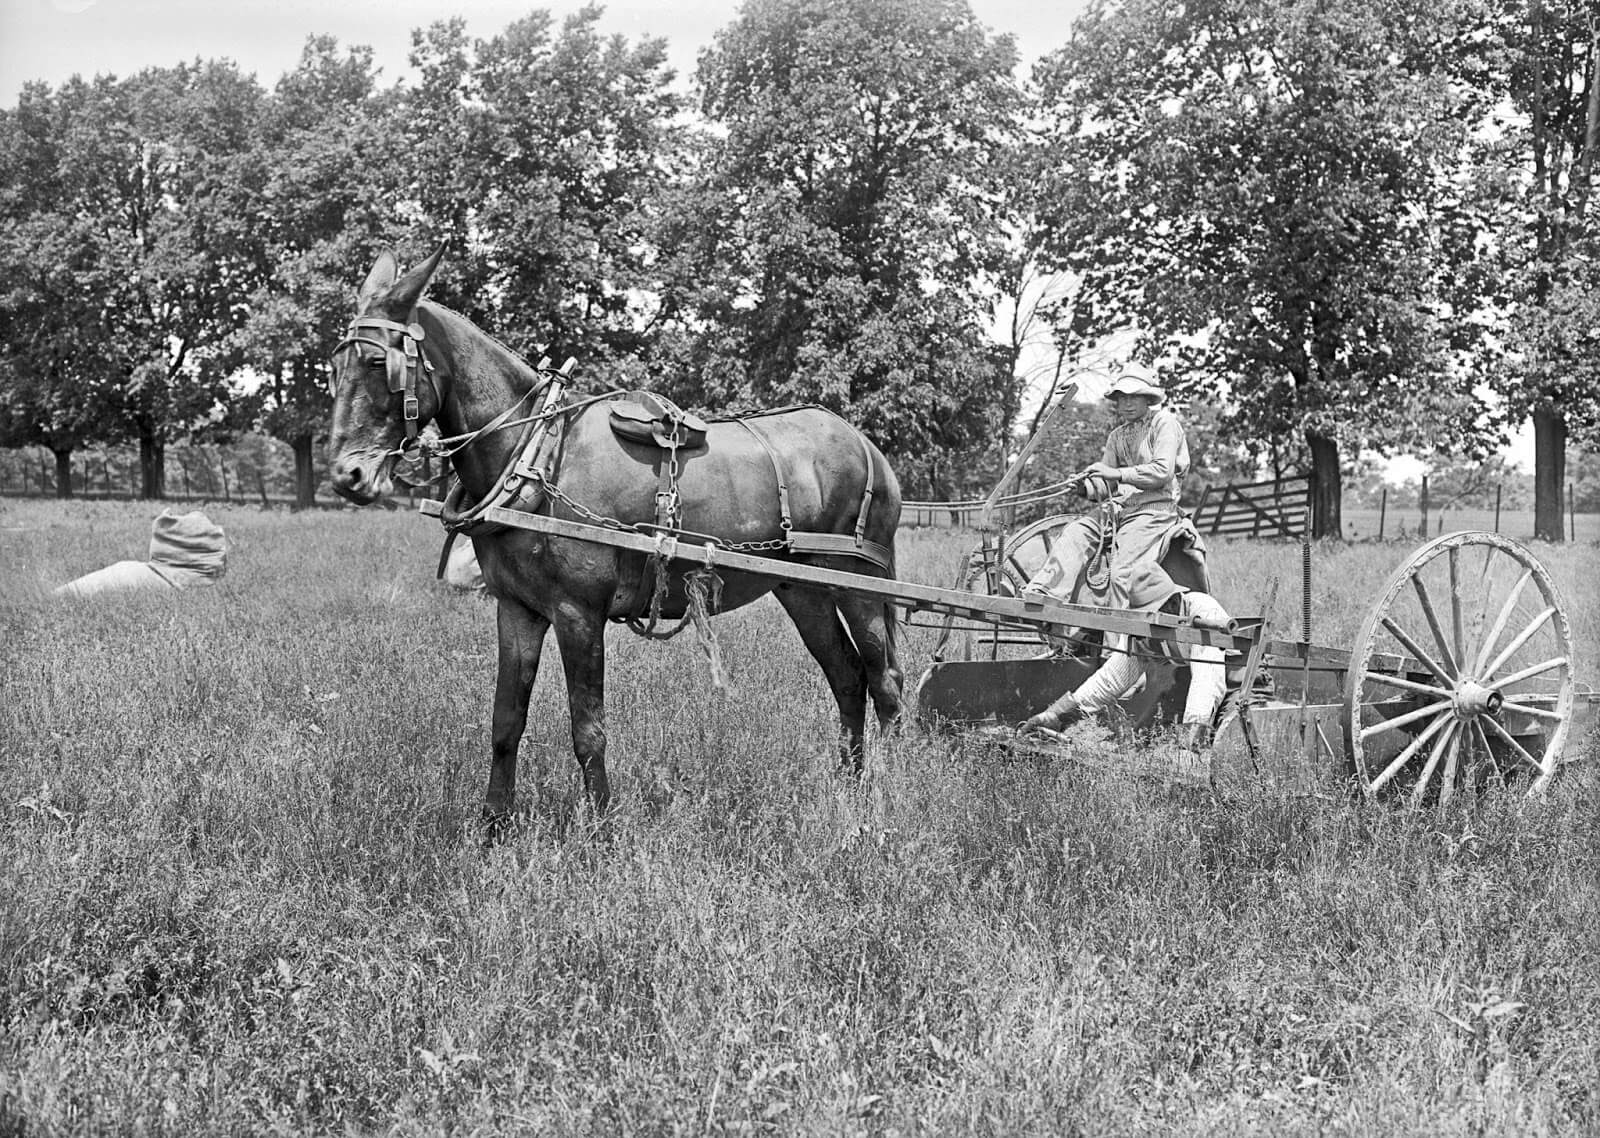
A more serious problem is that my database might not capture important innovations that could not be patented. Innovation in agriculture—such as new seeds or better plowing techniques—would be especially likely to be undercounted, thus potentially understating Southern inventiveness. It is not clear, though, why Southern agriculture would produce more unpatented innovations than Northern agriculture. To the extent that Northerners had more agricultural societies and more agricultural periodicals, patents may actually underestimate the creativity divide between North and South.
Even if patents were not a perfect indicator of innovation and invention, the gap between the two regions was sufficiently large to indicate a monumental creativity gap. New England and the Middle Atlantic constituted the core areas of economic creativity, with particularly high patenting rates in large cities such as Boston and New York. There is a clear east-west gradient, as newly settled areas in the Midwest (especially Illinois and Indiana) struggled to develop networks of invention. Notice, though, that Ohio already showed a strong inclination toward invention. (See Figure 1.)
Figure 1
In sharp contrast, much of the South was a creativity desert, with no successful patent applications filed during the four-year period. While it is not surprising that a society of plantations and enslaved people produced relatively little invention, even more urbanized areas of the South had far lower patenting rates than the North. Along the Ohio River, for example, patenting rates fell rather dramatically on the Southern side. The partial exception to this general rule is Maryland, which had patenting rates somewhat higher than the rest of the South thanks to the booming metropolis of Baltimore. Baltimore’s patenting rate (57 patents per million residents), though, was significantly lower than nearby Philadelphia’s (120 patents per million residents).
Slavery and public school rates
The same pattern is apparent when examining school attendance rates. Beginning in 1850, census takers asked every household the number of children attending school in the past year. The most industrialized regions of the North that had the highest patenting rates—New England, upstate New York, and northeastern Ohio (the Cleveland area)—also had the highest levels of school attendance among children ages 5 to 14. (See Figure 2.)
Figure 2
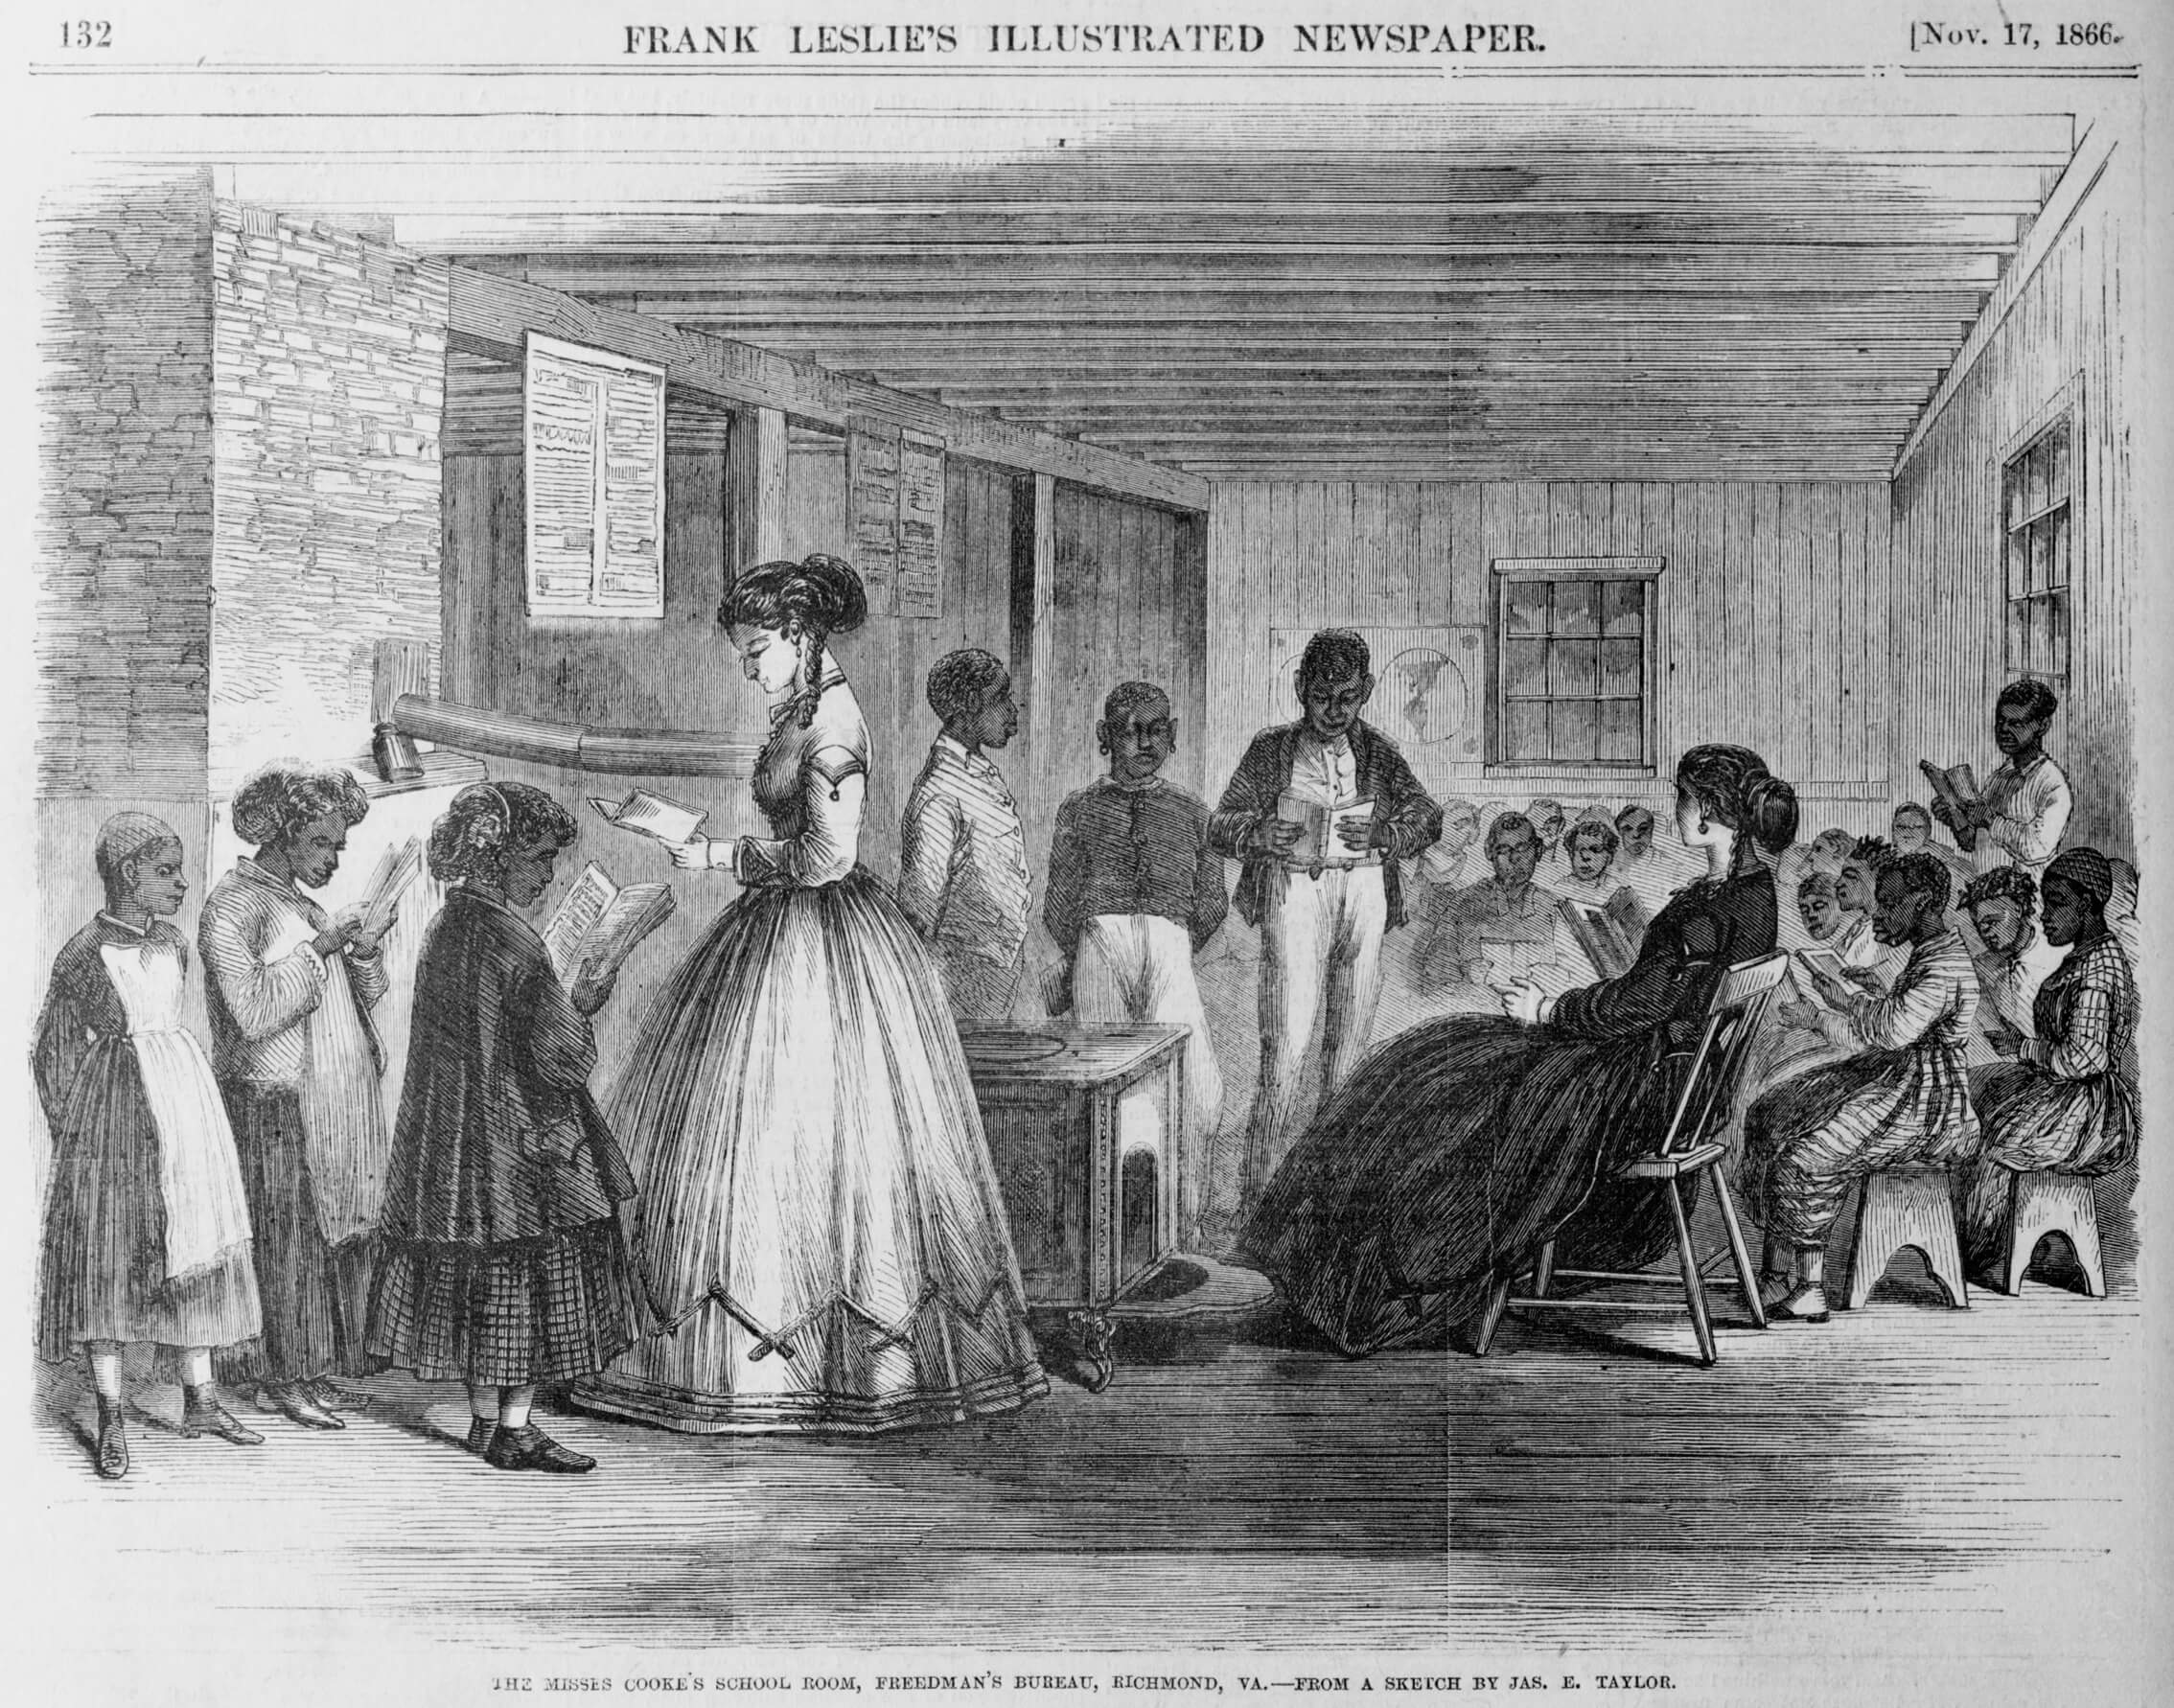
In contrast, only 39 percent of white children between the ages of 5 to 14 in the South attended school in 1850. It bears emphasizing that the 39 percent figure is for whites only—if enslaved children are included, then the number of Southern children attending school falls below 30 percent.6 As with patenting rates, there was a sharp and immediate drop in school attendance along the Mason-Dixon line, indicating that slavery discouraged investments in education. Even in areas where slavery was relatively weak, such as Maryland and Delaware, school attendance lagged behind Northern neighbors. The one major area of the North that lagged behind the rest of the region was southern Illinois—an area largely settled by Southerners who held enslaved people in long-term “indentures” through the 1840s.
Maps 1 and 2 indicate that inequality itself did not stunt economic creativity. As commercialization and industrialization accelerated, inequality grew rapidly in Northern cities and in the Northern countryside. New England, generally regarded in the colonial era as far more equal than other regions, saw a marked increase in inequality as agriculture became increasingly commercialized and manufacturing expanded. As historian Edward Pessen noted several decades ago, the distribution of wealth in Northern cites “was impressively consistent and glaringly unequal.”7 This makes sense—even in our 21st century economy, regions with high levels of economic creativity experience a marked increase in inequality. Silicon Valley and New York City, after all, are hardly strongholds of egalitarianism. Inequality most mattered for economic creativity when it came in the form of slavery.
Economic creativity in the Kentucky Bluegrass region
One implication for my argument is that if a region with slavery had a similar economy and geography as the North, then its schooling and patenting rates would still lag behind northern levels. The Kentucky Bluegrass was such a region. Located in northern Kentucky, the Bluegrass (broadly defined) covers an area of about 10,000 square miles, which is about the size of Maryland.8 The Bluegrass had a population of more than half a million residents in 1860, about 125,000 of whom were enslaved. Despite the importance of slavery, superb soils and a moderate climate allowed Bluegrass planters and farmers to create a cultivation regime that resembled the Midwest more than the South.
The Bluegrass supported population densities that resembled the Midwest far more than the rest of the South. The population density of the Bluegrass in 1860 was nearly 53 people per square mile, which was much closer to Ohio’s (58 people per square mile) than the South as a whole (17 people per square mile, excluding Texas).9 The flourishing rural economy of the Bluegrass supported substantial urban growth. Louisville, Covington, and Newport—all located on the banks of the Ohio—ranked among the nation’s 100 largest cities, while Lexington, Danville, and Frankfort served as the commercial centers for the region’s interior. The area’s urbanization rate was 22 percent, which exceeded the national average.
The Bluegrass’ soils and climate supported a variety of crops, including hemp, tobacco, wheat, and corn, which encouraged a vibrant manufacturing sector focused on agricultural processing. Hemp, a strong, fibrous plant that needed particularly fertile soils and a moderate climate, could be processed into cordage and bagging. In the first two decades of the 19th century, hemp production gave rise to a number of workshops and factories in Lexington and Louisville. Distilling was another prominent industry, as the area’s robust corn yields and pure limestone waters helped make the Bluegrass a major center of whiskey production. Outside of agricultural commodities, the Bluegrass’s rural economy generated a healthy market for local construction and manufacturing. By 1860, the value added of Bluegrass manufacturing was nearly $23 per person, which was about three times higher than the rest of the South and significantly higher than the Midwest average of $17 per person.10
Yet despite an economy that was in some ways more advanced than that of the Midwest, the Bluegrass region still generated low levels of inventive activity when compared to Ohio and other Northern states. Before 1840, the processing industries of the Bluegrass (such as hemp and distilling) created a manufacturing sector that encouraged innovation, which allowed the region to keep pace with Ohio. These early Bluegrass patentees might have established an inventive community that could have encouraged further innovation. With a critical mass of inventors, a city or town could attract skilled workers, build educational institutions, and establish markets for patented inventions, thus making the locale even more attractive for inventors. The Bluegrass, however, failed to sustain such a virtuous cycle, and the region steadily fell behind Ohio. The average annual patenting rate for Ohio between 1857 and 1860 was 125 per million, while that for the Bluegrass was 60 patents per million free residents.
A more detailed examination of the data shows that patenting rates were particularly low in the rural Bluegrass. The entire rural Bluegrass—an immensely productive and highly diversified agricultural region of nearly 400,000 residents—generated a total of 19 patents from 1857–1860. On an annual basis, the rural Bluegrass produced an average of 17 patents per million, or about the same average as the South as a whole. During the same period, rural Ohioans produced 569 patents for an annual patenting rate of 82 per million, nearly five times higher than the rural Bluegrass. The stark difference between the rural Bluegrass and rural Ohio is one clear indication that plantation slavery stymied inventive activity.
The major cities of the Bluegrass—Louisville, Covington, Newport, and Lexington—did better than the region’s rural areas, but they still lagged well behind Ohio’s cities. This was especially true for Louisville. Given its status as the nation’s 12th largest city and its strategic location at the falls of the Ohio River, one might think that Louisville would become a major center of invention. Louisville’s booming commerce, though, did not generate inventive activity at the level of Ohio’s major cities. Louisville’s patenting rate (118 patents per million) was far lower than that of Cincinnati and Cleveland.
Cincinnati was the Midwest’s major industrial center before the Civil War, so its high patenting rate is no great surprise, especially given the importance of the strong association between manufacturing and patenting. In Queen City—so named because its citizens referred to it as the “Queen of the West”—a substantial machinery industry created a group of highly skilled workers and engineers who had the skills, resources, and markets to engage in inventive activity.11 More striking was Cleveland’s sudden rise as a major center of innovation. In 1850, Cleveland was a small city (population 17,000) with a patenting rate about the same as that of Louisville. By 1860, its population surpassed 43,000 while its patenting rate increased fivefold. Cuyahoga County (consisting of Cleveland and its immediate vicinity) accounted for 166 patents in the 1850s, almost as many as the entire Bluegrass for the same decade.
It is not clear what role economic inequality played in suppressing economic creativity in the Bluegrass. On one hand, the Bluegrass supported a small group of wealthy slaveholders who dominated both local and state politics. According to the 1860 census, 802 households in the Bluegrass owned more than 20 enslaved people, while another 3,086 owned 10 to 19 enslaved people. The wealth and power of these slaveholders was a constant force in Kentucky politics. Though considerable anti-slavery sentiment emanated from the mountainous sections of the state as well from the Bluegrass cities along the Ohio River, including Louisville and Covington, the planters usually had the upper hand.
In 1850, for example, the state passed a new constitution with special provisions to protect slavery and an explicit declaration of slavery as a positive good. In the words of historian Harold Talent, Kentucky’s 1850 constitution “was the most strongly proslavery state constitution yet written in the United States.”12 But in many respects, the Bluegrass was quite different than other areas of the South. In the cities along the Ohio River, including Louisville, Covington, and Newport, slavery was necessarily weak. Even in the rural Bluegrass, the substantial number of yeoman farmers made the region’s distribution of wealth far different than that of the cotton South. The planters of the Bluegrass, moreover, hardly fit the stereotype of the conservative slaveholders who opposed any government action to promote economic progress. Bluegrass slaveholder Henry Clay, the architect of the Whig Party’s “American System,” supported protective tariffs, internal improvements, and a national bank as part of a plan to spur economic modernization.
Economic inequality was certainly part of the problem for the Bluegrass, but something more was at work. Slavery created especially conservative attitudes toward schooling and inventiveness. One might think that the modernizing slaveholders of the Bluegrass would support investment in education and work to increase inventive activity, but that was not the case. An 1851 state government report shows that in 967 rural school districts in the Bluegrass region, 39 percent of children between the ages of 5 and 16 attended common schools.13 Such low school attendance rates were much closer to those of Alabama and Mississippi than those of Pennsylvania and Ohio. Bluegrass planters, no matter how eagerly they supported internal improvements and the national bank, had no interest in educating ordinary Kentuckians. Slavery deterred education and innovation, regardless of the quality of the soils, the degree of urbanization, the size of the manufacturing sector, the distribution of wealth, or the economic ideology of the planters.
The example of the Bluegrass suggests that slaveholders feared the democratization of education and the growth of a public sphere they could not control. James Henry Hammond, a famous exponent of Southern extremism and pro-slavery ideology, spoke for many slaveholders when he argued that a relatively small number of “men of learning” should carefully control southern society. Hammond, according to historian Drew Giplin Faust, wanted “the ideological hegemony of the master class to be absolute.”14 A more democratic system of public education risked creating something similar to the North’s public sphere, which for all of its unequal access (especially in terms of gender and race) nevertheless allowed the development of radical calls for abolition, racial equality, and women’s rights.
Southerners often resorted to censorship and outright violence to limit anti-slavery discourse. While some Southerners called for more common schools, educational “reform” in the South often became calls for more Southern universities and more Southern literature to instill ideological purity in the sons and daughters of the slaveholding elite. Economic creativity could hardly flourish in such a repressive environment.
Understanding inequality and creativity in 21st century America
The relationship between slavery and economic creativity helps us understand why Northerners fought so hard to prevent the expansion of slavery. If even a “little” slavery could undermine schooling and inventive activity, then the prospect of slavery spreading across the Midwest presented an existential threat to the North’s creative economy. Abraham Lincoln, the only U.S. president to hold a patent, demonstrates the point. In 1858 in his famous address to the Wisconsin Agricultural Society where he outlined his version of free labor ideology, Lincoln emphasized how slaveholders opposed education. Lincoln argued that Southern pro-slavery theorists believed that laborers were akin to “a blind horse upon a treadmill.” Lincoln noted that Southerners considered educated workers to be “not only useless, but pernicious and dangerous. In fact, it is, in some sort, deemed a misfortune that laborers should have heads at all. Those same heads are regarded as explosive materials, only to be safely kept in damp places, as far as possible from that peculiar sort of fire which ignites them.”15
Lincoln touted the Northern model of education, in which “every head should be cultivated, and improved, by whatever will add to its capacity for performing its charge. In one word free labor insists on universal education.” Universal education, he believed, would democratize economic creativity. For the educated farmer who studied botany, chemistry, and other subjects, “every blade of grass is a study; and to produce two, where there was but one, is both a profit and a pleasure.” Every conceivable operation of the farm—from irrigation to planting to harvesting to livestock to implements—was “a world of study within itself.”16 It is not surprising that Lincoln feared that the expansion of slavery might undermine the creative economy he hoped to extend and strengthen.
Lincoln was hardly alone in this critique of slavery, as associating slavery with ignorance and sloth became standard arguments in anti-slavery appeals. An 1849 meeting of the “mechanics and laboring men” of Louisville observed that slavery degraded free labor, not only because it lowered wages to “the coarsest food and clothing,” but also because enslaved people were “systematically and intentionally shut out from education.” In a free-labor economy, “knowledge and intelligence cannot be too generally diffused or too highly appreciated,” but “Slavery looks with [a] suspicious eye on such of her victims as are so unfortunate to be able to read and write.” Recounting the stunted and underdeveloped common school systems in Kentucky and the rest of the South, the address concluded that “slavery cannot, by possibility, permit that intelligent, economical, and wealth-producing population, which is necessary for the support of a good system of common schools.”17
The regional differences that Lincoln and the Louisville workers noted are still apparent today. Because institutions that generate economic creativity tend to be self-reinforcing, localities that were creative in the 19th century are more likely to be so in the 21st century, while areas that failed to develop the infrastructure for creativity in the antebellum period are more likely to struggle today. This is especially true of the South, where regions such as the Mississippi Delta and Appalachia that had very low levels of economic creativity in the Civil War Era continue to do so. More generally, it turns out that states with low patenting rates in 1850 tended to have low patenting rates in 2014. (See Figure 3.)
Figure 3
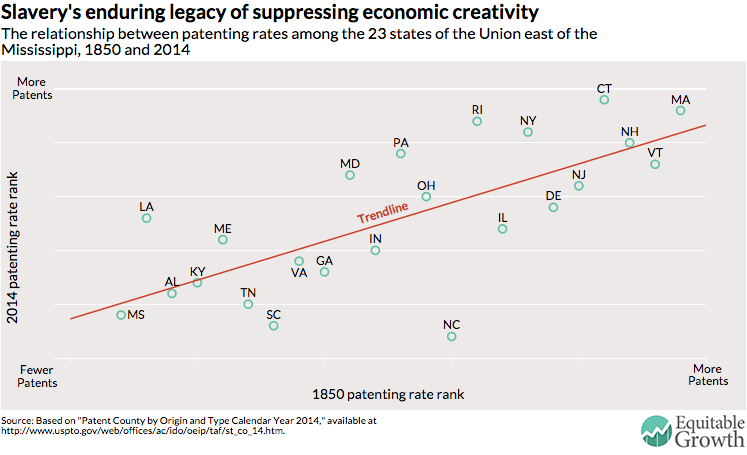
The relationship between the slave and free states and their differing patenting rates is strongly positive—states that ranked high in patenting in 1850 did the same in 2014, while states that ranked poorly remained stuck at the bottom in 2014. Massachusetts, for example, ranked second in 1850 and first in 2014; Mississippi ranked 23rd in 1850 and 21st in 2014. Nine out of the 10 worst-performing states in both 1850 and 2014 were slave states. More than 150 years after it had been abolished, slavery was still (in the words of Arthur Lee) “an enemy to arts and sciences.”
Conclusion
In somewhat more speculative fashion, thinking about different types of inequality is important in explaining our own political and regional divides. The Northeastern states that do the best in terms of patenting also tend to do well in terms of educational achievement, whether measured by high school or college degrees. Conversely, the former Confederate states still lag behind in educational achievement, although the gap is now much smaller than it was in the Civil War era. Inequality is actually higher in the Northeastern blue states (plus California, another creative economy), with the Southern red states close behind. The origins and impact of inequality, however, are different in each region. As noted above, creative economies tend to be characterized by increasing returns—innovators and skilled workers tend to cluster with other innovators and skilled workers to form networks where information and highly specialized labor are easier to acquire. Creative workers also strongly prefer the amenities (such as a variety of fine foods and other cultural experiences) that large cities such as New York, Boston, and San Francisco can provide. In the words of urban studies professor Richard Florida, “place matters” when it comes to the location of economic creativity.18
One implication of these various types of increasing returns is that cities and states with high levels of economic creativity more willingly support higher taxes. California has little to fear, after all, that higher taxes will lead Facebook Inc., Google Inc., or Apple Inc. to relocate their Silicon Valley campuses to low-tax states such as Texas. To the extent that more state-and-local spending leads to better educational outcomes and more livable cities, creative economies may well depend on higher taxes.
The former states of the Confederacy, in contrast, work on a much different model. The long legacy of racism and a lack of investment in education and other forms of human capital consistently relegates the South as a low-wage region. The South still lags well behind New York, New Jersey, and the New England states in terms of percentage of the population with high school diplomas and college degrees. More reliant on low-wage manufacturing and unwilling to make big investments in education, Southern states are highly sensitive to higher taxes that might erode their cost advantage. Whereas the New England and the Middle Atlantic states lead the nation in per capita tax revenue for state and local governments—at $5,621 and $6,228, respectively—the Southeast raised only $3,404 per person.19 The South, in short, has adopted a relatively low-wage, low-tax, and low-education economy.
Focusing on the differences in the South’s low-wage and low-tax model and the creative economies of the West Coast and Northeast help us understand today’s partisan political divides. Take, for example, the expansion of Medicaid under the Affordable Care Act. For blue state economies that are centers of economic creativity, Medicaid expansion was a no-brainer, especially since the federal government would pay for most of it. Even if federal subsidies stopped at some future date, higher state taxes would do little to imperil future growth. While states with high levels of economic creativity have approved Medicaid expansion, only one of the former Confederate states (Arkansas) has done so.20 Southern politicians, eager to protect their low-wage, low-tax economy, have rejected the expansion of Medicaid because of the fear that it might lead to higher taxes in the future.
Racial politics also play a role. Because the resulting coverage gap disproportionately penalizes people of color, the failure to expand Medicaid reflects the all-too-familiar white-versus-black dynamic of southern politics.21 More than a century and a half after the Civil War, the regional creativity gap still exerts profound influence on our national politics.
About the author
John Majewski is the Interim Dean of Humanities and Fine Arts and Professor in the Department of History at the University of California, Santa Barbara, where he has taught since 1995. He earned his Ph.D. from the University of California, Los Angeles, where he won the Allan Nevins Prize in American Economic History for the best dissertation on an American subject. He is the author of A House Dividing: Economic Development in Pennsylvania and Virginia Before the Civil War (Cambridge University Press, 2000), Modernizing a Slave Economy: The Economic Imagination of the Confederate Nation (UNC Press, 2009), and numerous articles, reviews, and book chapters.
Acknowledgements
The research assistance of Debbie Pierce was especially helpful in making this paper possible.
End Notes
1. Arther Lee, An Essay in Vindication of the Continental Colonies of America from a Censure of Mr. Adam Smith, in his Theory of Moral Sentiments (London: T. Becket and P.A. De Honda, 1764), 39.
2. Domenic Vitiello analyzes the various institutions encouraging inventiveness in 19th century Philadelphia in Engineering Philadelphia: The Sellers Family and the Industrial Metropolis (Ithaca, New York: Cornell University Press, 2013). For regional share of patents, see Zorina Khan, The Democratization of Invention: Patents and Copyrights in American Economic Development, 1790-1920 (New York: Cambridge University Press, 2005), 189. For per capita patenting rates, see Kenneth Sokoloff and Naomi Lamoreaux, “Inventive Activity and the Market for Technology in the United States, 1840-1920,” National Bureau of Economic Research Working Paper 7107 (May 1999), Table 1.
3. See, for example, Khan, Democratization of Invention, 125, and Sun Go and Peter Lindert, “The Uneven Rise of American Public Schools In 1850,” The Journal of American History 70 (March 2010), 4.
4. Schumpeter, Capitalism, Socialism and Democracy, 83.
5. Kenneth L. Sokoloff, “Invention, Innovation, and Manufacturing Productivity Growth in the Antebellum Northeast,” in American Economic Growth and Standards of Living before the Civil War, ed. Robert E. Gallman and John Joseph Wallis (Chicago: University of Chicago Press, 1992), 345-378; Sokoloff, “Inventive Activity in Early Industrial America: Evidence from Patent Records,” Journal of Economic History 48 (December 1988), 813-850; Sokoloff and Lamoreaux, “Inventive Activity and the Market for Technology,” 9-16.
6. Go and Lindert, “The Uneven Rise,” 4.
7. Edward Pessen, “How Different from Each Other Were the Antebellum North and South?”, American Historical Review, 85 (Dec. 1980), 1133-34. For a detailed account of the rise of New York’s economic elite, see Sven Beckert, The Monied Metropolis: New York City and the Consolidation of the Americn Bourgeoisie, 1850-1896 (New York: Cambridge University Press, 2001).
8. I use the geographic definition found on the online version of the Kentucky Atlas & Gazetteer, which divides the Bluegrass into the Inner Bluegrass (a collection of particularly fertile counties around Lexington) and the Outer Bluegrass, which includes large urban areas such as Louisville, Newport, and Covington that can also be considered part of the Ohio River Valley.
9. Calculated from 1860 census data on the “Historical Census Browser.”
10. Manufacturing in the Bluegrass and the rest of the South was calculated from data provided by Viken Tchakerian, which was derived from the 1860 manufacturing census. See John Majewski and Viken Tchakerian, “Markets and Manufacturing: Industry and Agriculture in the Antebellum South and Midwest” in Susana Delfino and Michele Gillespie (eds.), Global Perspectives on Industrial Transformation in the American South (Columbia: University of Missouri Press, 2005).
11. On Cincinnati’s substantial manufacturing sector, see Steven J. Rose, Workers on the Edge: Work, Leisure, and Politics in Industrializing Cincinnati, 1788-1890 (New York: Columbia University Press, 1985), 67-93; Philip Scranton, “Diversified Industrialization and Economic Success: Understanding Cincinnati’s Manufacturing Development, 1850-1925,” Ohio Valley History 5 (Spring 2005, 5-22; Phillip Scranton, “Multiple Industrializations: Urban Manufacturing Development in the American Midwest,” Journal of Design History 12 (1999), 45-63.
12. Harold D. Tallant, Evil Necessity: Slavery and Political Culture in Antebellum Kentucky (Lexington: University of Kentucky Press, 2003), 158.
13. Report of the Superintendent of Public Instruction to the General Assembly of Kentucky (Frankfort: A. G. Hodges and Co., 1851), 22. The 1850 census data indicates that 43.8 percent of Bluegrass children attended school, 37 percent in common schools and 6 percent in academies.
14. Drew Giplin Faust, James Henry Hammond and the Old South: A Design for Mastery (Baton Rouge: Louisiana University Press, 1982), 272.
15. Abraham Lincoln, “Address before the Wisconsin State Agricultural Society, Milwaukee, Wisconsin September 30, 1859,” in Roy P. Basler (ed.), The Collected Works of Abraham Lincoln, vol. III (New Brunswick, New Jersey: Rutgers University Press, 1953), 479.
16. Collected Works of Lincoln, vol. III, 480.
17. Address to the Non-Slaveholders of Kentucky: Read and Adopted at a Meeting of the Mechanics and Laboring-Men At the Courthouse, April 10, 1849 (n. p.), 2, 4, 7.
18. Richard Florida, The Rise of the Creative Class Revisited (New York: Basic Books, 2012), 183-202.
19. Tax Policy Center, “State and Local Tax Revenue, Per Capita,” available at http://www.taxpolicycenter.org/taxfacts/displayafact.cfm?Docid=513 (accessed October 18, 2015).
20. State Refor(u)m, “Map: Where States Stand on Medicaid Expansion Decision,” available at https://www.statereforum.org/Medicaid-Expansion-Decisions-Map?gclid=CK6KmLqezcgCFUiEfgodWFcP4Q (accessed October 18, 2015).
21. Tara Culp-Ressler, “Obamacare Opponents Are Making Racial Inequality Worse,” http://thinkprogress.org/health/2015/04/09/3644805/coverage-gap-people-color/ (accessed October 18, 2015).