Overview
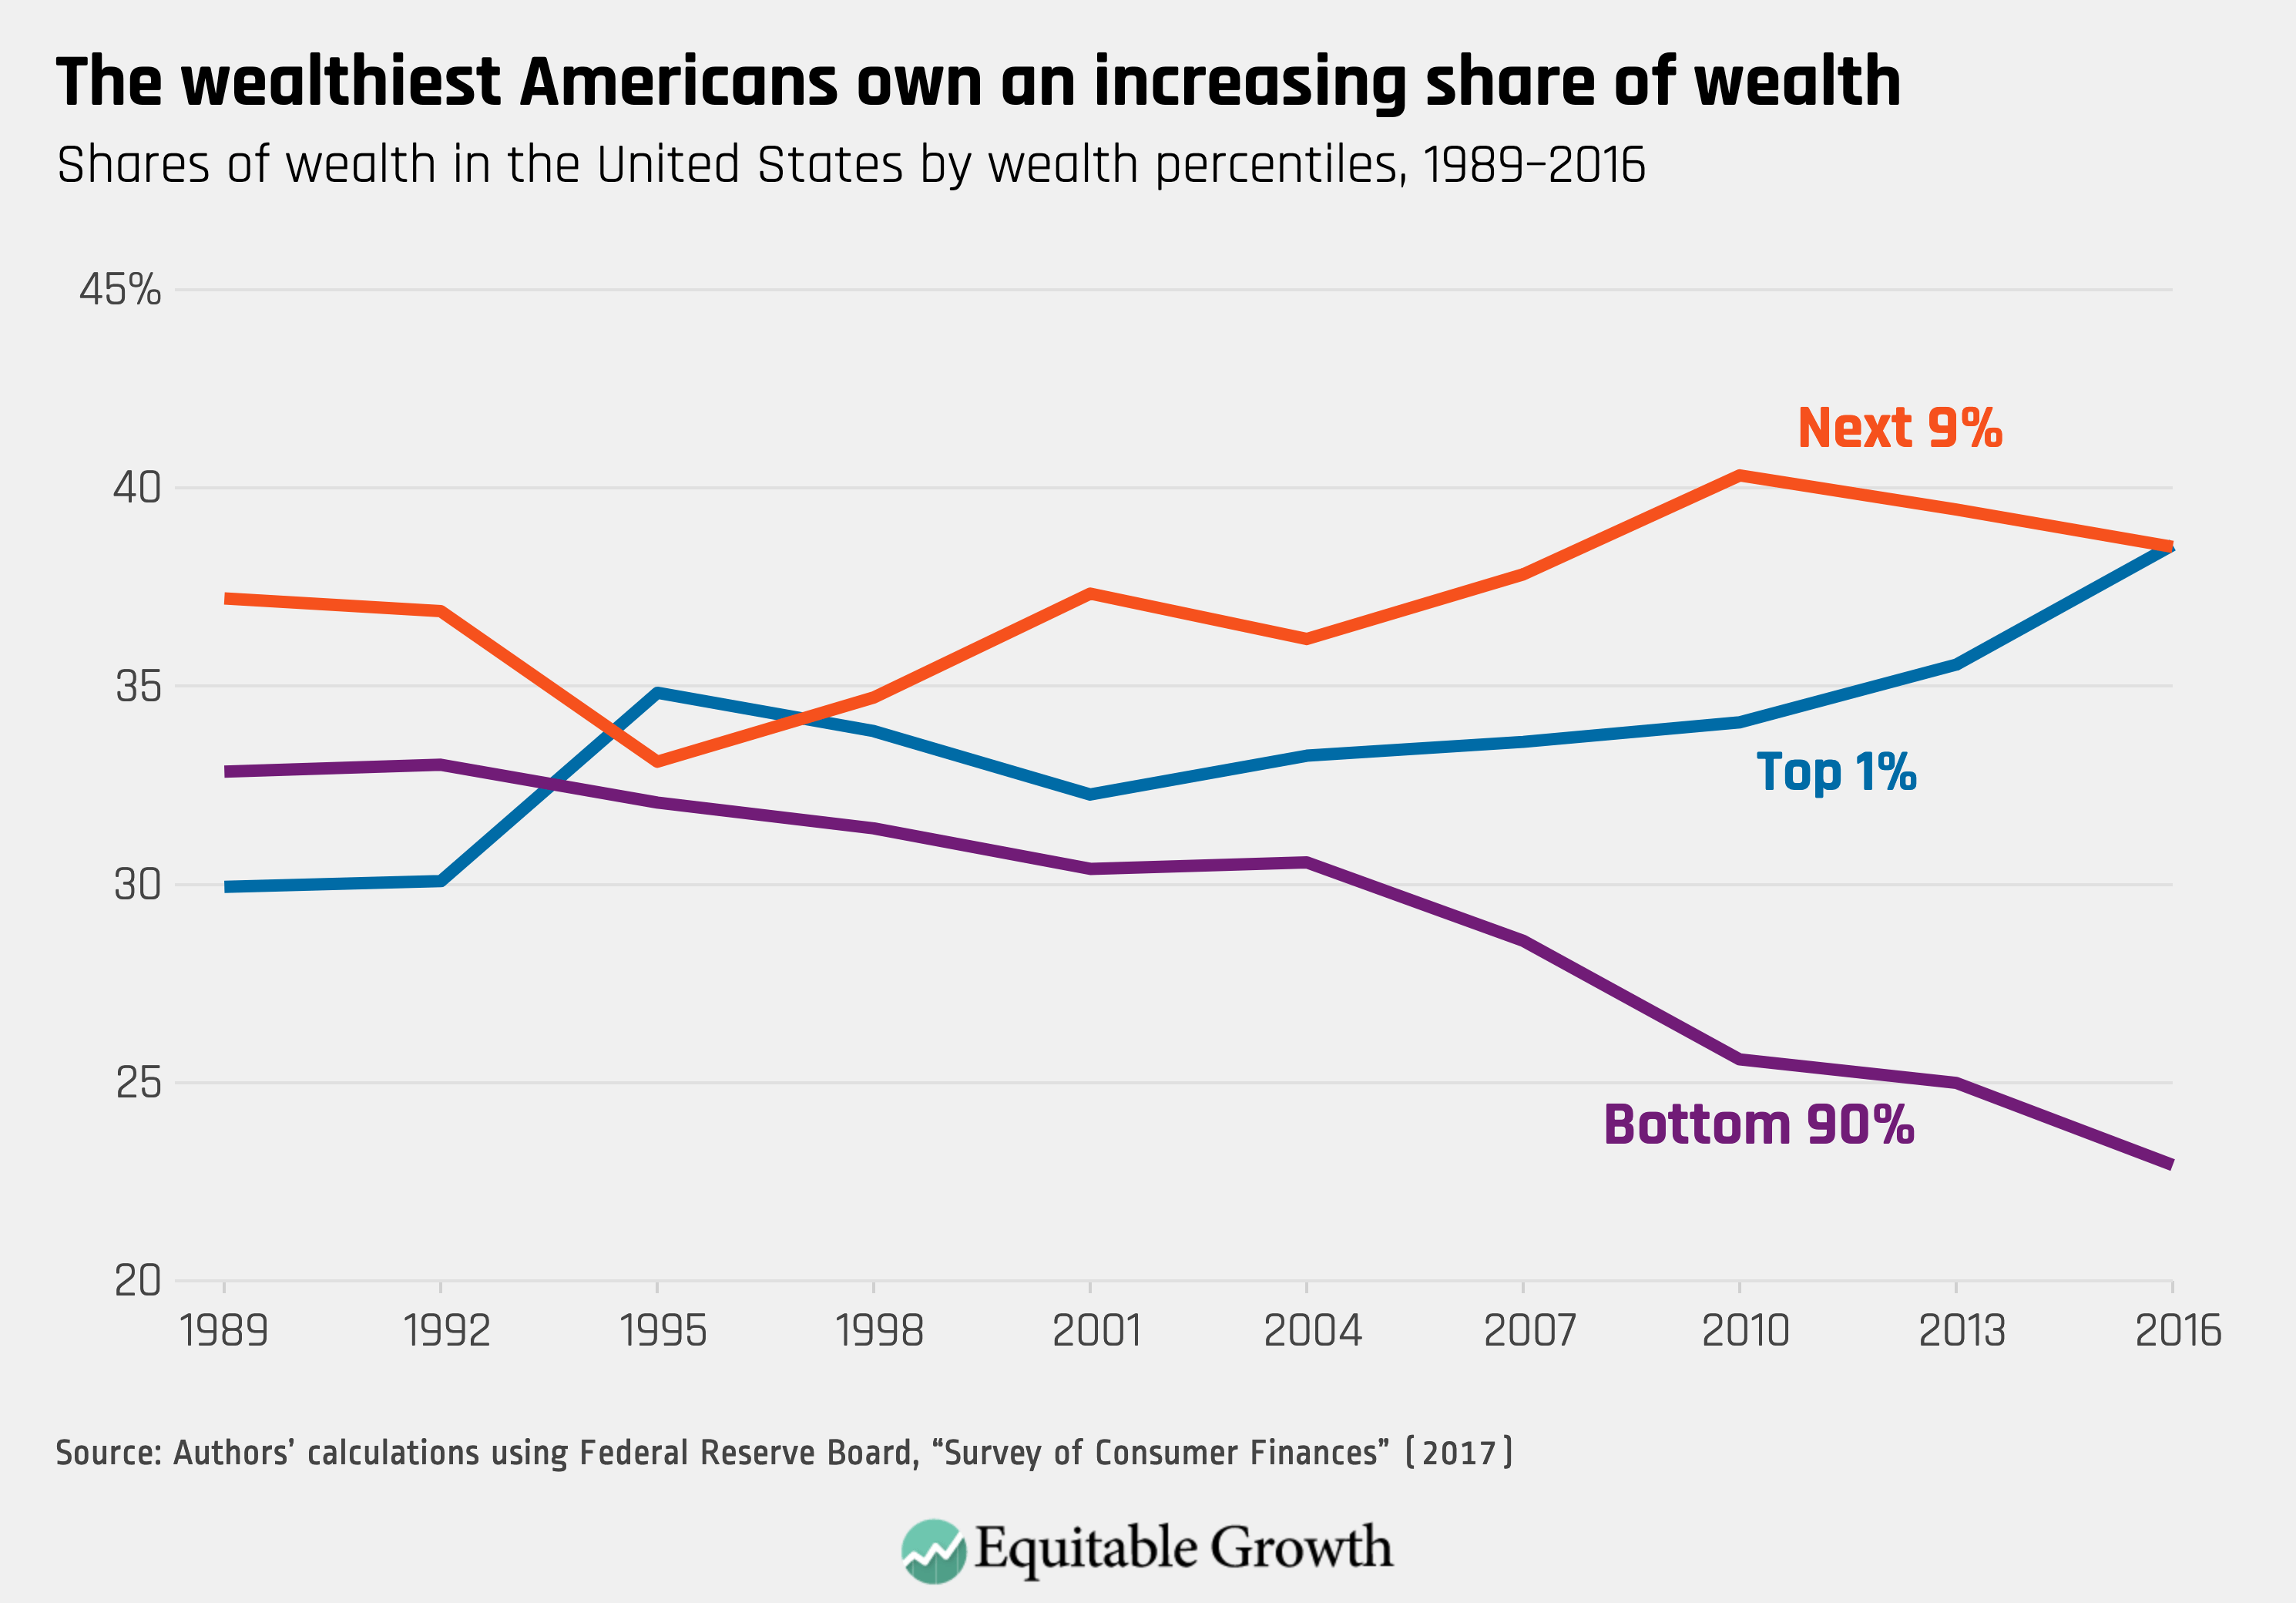
Wealth inequality in the United States is high and has increased sharply in recent decades.1 The most recent estimates available suggest that the wealthiest 1 percent of households owns about 40 percent of all wealth.2 (See Figure 1.) This increase—alongside a parallel increase in income inequality—has spurred increased attention on the implications of inequality for living standards and increased interest in policy instruments that can combat inequality. Taxes on wealth are a natural policy instrument to address wealth inequality and could raise substantial revenue, while shoring up structural weaknesses in the current income tax system.
Figure 1

The net worth tax, perhaps the prototypical tax on wealth, is a relatively unfamiliar policy instrument in the U.S. context. Yet net worth taxes have been used in countries around the world, and even though they are less common today than they were a few decades ago, they remain an important policy tool.
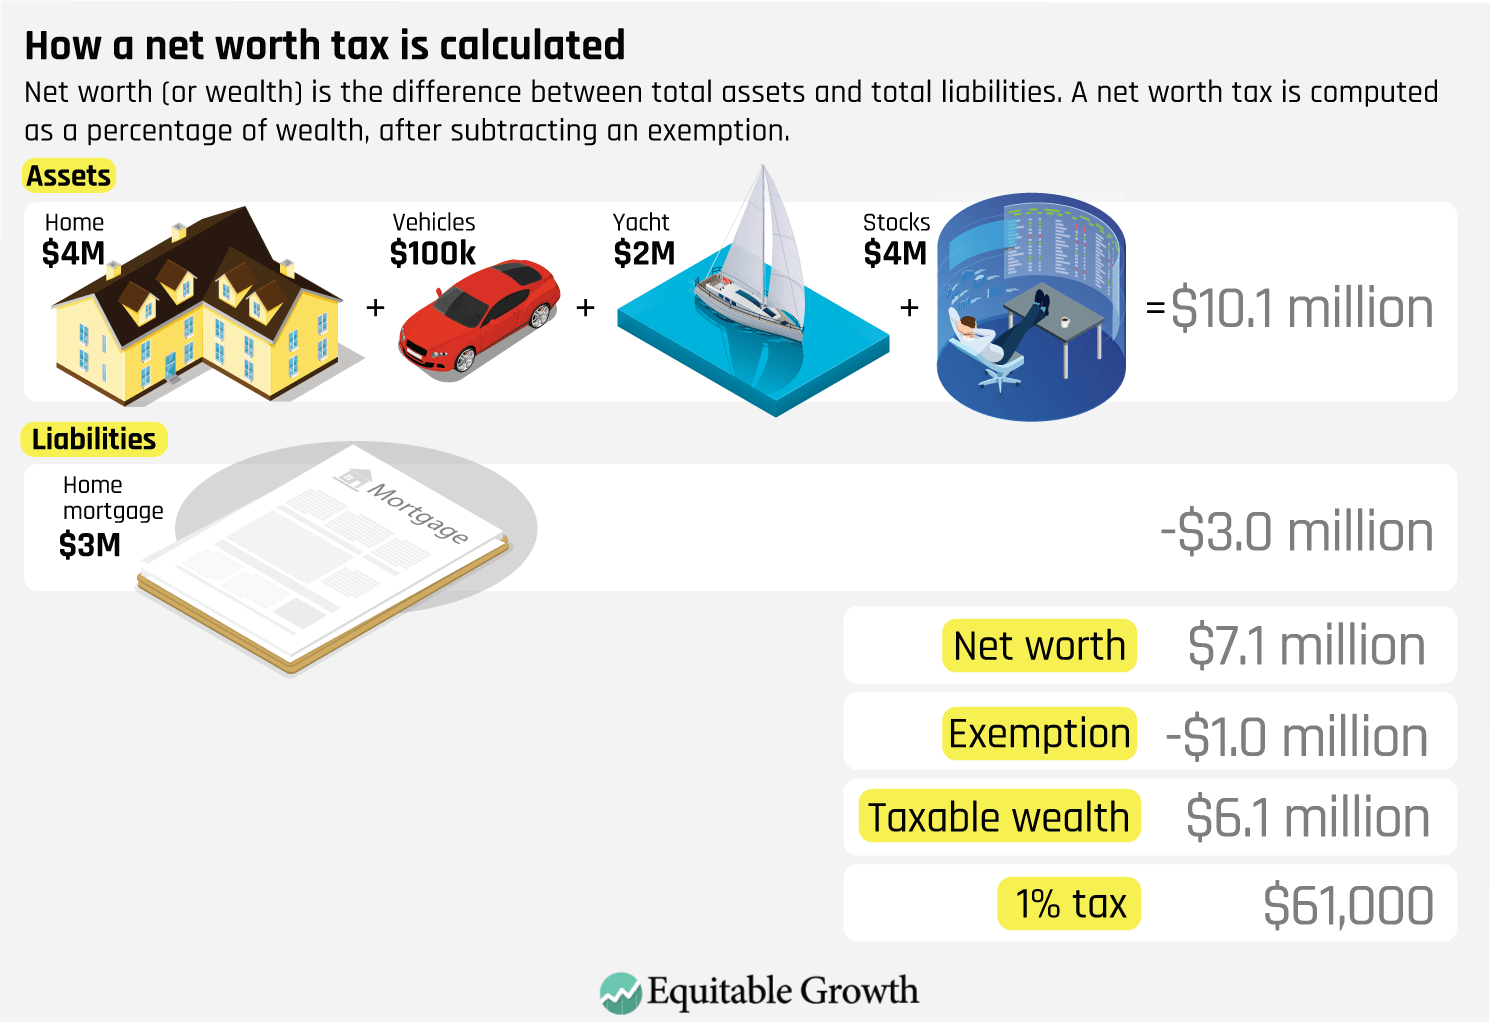
A net worth tax is an annual tax imposed on an individual or family’s wealth, or net worth. Wealth is the difference between the value of a family’s assets and its liabilities. Assets are things a family owns, including both financial assets—such as bank accounts, stocks, bonds, and ownership stakes in closely held businesses—and nonfinancial assets such as housing or real estate. Liabilities are a family’s debts, including mortgages, credit card balances, and car loans.
Like all taxes, net worth taxes vary greatly in their implementation. One of the most important design choices is who is subject to the tax, with the reach of the tax generally limited to the relatively affluent or extremely affluent by means of a generous exemption.3 Other key design issues include the treatment of owner-occupied housing and closely held businesses; the rules regarding pension funds, nonprofits, trusts, and gifts; and the approach taken to valuing assets.
The United States does not have a net worth tax, but both the federal government and state and local governments tax wealth and specific forms of wealth in a variety of ways. Perhaps most notably, the United States relies on property taxes to an extent unusual around the world, primarily at the local level.4 Federal and state governments tax income from wealth in the form of taxes on capital gains, dividends, and business income. In addition, they tax wealth directly in the form of estate taxes.
Policymakers looking for a highly progressive tax instrument that raises substantial revenue would find a net worth tax appealing. A net worth tax could also shore up weaknesses in the current realization-based system of taxing income, in which investment income is taxed only when assets are sold, and it would shift the burden of taxation from those whose income is high relative to their wealth to those whose income is low relative to their wealth. A net worth tax would directly reduce wealth inequality.
This report provides an introduction to net worth taxes.5 It first defines wealth and examines the distribution of income and wealth. It then discusses the relationship between income and wealth for a family and for the country as a whole. Next, it reviews the design of taxes on net worth and explains why the distinction between income and wealth taxes is not clear cut. It concludes with a brief discussion of net worth taxes around the world.
What is wealth?

A family’s wealth is the combined value of all the assets members own less their debts, which are also known as liabilities. Wealth is a measure of the economic resources a family controls at any given time. Since individuals are obligated to pay liabilities they incur, their total debt is subtracted from the aggregate value of their assets to calculate their wealth, or net worth.
Common financial assets include bank accounts, mutual fund assets, and retirement plans such as 401(k) plans. Assets can be nonfinancial, as well as financial. A car, house, or work of art are all assets.6 Common forms of debt include credit card debt, student loans, and home mortgages. Assets and debt may also take on less familiar forms, particularly for high-wealth families. Complex financial products, such as options or other derivatives, and ownership stakes in noncorporate businesses are also assets.
Debts may be tied to a specific asset, as when a mortgage is secured by a house, or may not be, as with credit card debt. In the former case, the difference between the value of an asset and the value of the liabilities secured by that asset is sometimes referred to as equity. Home equity, for example, is the value of a home less mortgages and other debt secured by the home.
Wealth can be measured on an individual, family, or household basis. Many assets or liabilities are owned by a specific person, even as an entire household shares the benefits or costs of that debt. Children benefit from the house they live in, for example, but do not own the house. Some assets come with legal obligations to share the benefits between spouses, such as traditional pensions, while others have few or no strings attached, such as Individual Retirement Accounts.
Definitional choices involved in measuring wealth can be significant in determining the aggregate value of wealth and the distribution of wealth.7 The value of future Social Security and Medicare benefits, if viewed as assets, would account for a substantial share of the wealth of middle-class families. Similarly, the value of government debt, if treated as a liability of the public, would be the single largest type of debt (exceeding mortgage debt). Traditional measures of household wealth exclude these types of assets and liabilities.
Wealth is measured at a point in time and reflects the value of assets less liabilities at that time. In contrast, income is measured over a period of time. A family’s wealth would be measured at the end of the year, for example, while a family’s income would be measured over the course of the year.
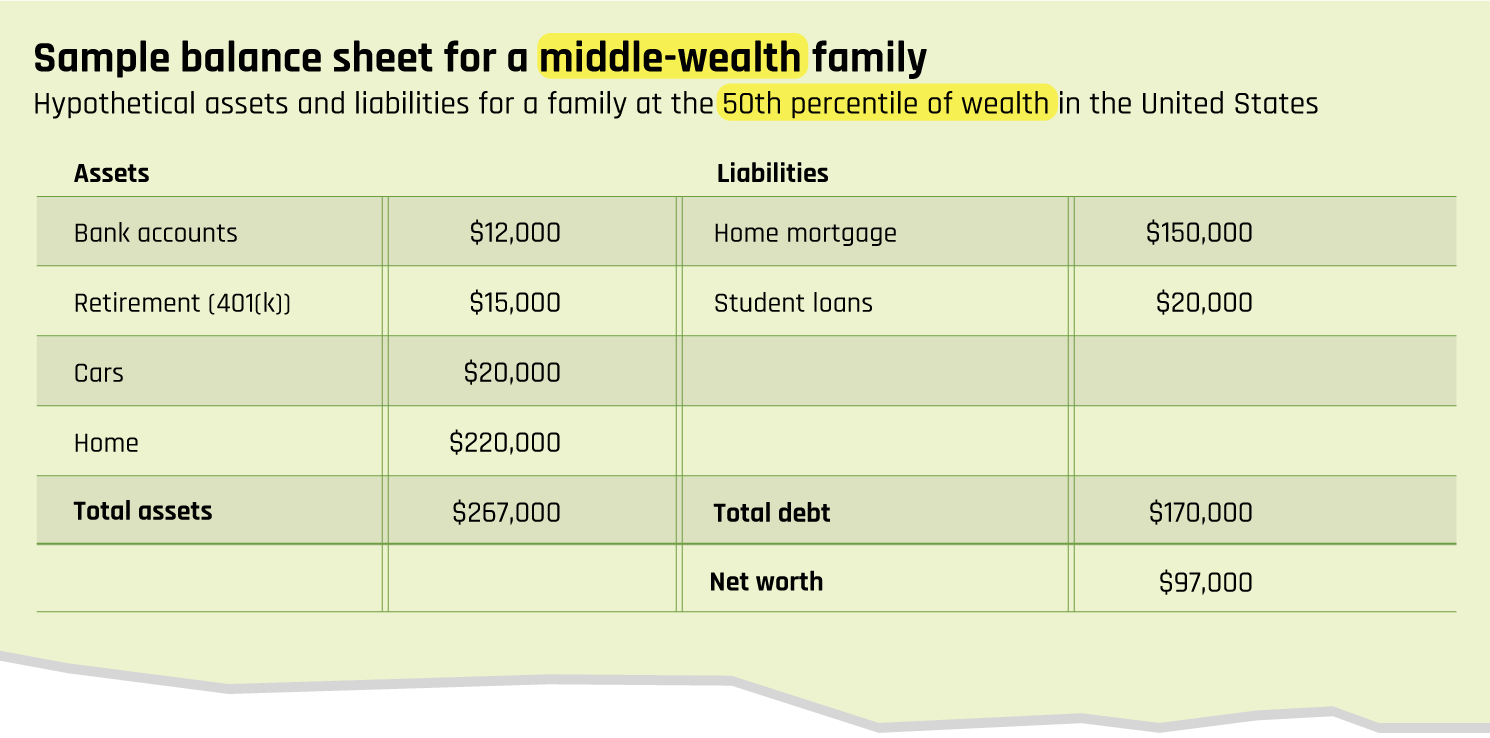
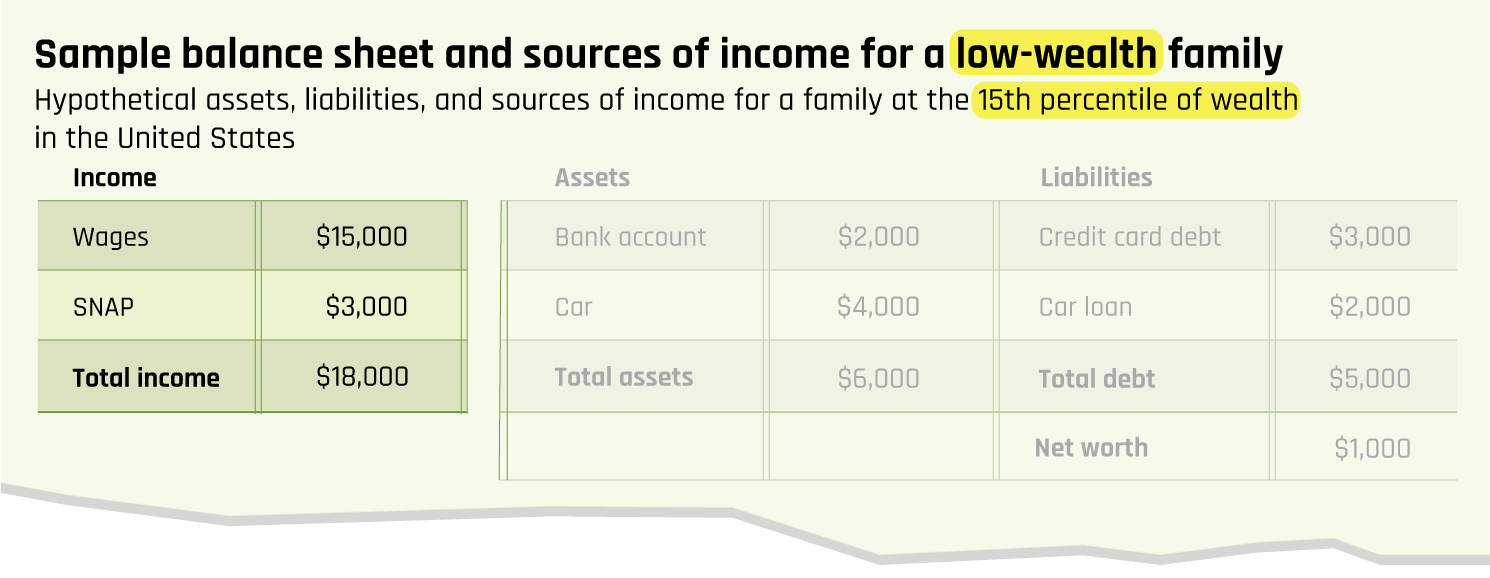
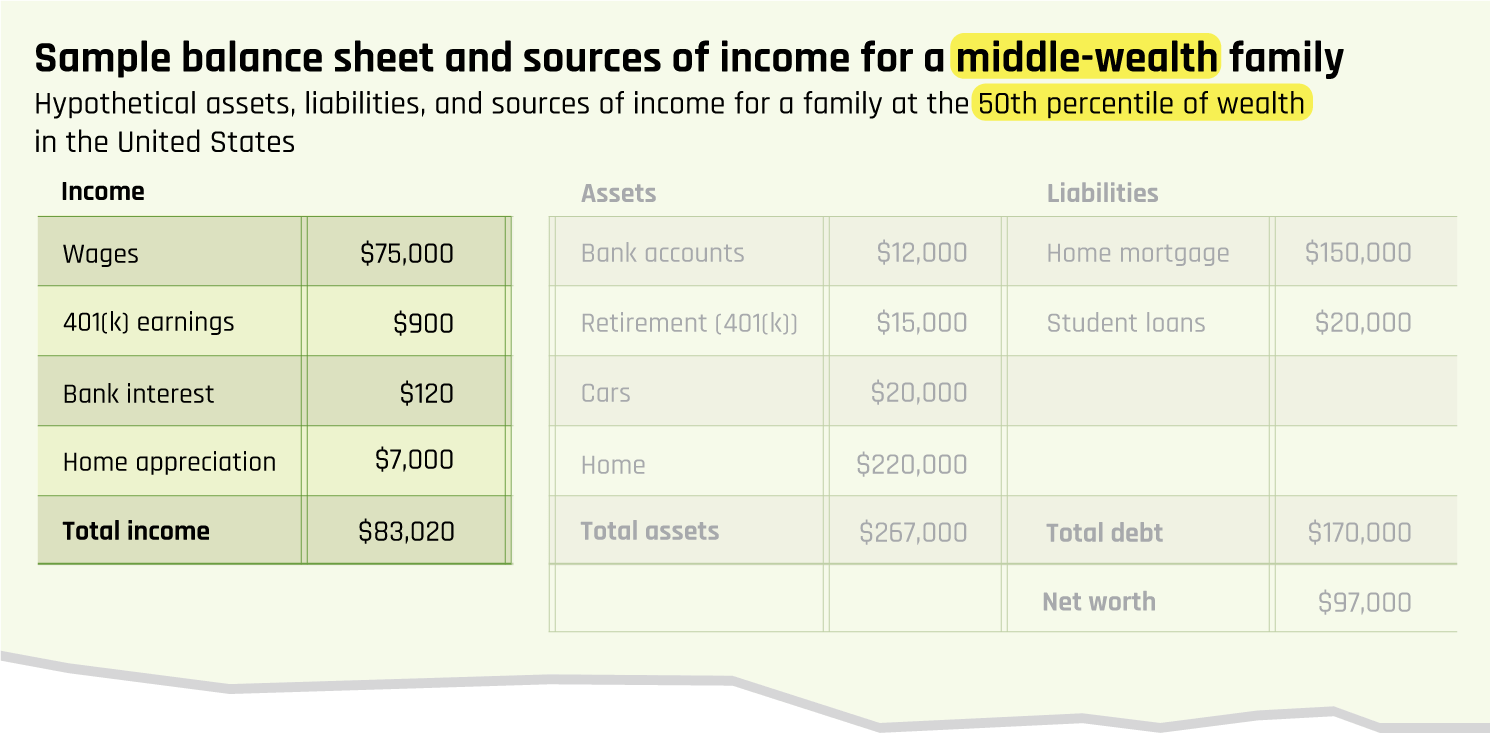
A family’s wealth can be summarized by a balance sheet. A balance sheet provides a description of the assets a family owns and the liabilities a family owes. A low-wealth family, for example, might have only a few assets and some debt.8 (See Table 1.) In this example, the family owns a bank account and a car, together valued at $6,000, and owes $3,000 in credit card debt and $2,000 on a car loan, for a net worth of $1,000. A middle-wealth family would typically have more substantial assets, such as a bank account, a 401(k), a house, and two cars, and more debt, primarily a home mortgage. (See Table 2.) The value of assets exceeds the value of liabilities by a larger amount, and thus the family has greater wealth.
Table 1
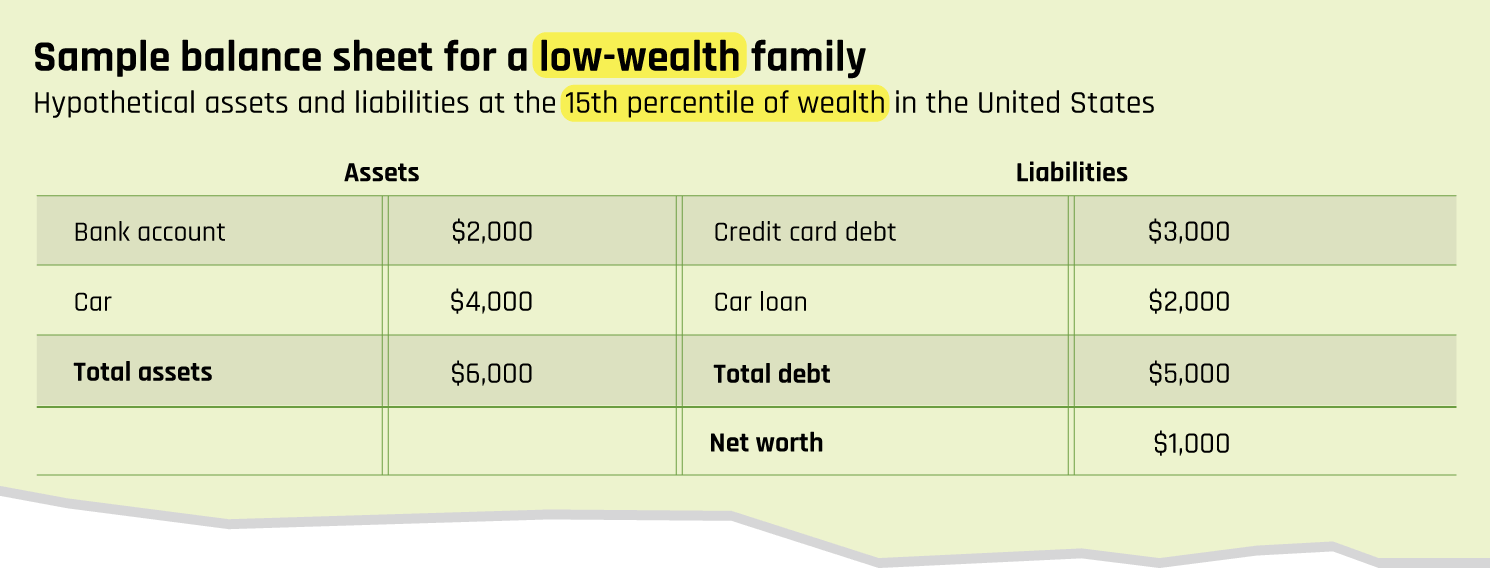
Table 2
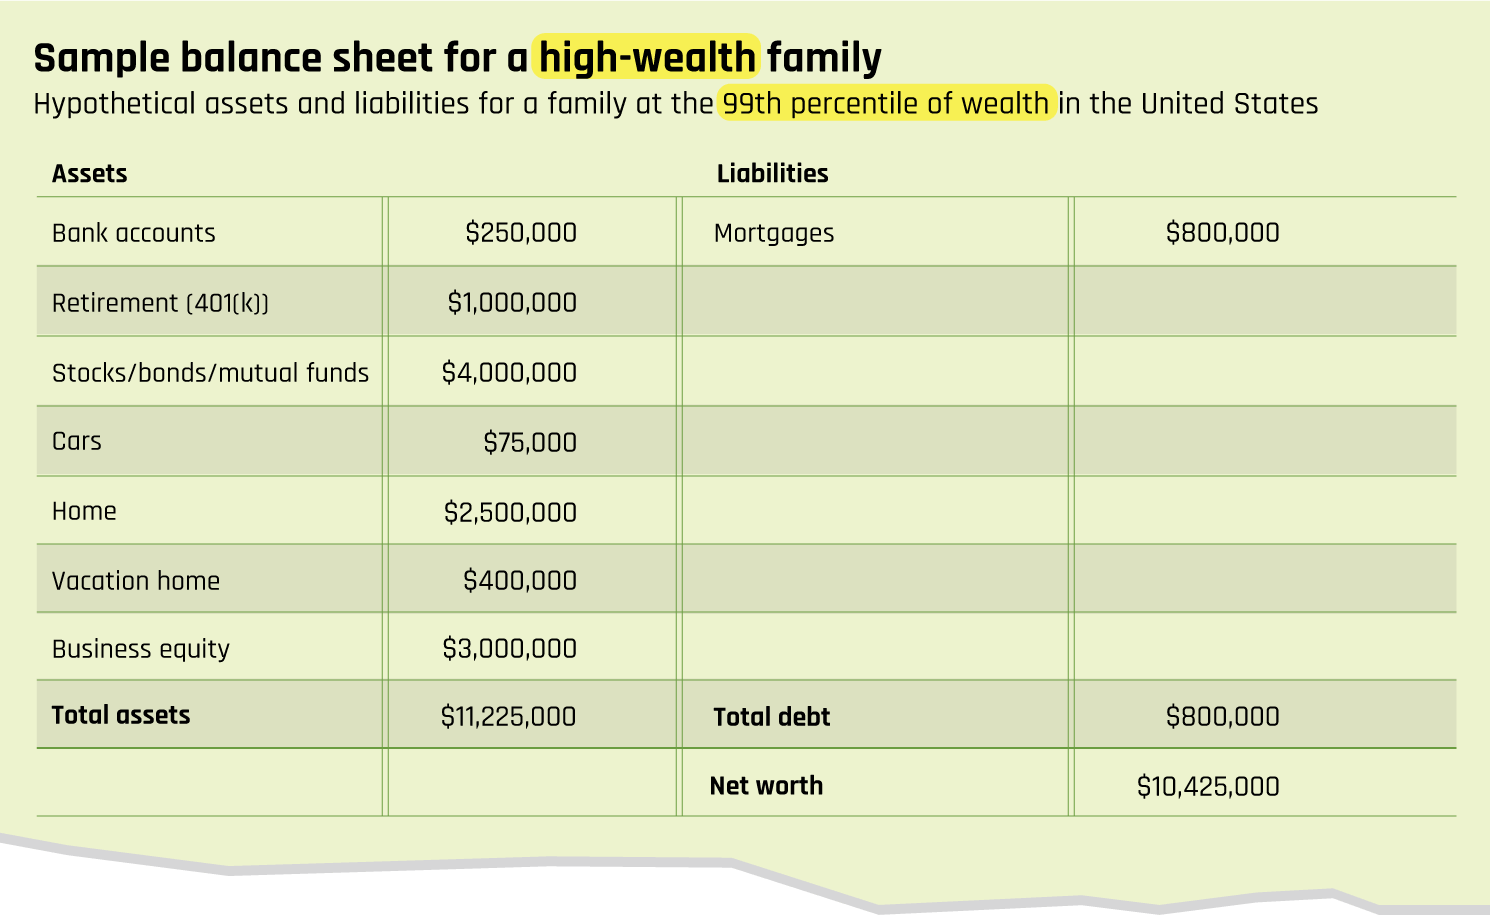
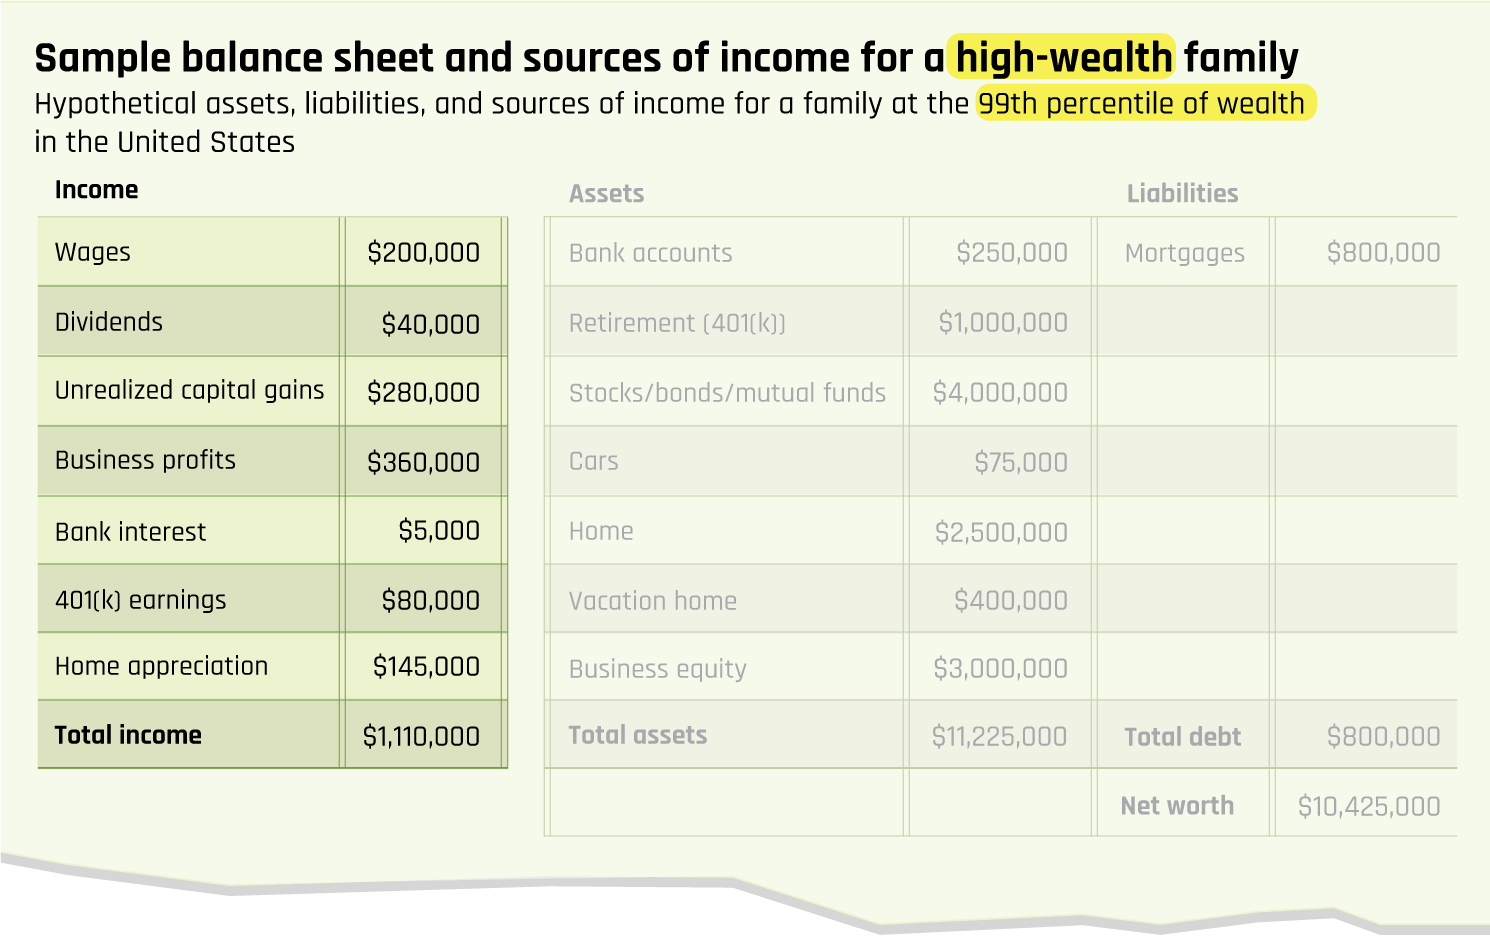
In contrast, a very high-wealth family is likely to have a much more complex financial situation. This family will have some of the same types of assets as the middle-wealth family, including bank accounts, a 401(k), and a house. But it is also likely to have some assets less common in the middle class, such as a vacation home and equity in a closely held business. (See Table 3.) Much as the middle-wealth family had more debt than the low-wealth family, the high-wealth family is likely to have even more debt than the middle-wealth family. Nonetheless, the much higher level of assets means that—even with more debt—the family’s wealth is much higher.
Table 3
The balance sheets above illustrate the computation of wealth for three different hypothetical families. The Federal Reserve’s Survey of Consumer Finances—a survey that collects information on U.S. families’ assets, liabilities, and income—provides a nonhypothetical picture of the wealth of the American public. This survey is conducted every 3 years, with the most recent data available collected in 2016.9
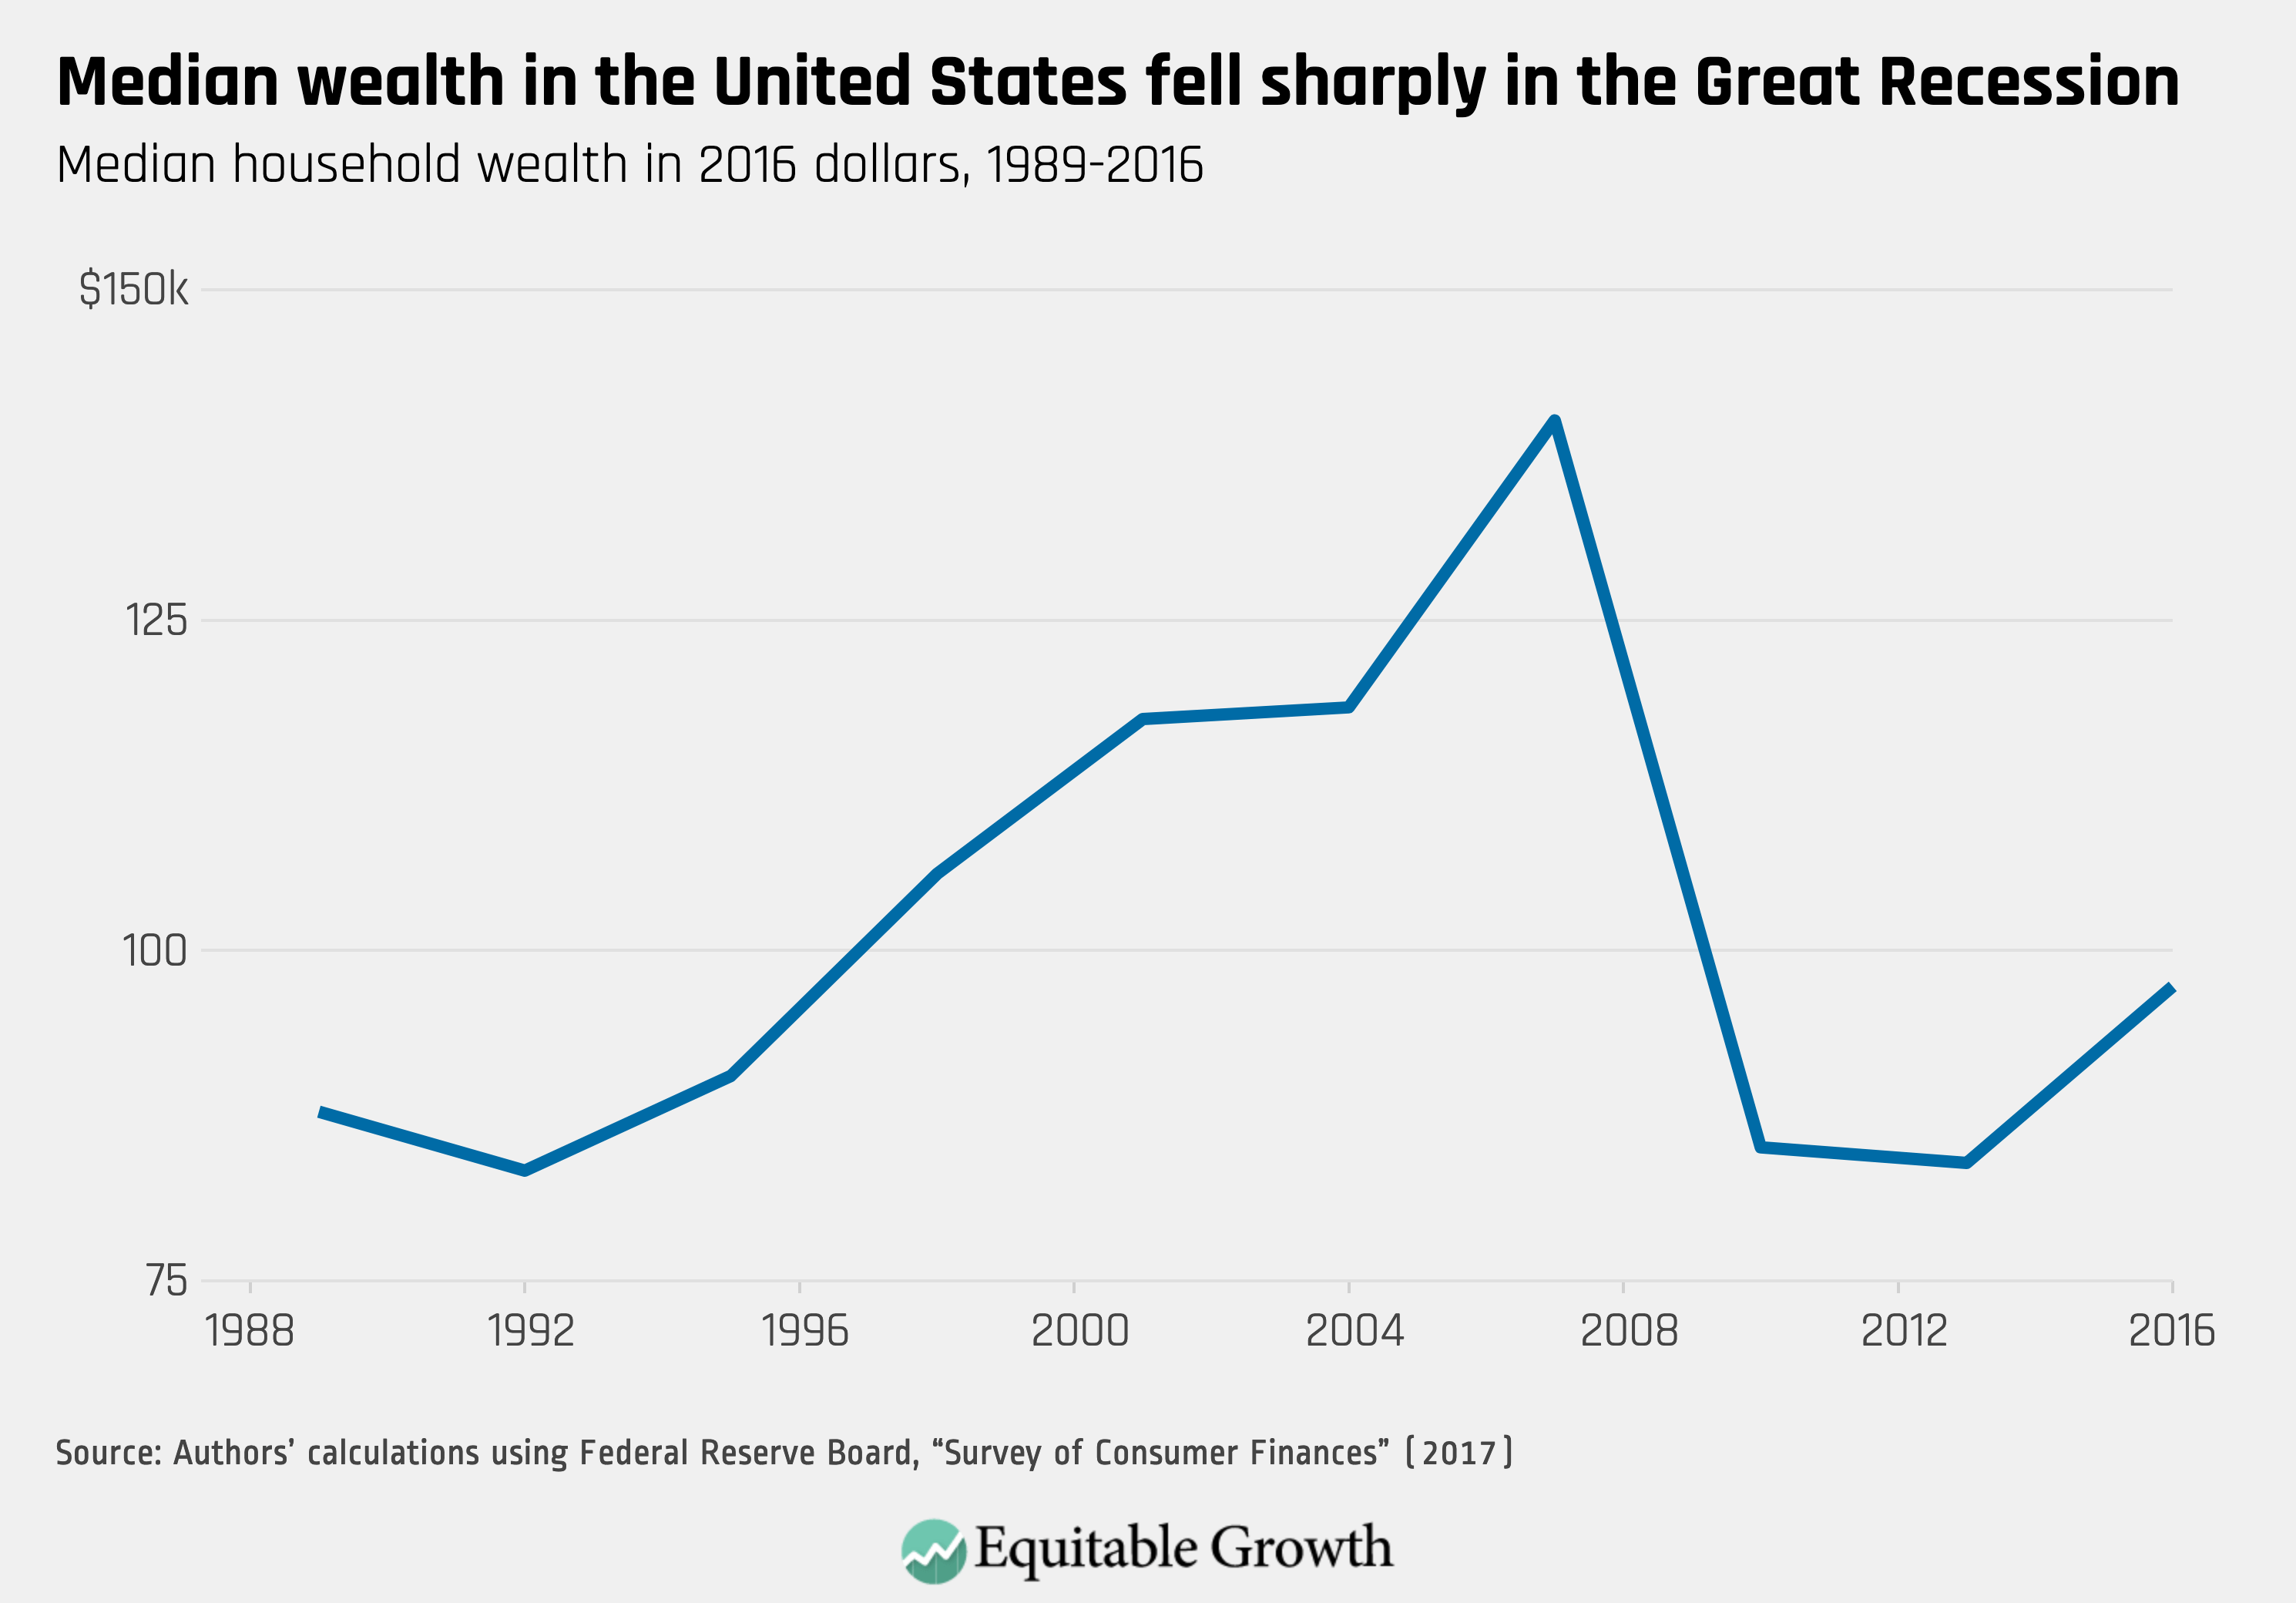
Median U.S. household wealth in 2016 was $97,000.10 Median household wealth increased from 1992 to 2007, but it fell sharply during the Great Recession of 2007–2009 and had not yet recovered to its pre-recession level as of 2016. (See Figure 2.)
Figure 2
Wealth is distributed in a highly unequal fashion, with the wealthiest 1 percent of families holding about 40 percent of all wealth, and the bottom 90 percent of families holding less than one-quarter of all wealth. (See Figure 3.) Notably, 25 percent of families have less than $10,000 in wealth. These disparities have widened over time—the current 23 percent share of total wealth held by the bottom 90 percent is down from 33 percent in 1989.
Figure 3
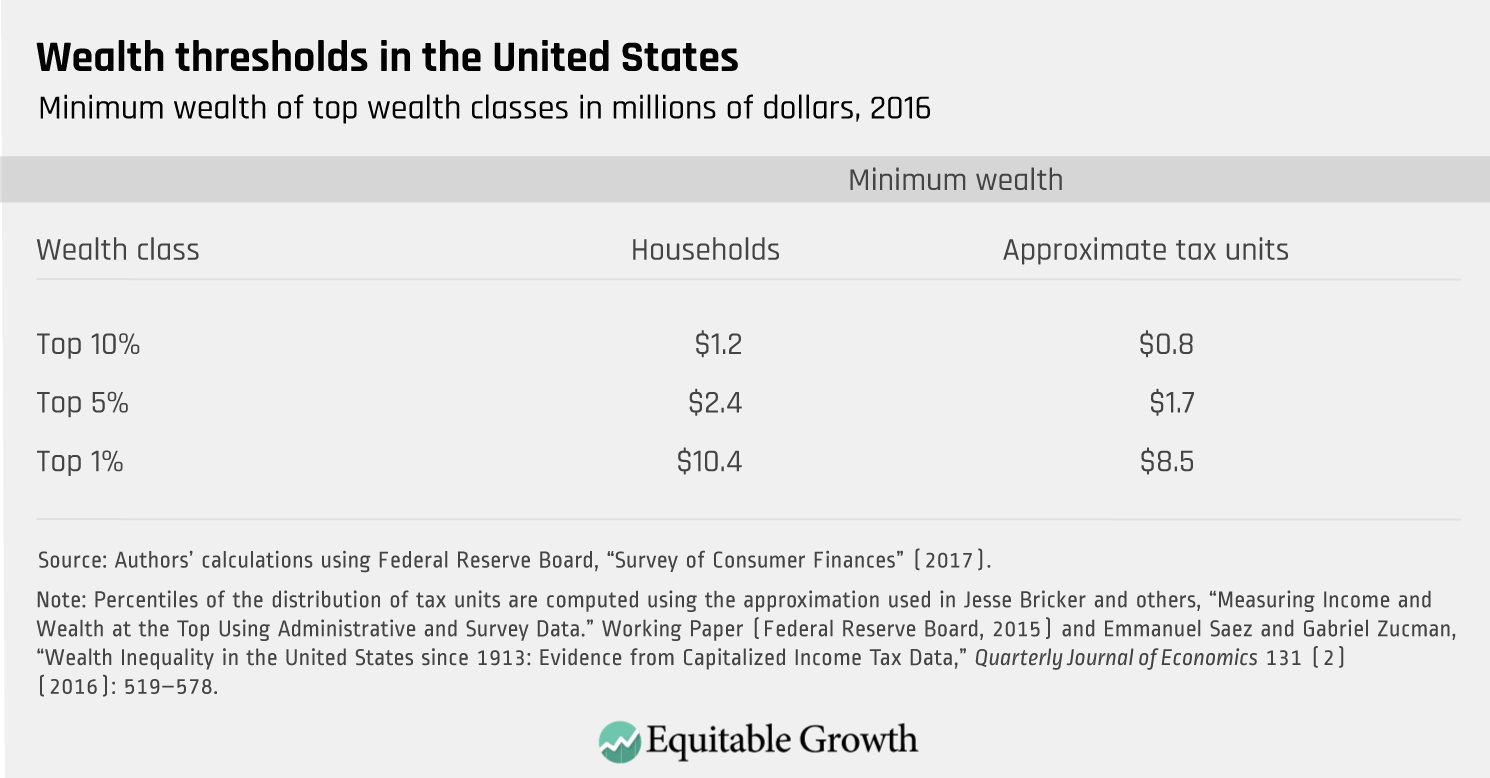
The high level of wealth inequality in the United States also is reflected in the substantial difference between median wealth ($97,000) and mean wealth ($690,000). As a result, 84 percent of families have wealth below the mean. The 90th percentile of the wealth distribution is $1.2 million. The 99th percentile of the wealth distribution is $10.4 million.
Top wealth shares measured using tax units (the people appearing on the same tax return) exceed those measured using households, as there are low- or moderate-wealth tax units that are part of higher-wealth households. As a result, the percentiles of the wealth distribution by tax units near the top are smaller than the percentiles of the wealth distribution by households. The 95th percentile of wealth among tax units is $1.7 million, and the 99th percentile of wealth among tax units is $8.5 million. (See Table 4.)
Table 4
The highly skewed distribution of wealth is one of the primary reasons the burden of a net worth tax would be highly progressive: The wealth tax payments would be made overwhelmingly by the wealthiest families.11
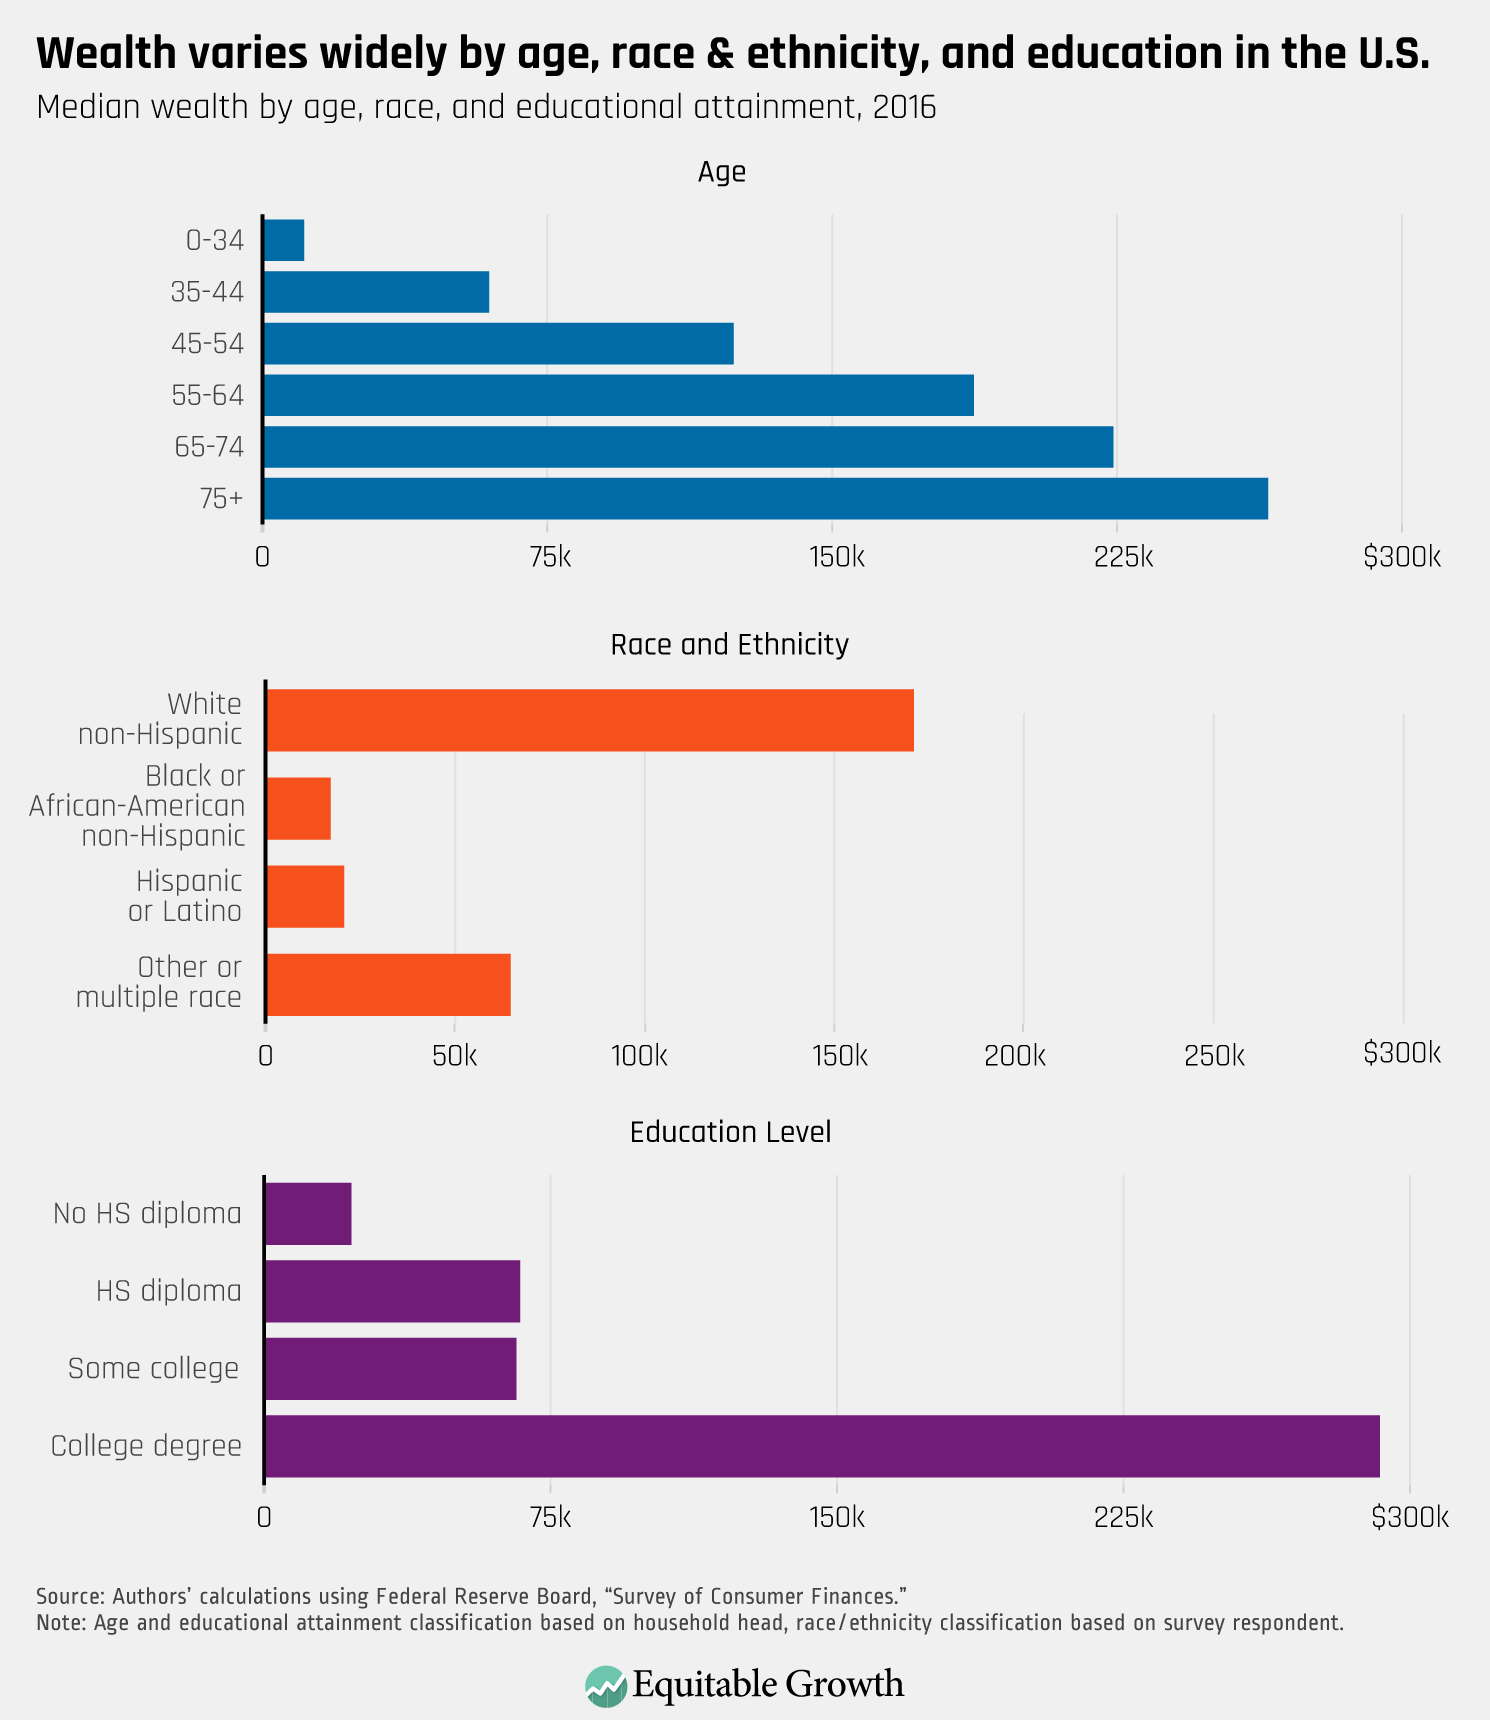
In addition to the disparities within the distribution of wealth, there are also large disparities in wealth across other dimensions. The median net worth of households for which the survey respondent is black or African American and not Hispanic or Latino is $17,200, while the median net worth of households for which the survey respondent is white and not Hispanic or Latino is $171,000. Households in which the head has a 4-year college degree have a median net worth of $292,100, while households in which the head has completed some college or has an associate’s degree have a median net worth of $66,000. (See Figure 4.)
Figure 4
As noted above, higher-wealth households have both more assets and more liabilities. Mean assets for families in the lowest wealth quintile are $29,000 and mean liabilities are $46,000. For families in the middle quintile, mean assets are $184,000 and mean liabilities $83,000. And for families in the top quintile, mean assets are $3.2 million and mean liabilities $203,000. While the amount of debt generally increases with wealth, the ratio of debts to assets falls sharply.
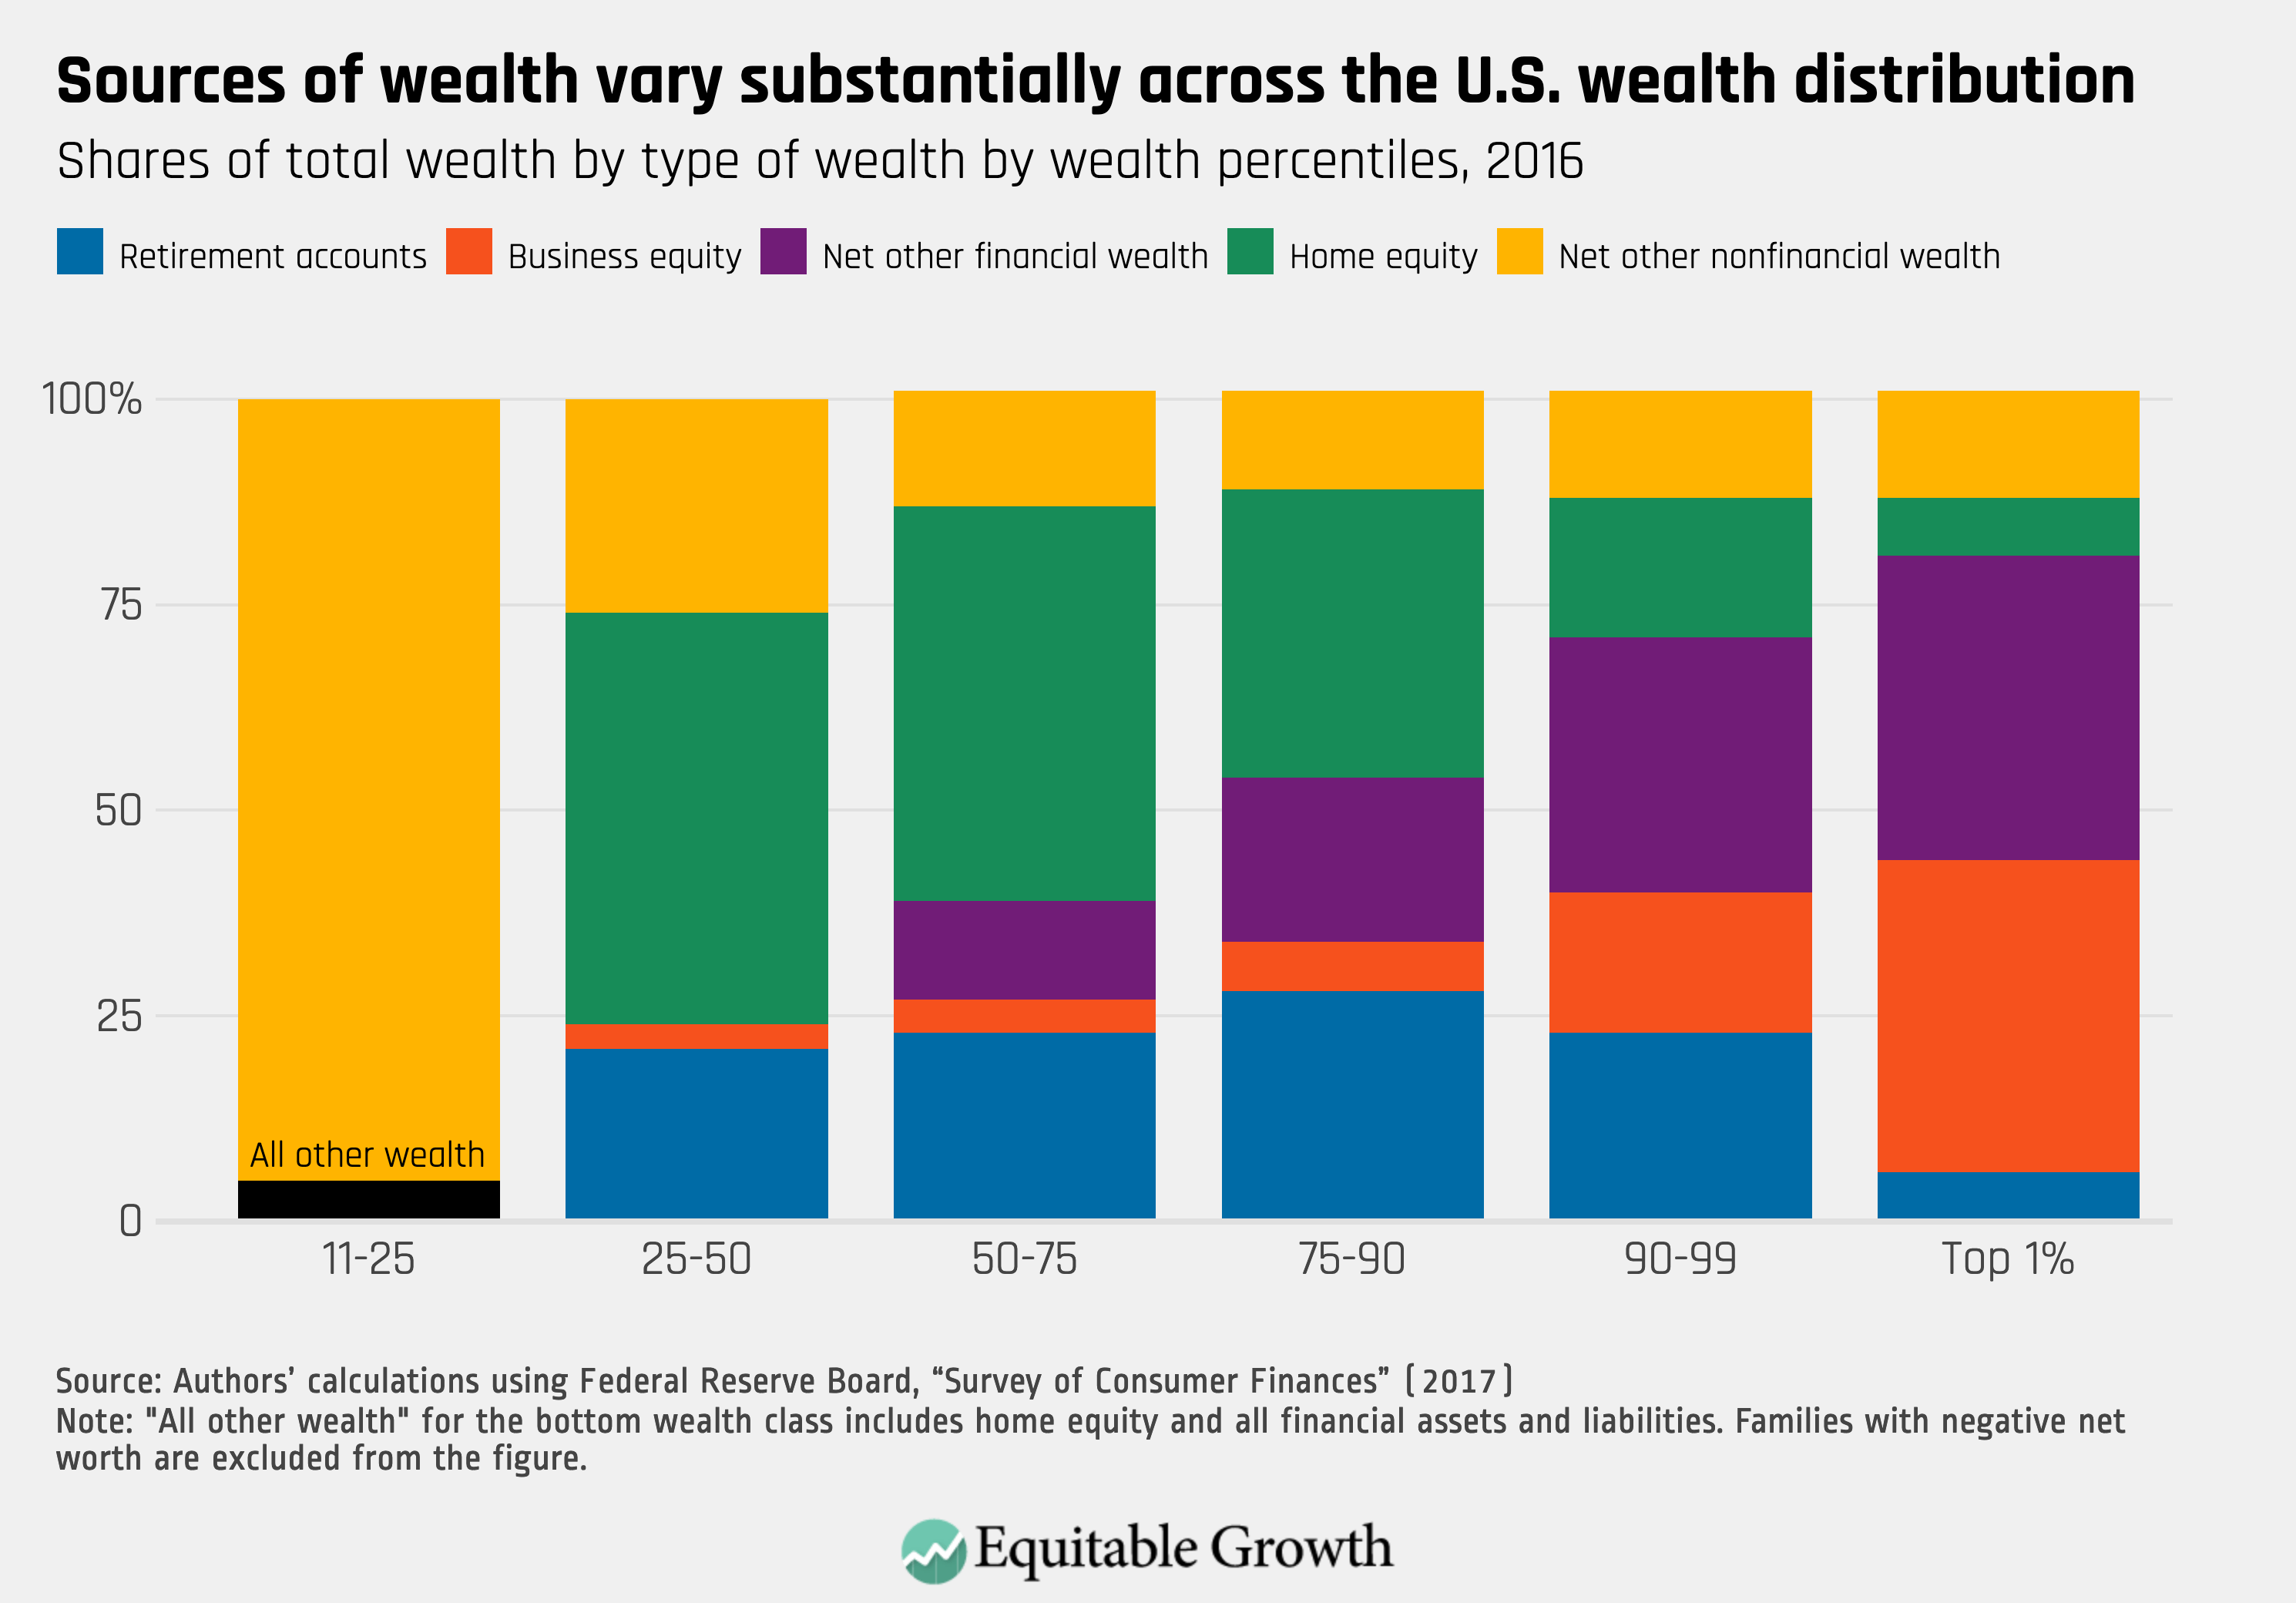
Low-wealth and high-wealth families also differ in terms of the assets and liabilities they hold. Cars and other vehicles account for most of the net wealth of low-wealth families. Middle-wealth families hold much more of their wealth in home equity, with more modest contributions from retirement accounts, bank accounts, and cars. Very high-wealth families hold much more of their wealth in business equity and financial assets outside retirement accounts. (See Figure 5.)
Figure 5
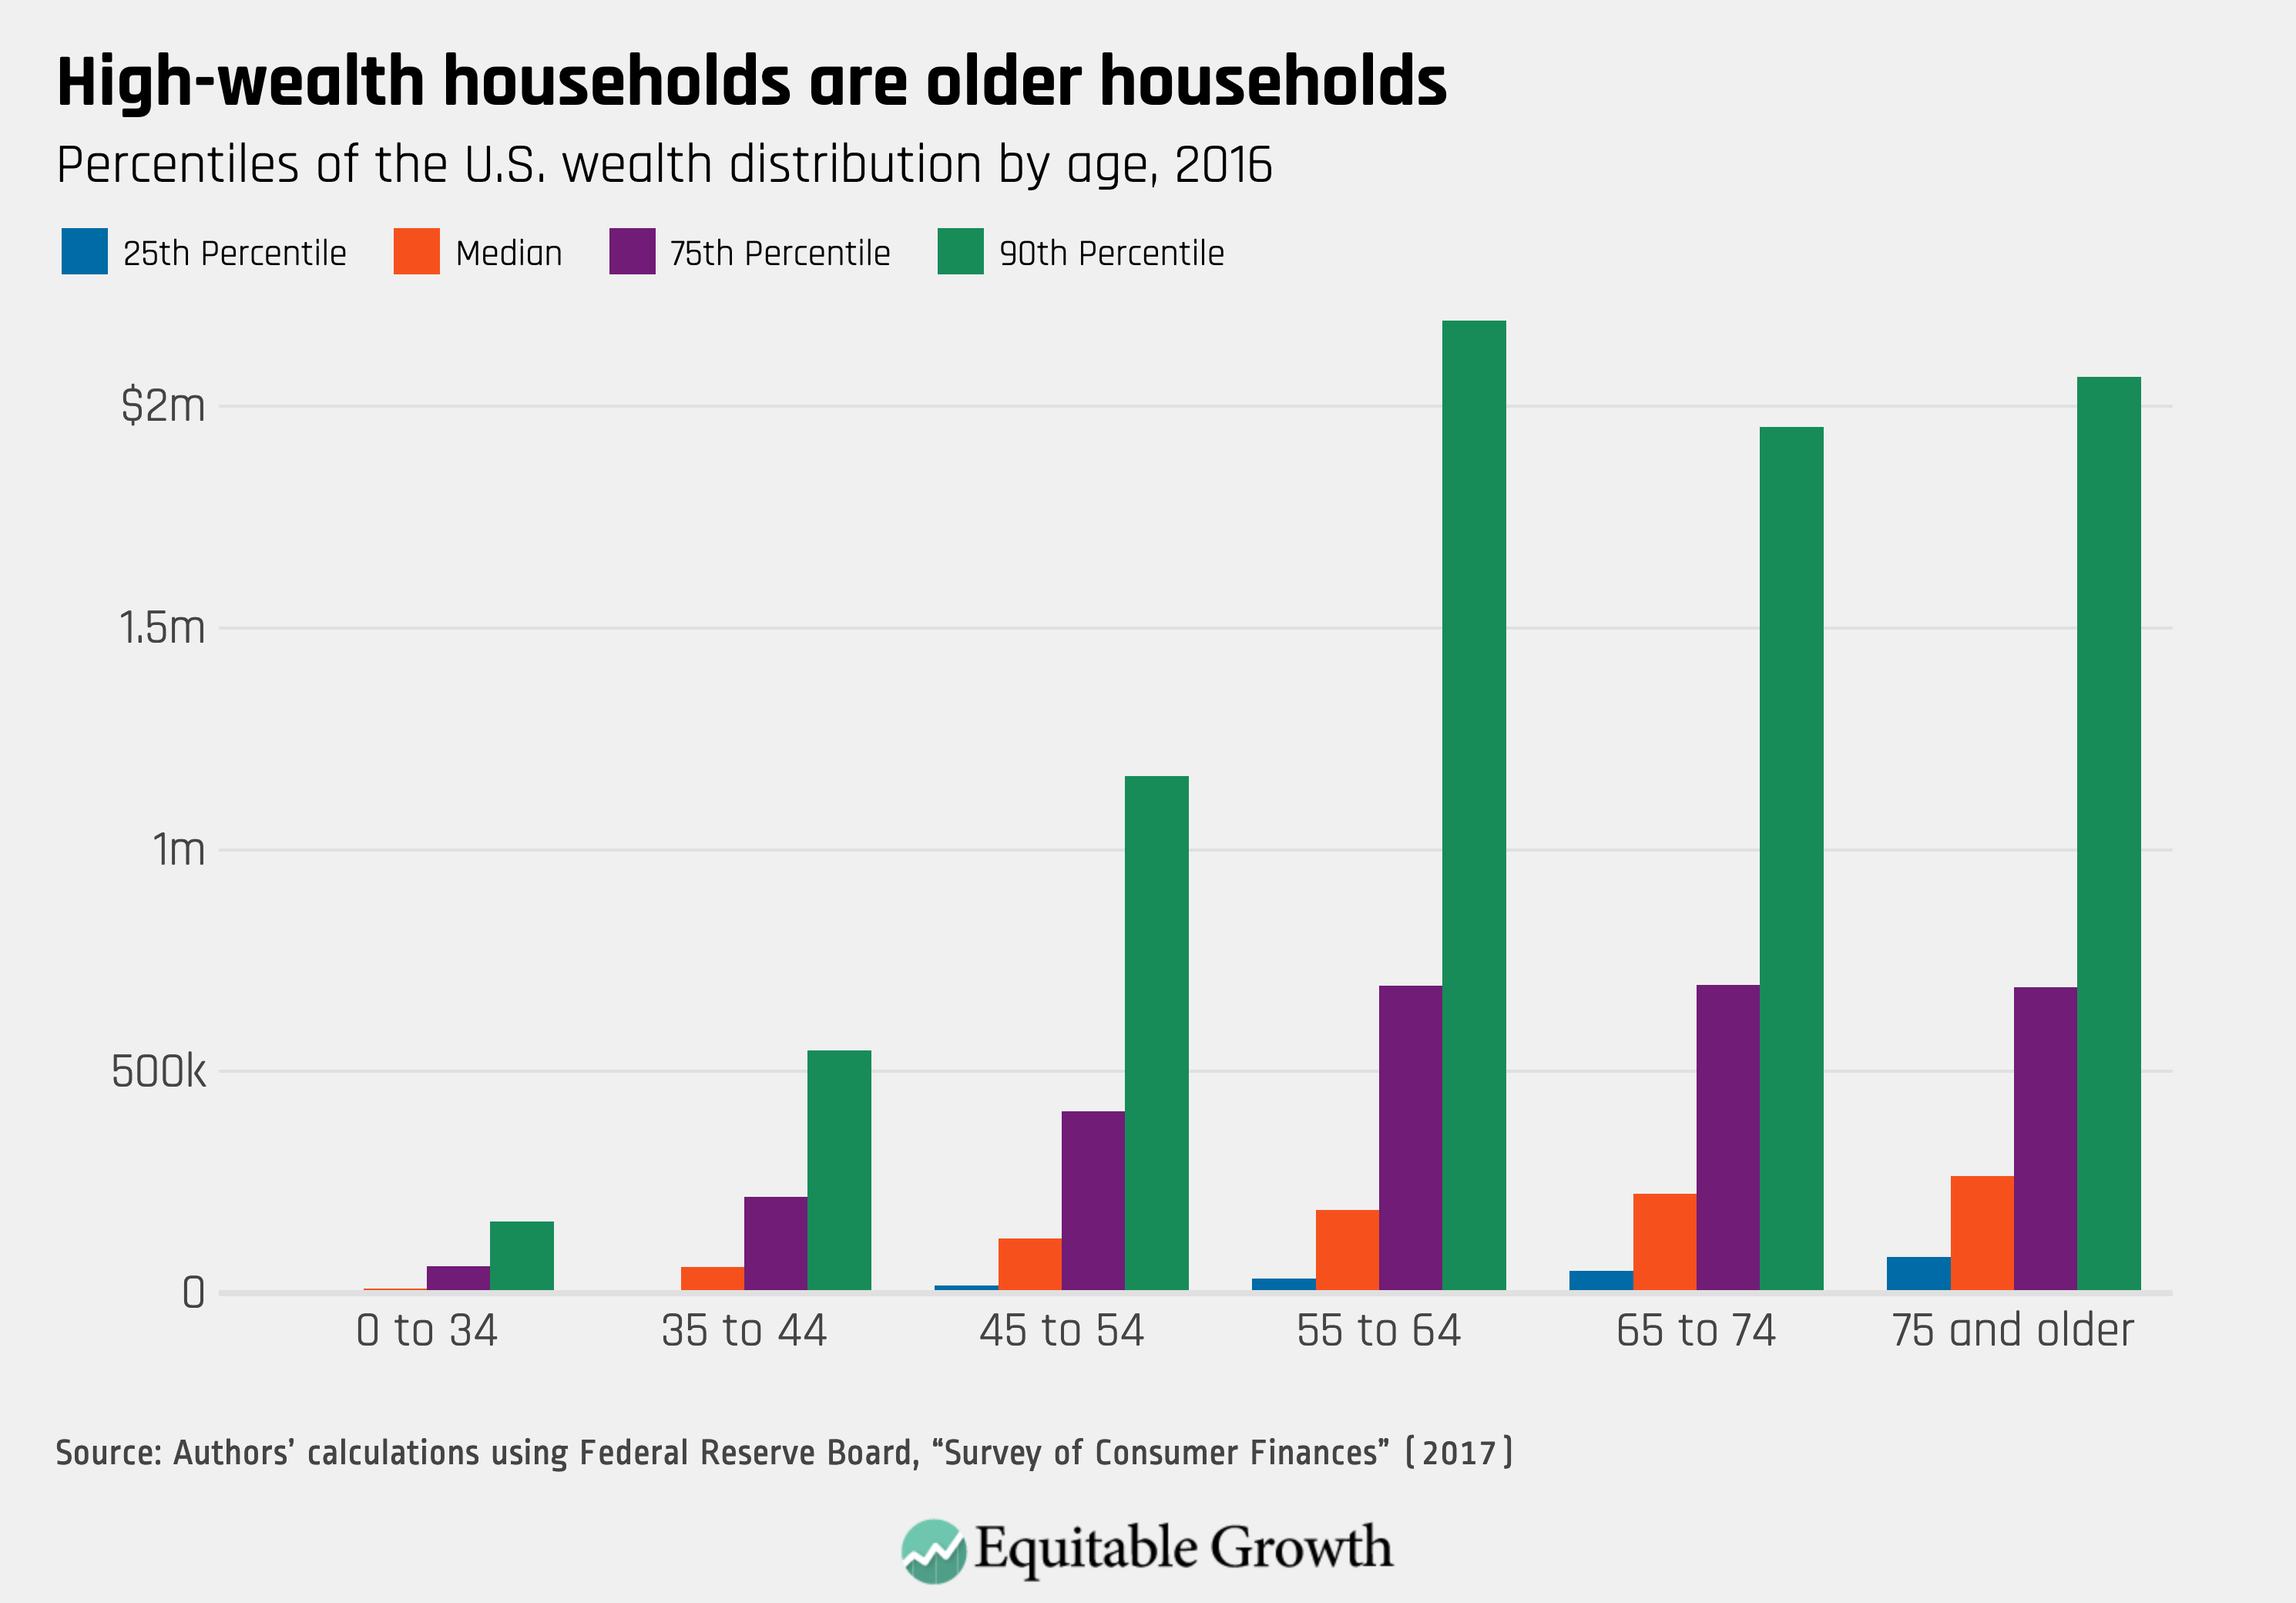
As noted above, wealth also varies substantially by age. Young households start out with little wealth and tend to accumulate wealth over time. High-wealth families tend to be older households, and low-wealth families tend to be younger households. Of course, while this is true on average, there are high- and low-wealth households at all ages, and even at and after traditional retirement ages—when mean and median wealth tend to be highest—13 percent of families have less than $10,000 in wealth. (See Figure 6.)
Figure 6
The relationship between income and wealth
Wealth is the value of the economic claims a family holds at a point in time. In contrast, income is the flow of resources a family gains control over during a certain period of time. Wealth and income are distinct quantities, but there are important relationships between the two.
Wealth generates a flow of income, but this income may be implicit or explicit. Bank accounts may pay interest and stocks may pay dividends, both of which are examples of explicit returns. In addition, houses, stocks, or works of art may increase in value, also delivering an explicit return—even when the return exists only on paper. Owner-occupied housing offers an implicit return in the form of implicit rent payments. Because owners are effectively renting their houses to themselves, there is no explicit payment, but the value of housing services is central in the decision to buy the house.
A useful definition of income, known as the Haig-Simons definition, is that income is consumption plus the change in wealth. If a family spent nothing, income would be the change in wealth. This definition of income is quite broad. It includes wages and fringe benefits, benefits from public programs such as Social Security and Medicare, gifts and inheritances, the increase in the value of assets, and the implicit rent provided by owner-occupied housing. Income can be measured on a pretax basis or an after-tax basis. Different approaches to measuring incomes capture different information about the economic circumstances and experiences of U.S. families.
Notably, while this broad definition of income is useful for thinking about the economic status of families and for relation to the broad measures of wealth discussed in the previous section, the definition of income used for tax purposes is much narrower. Certain forms of income are excluded such as health insurance received by an employee; there are deductions for certain forms of spending such as mortgage interest, state and local taxes, and charitable contributions; and investment income is measured only when assets are sold, not as they change in value.
A family’s balance sheet can be augmented with a summary of its sources of income to illustrate the relationship between the two. A low-wealth family might piece together income from work and public programs. Importantly, the assets of this low-wealth family likely do not generate any explicit income flows. In this example, the bank account pays no interest and the car—though it provides a stream of useful services and may be an essential ingredient in getting to work and earning wages—does not deliver a direct financial payoff. (See Table 5.)
Table 5
In contrast, a middle-wealth family may have higher income from wages but likely also some income from wealth. In this example, wages are the primary source of income, but home appreciation and investment earnings inside the retirement account also contribute to income. (See Table 6.)
Table 6
Finally, a high-income and high-wealth family may have complex sources of income from their assets in addition to wage income. In this example, the family has dividends and unrealized capital gains from their investment assets, profits from their ownership stake in a noncorporate business, earnings inside their retirement account, and appreciation on their home and vacation home. (See Table 7.) An unrealized capital gain is an increase in the value of an asset that exists on paper, but that the owner has not yet realized by selling the asset. A capital gain is realized only when the owner sells the asset. Comparing the wealth of the high-wealth family to the low-wealth family highlights not only that the wealth of the high-wealth family is much higher, but also that it generates explicit income that can contribute to future wealth.
Table 7
These examples illustrate the relationship between income and assets for hypothetical families. As above, we rely on the Survey of Consumer Finances to summarize income for the population. We use the Survey of Consumer Finances for consistency with the wealth estimates of the prior section, given the close relationship between income and wealth, even though this survey is not generally used for measuring income inequality in isolation.12
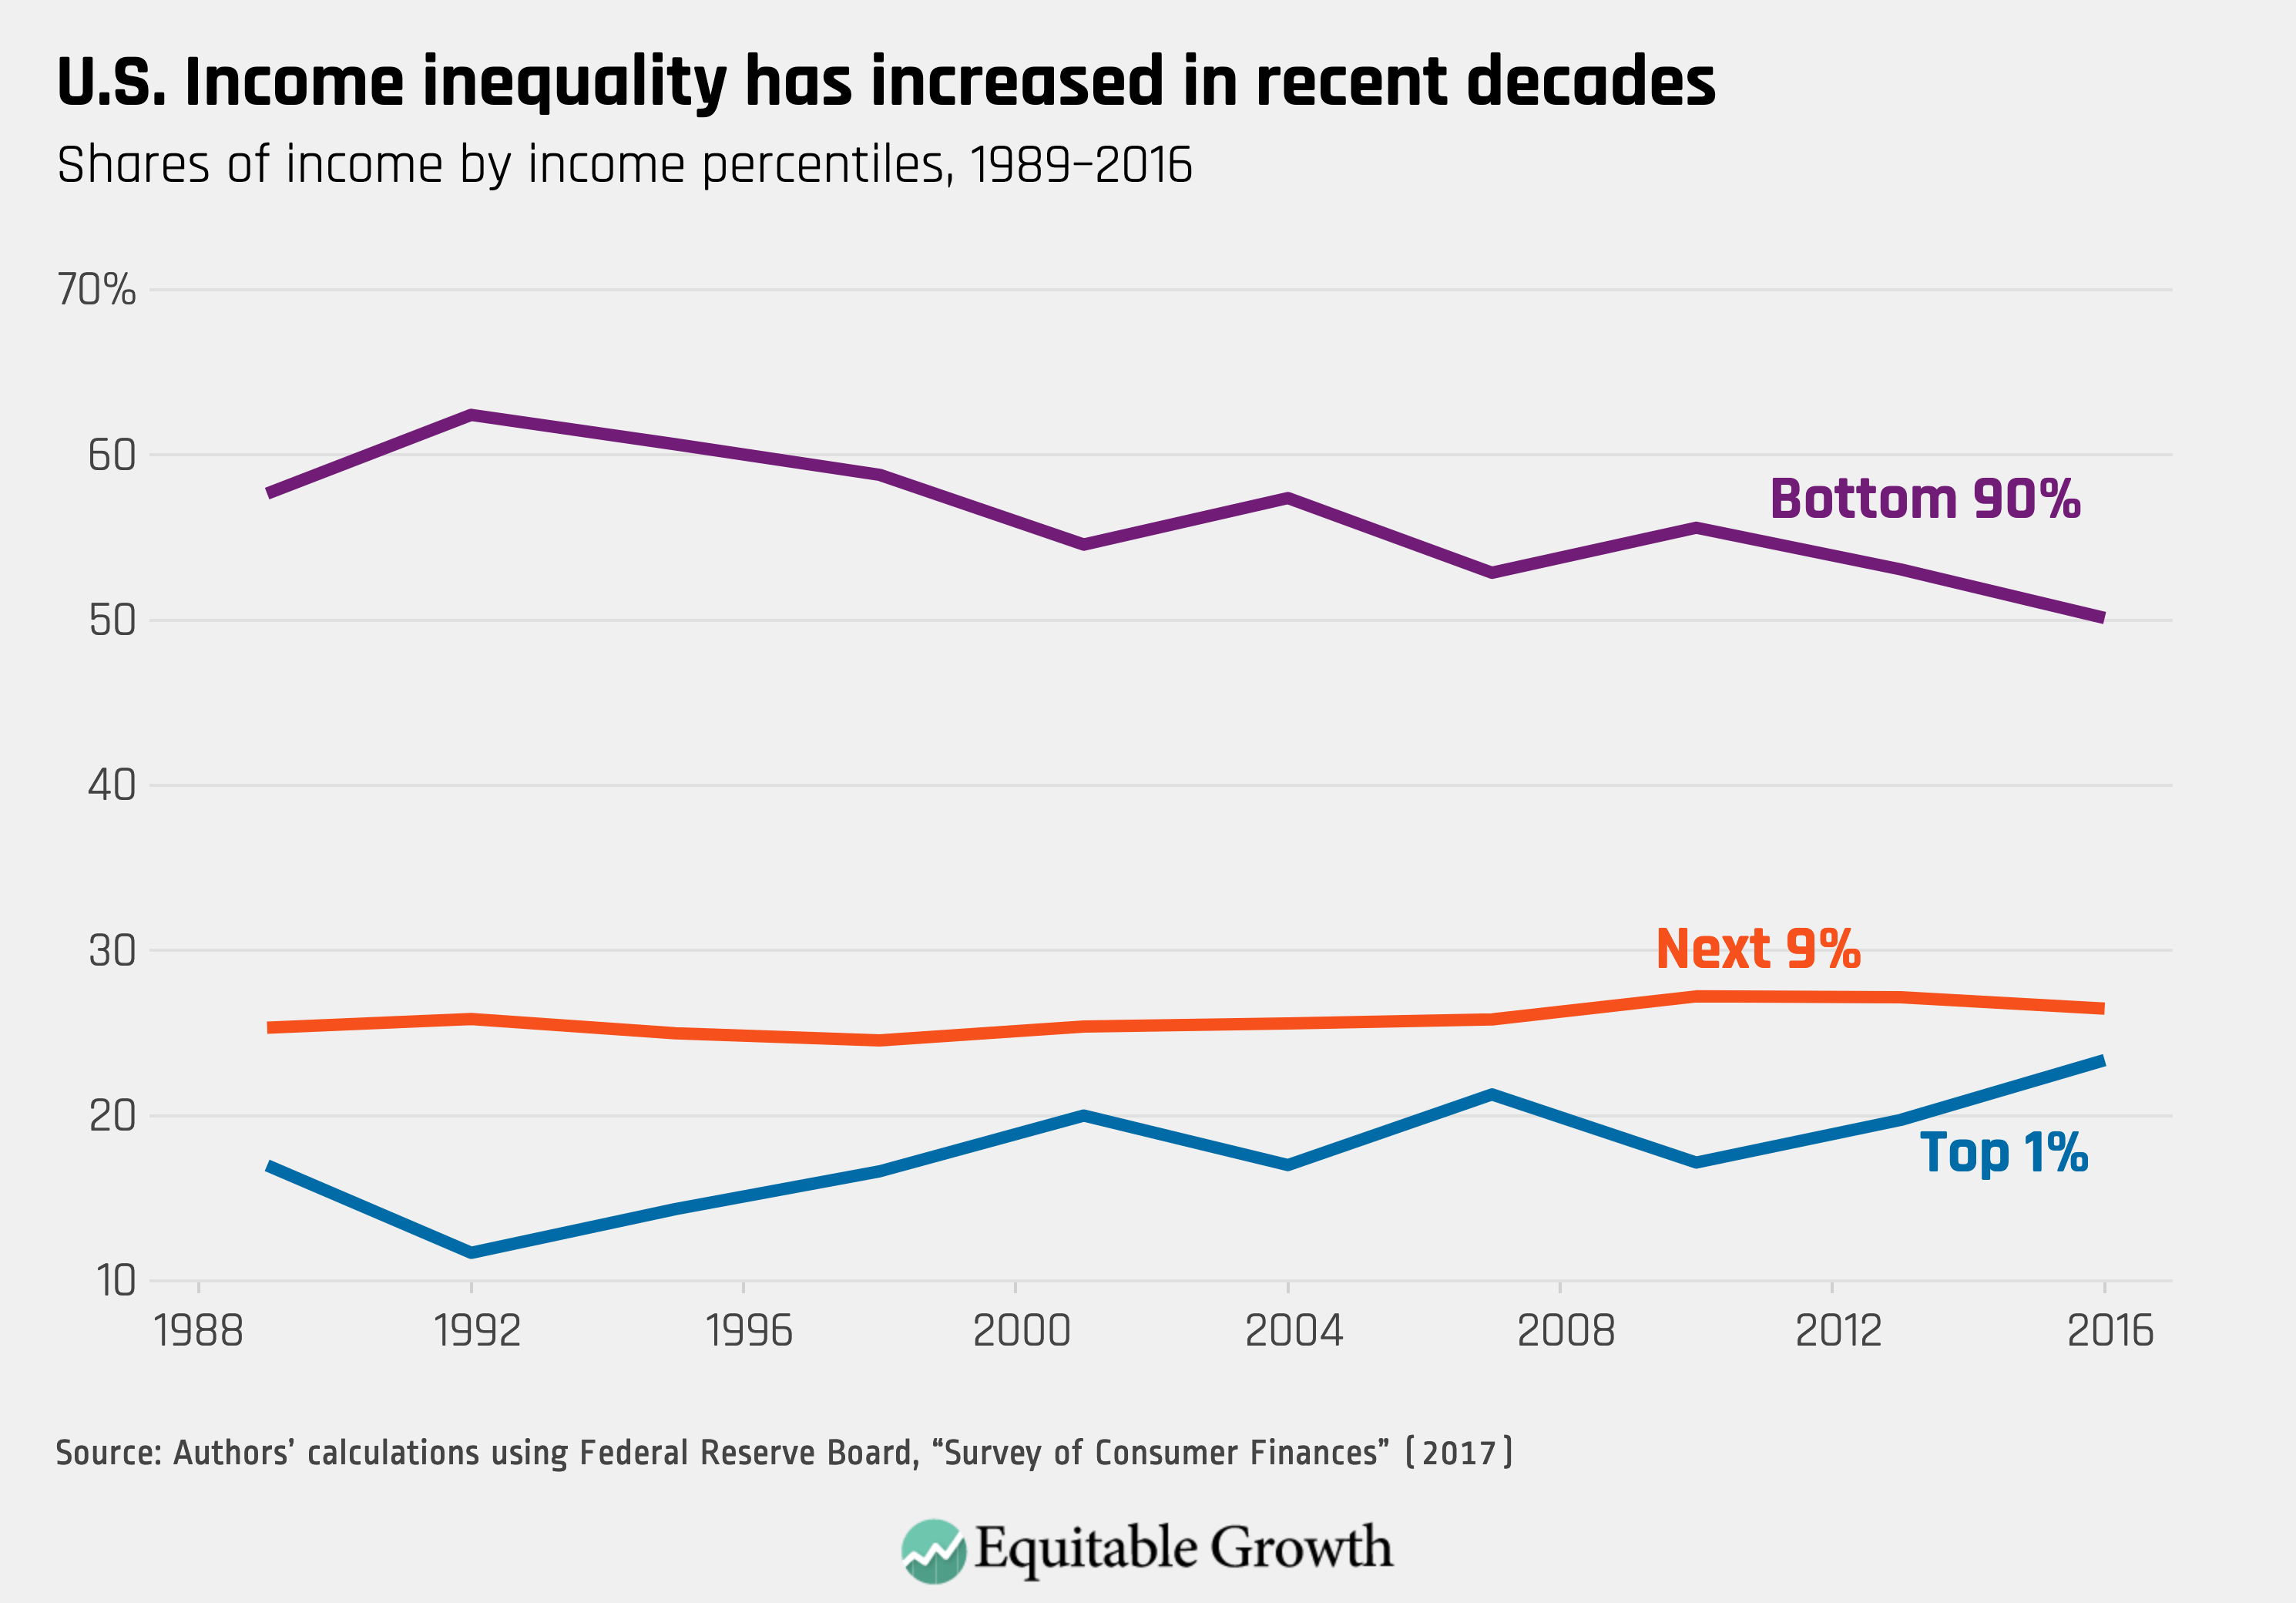
Income in the United States is distributed in a highly unequal fashion, and income inequality has been increasing over time. The top 1 percent accounts for 23 percent of income on a pretax basis, and the bottom 90 percent receives 50 percent. (See Figure 7.)
Figure 7
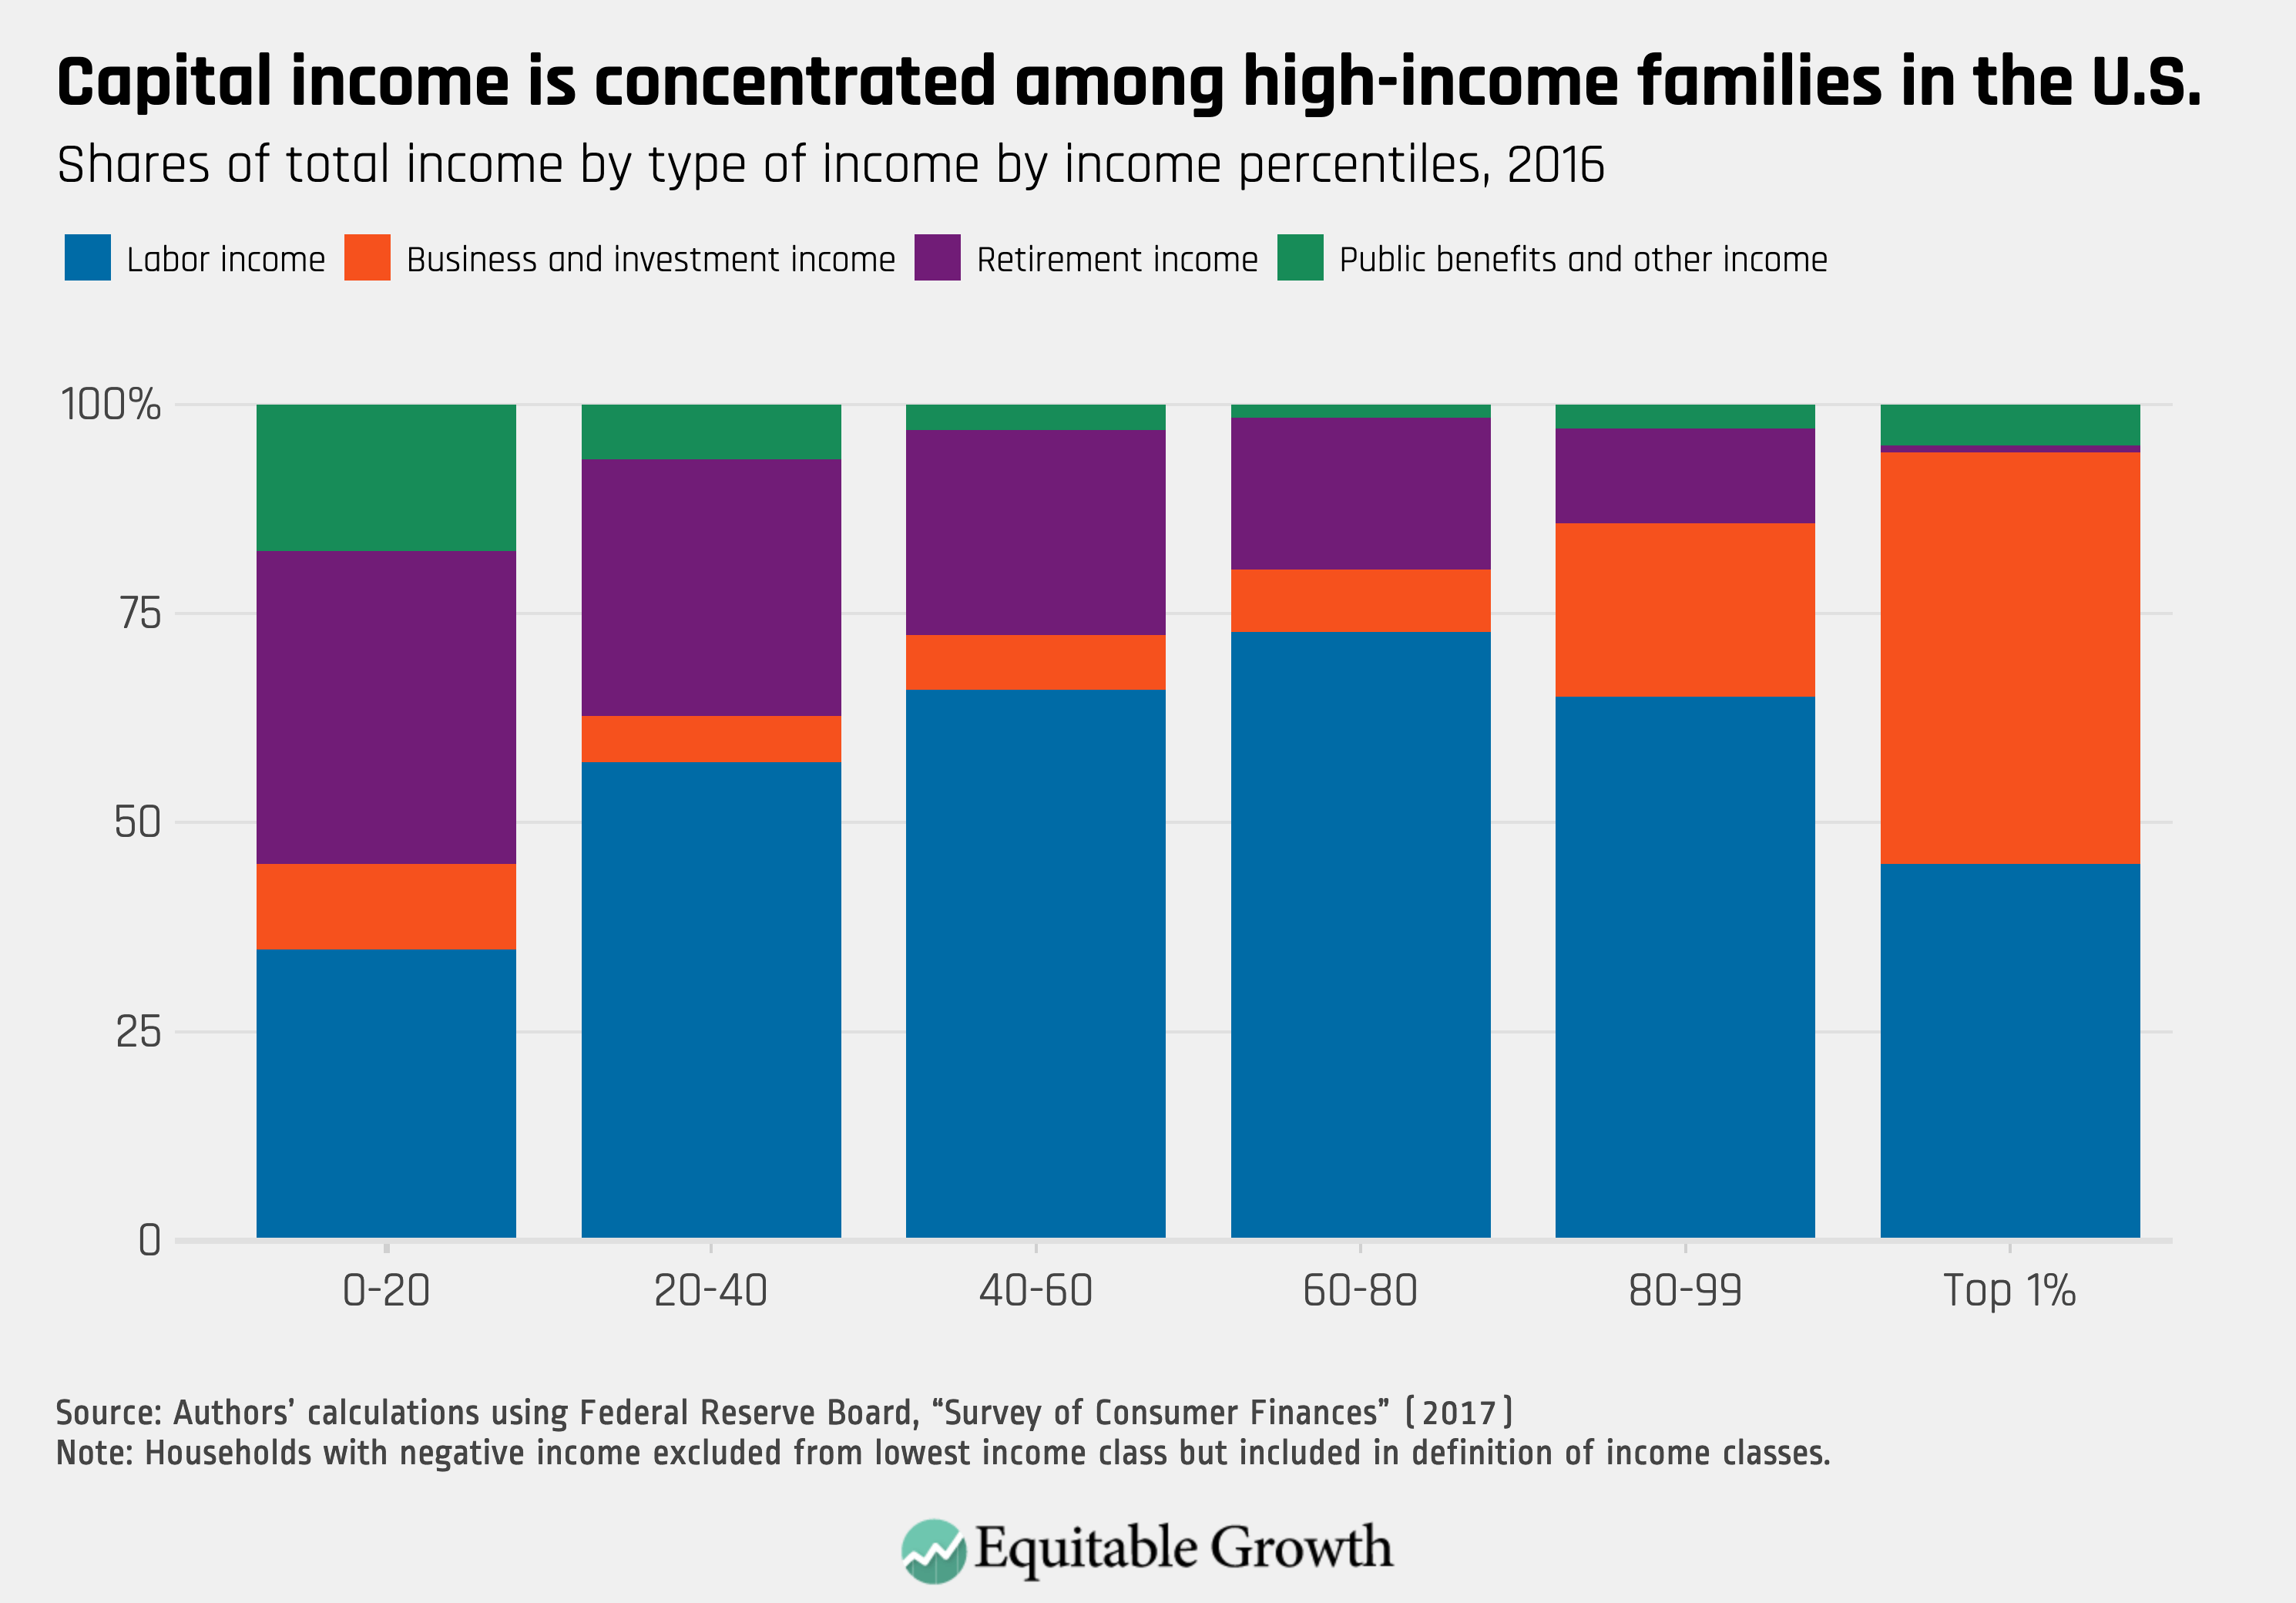
As with wealth, the sources of income vary across the income distribution. High-income families derive a much larger share of income from business and investment; middle-income families rely more heavily on labor income; and low-income families rely more heavily on public benefits and retirement income. (See Figure 8.)
Figure 8
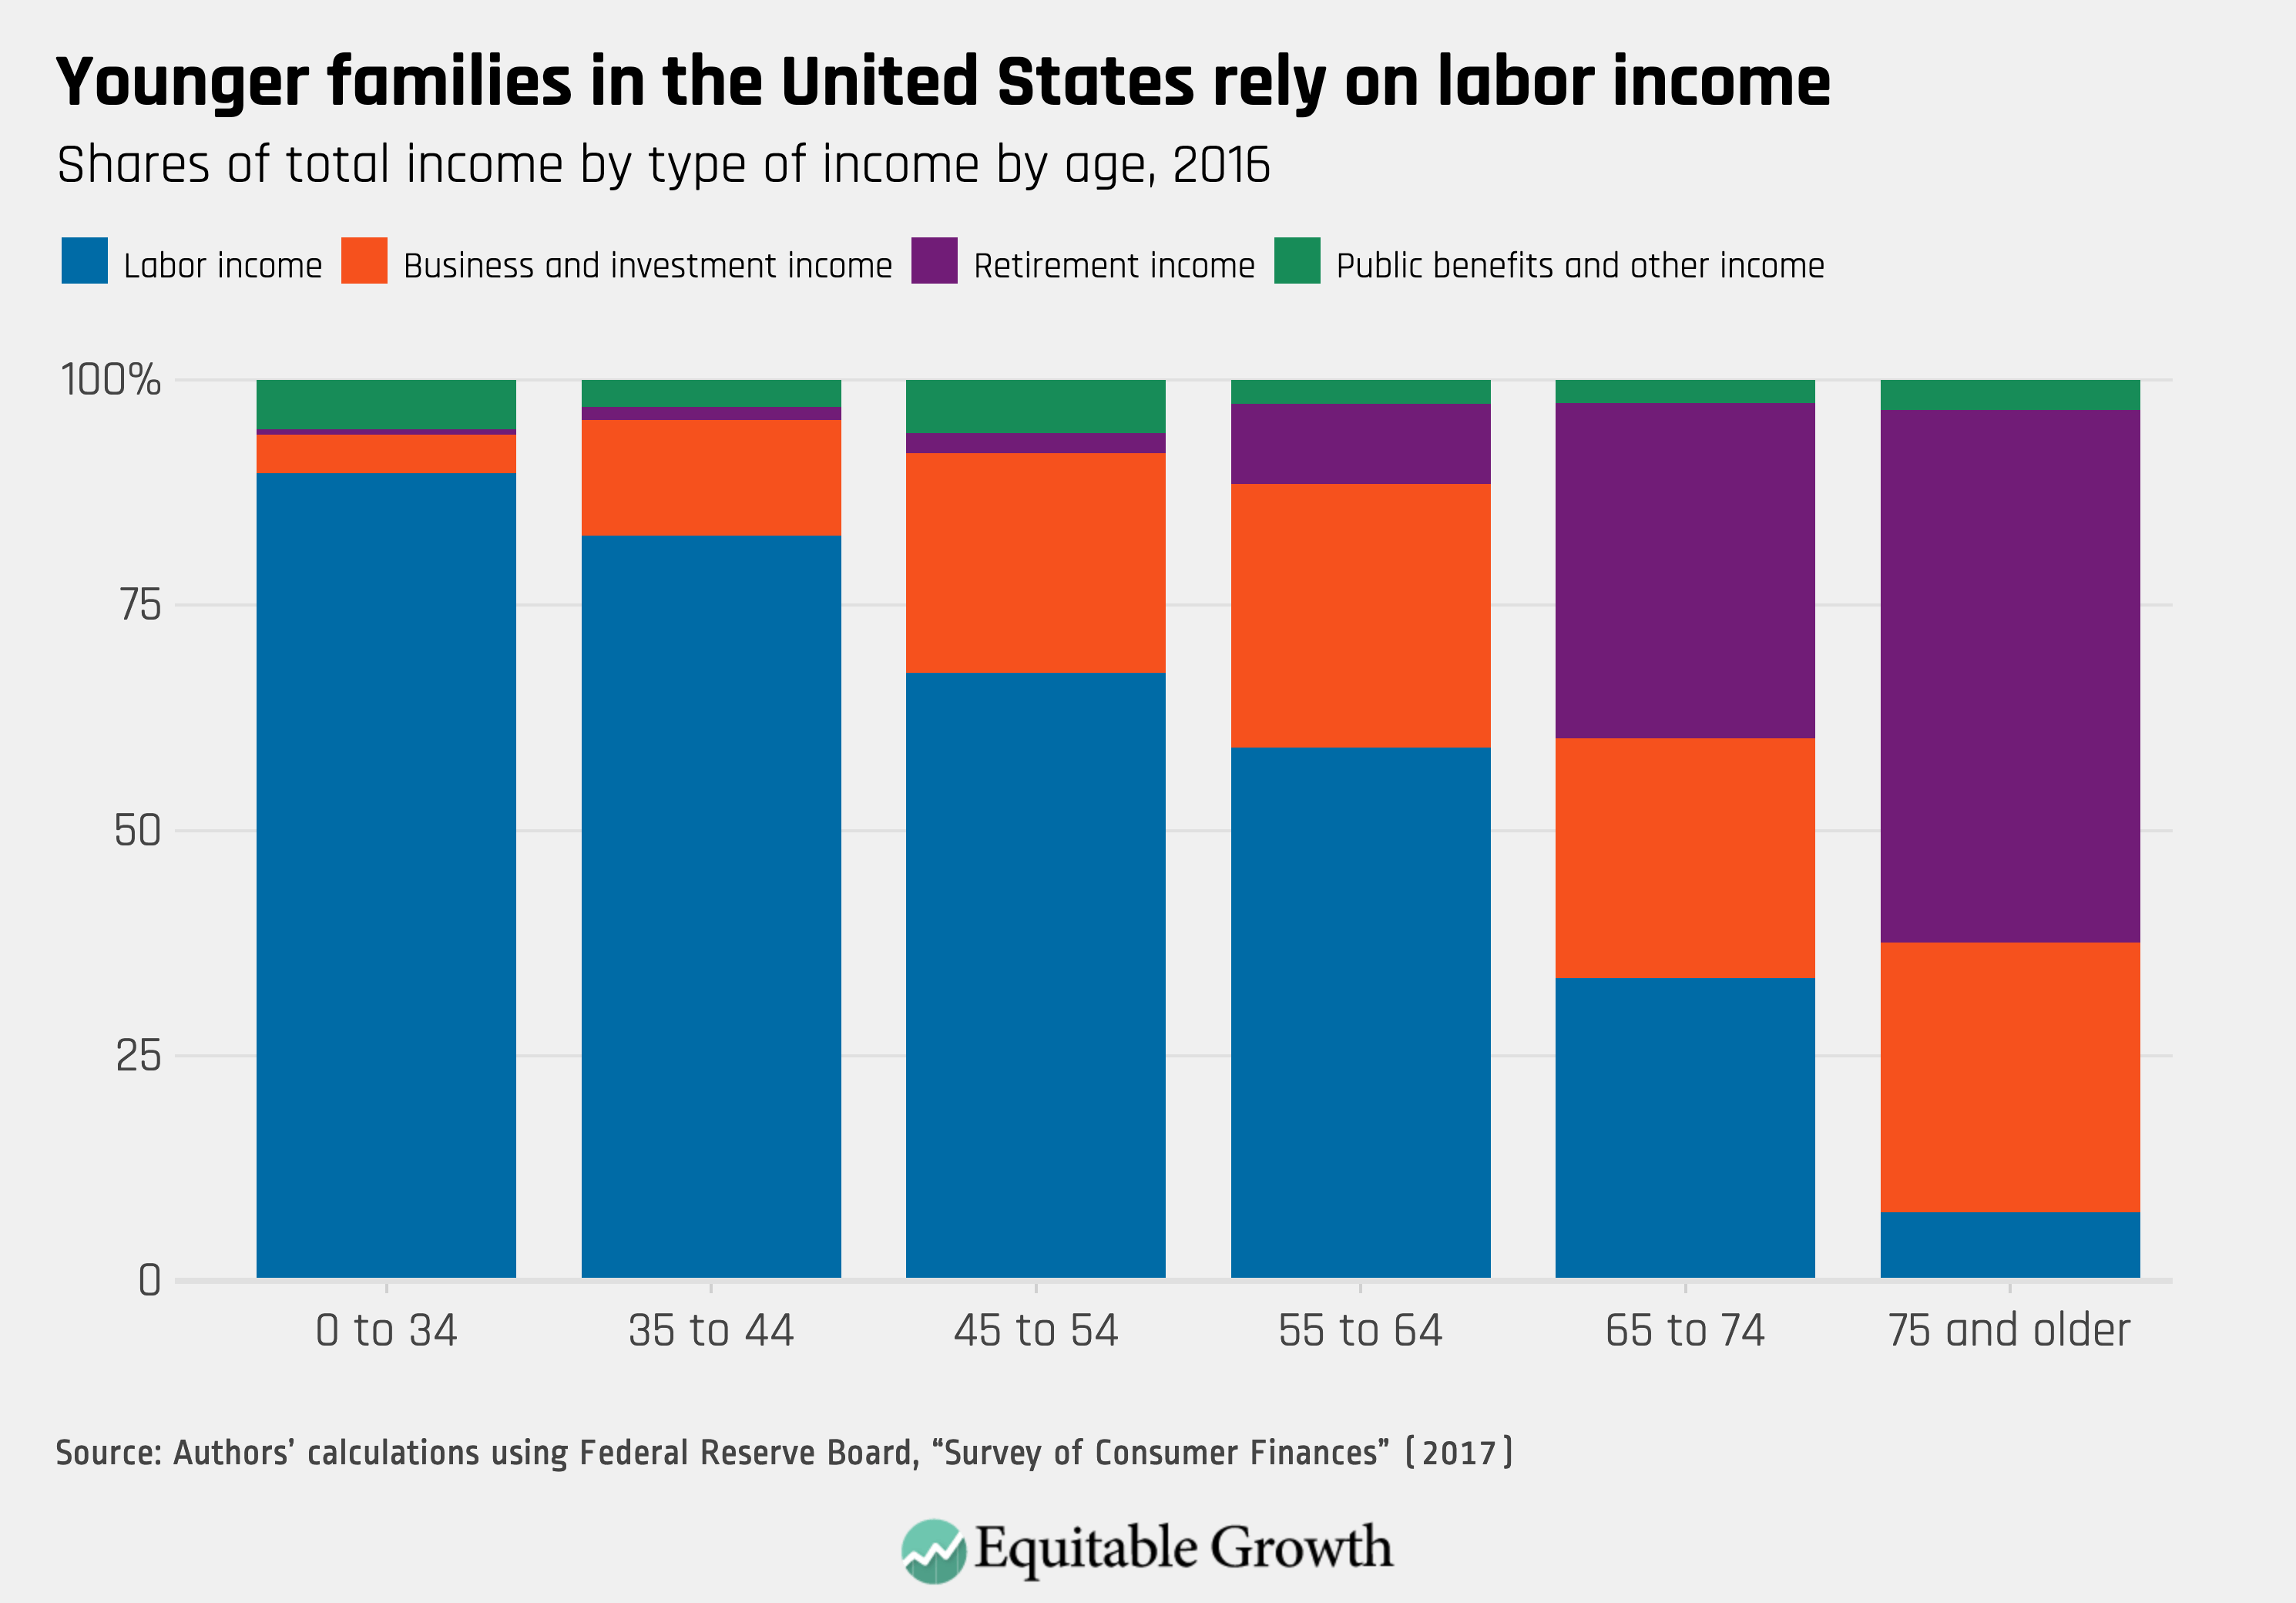
Variation by age is even starker. Young families receive almost all of their income from labor income. Middle-age families rely predominantly on labor income with some investment income, and older families receive little labor income and rely heavily on Social Security and other forms of retirement income. (See Figure 9.)
Figure 9
Families with high incomes tend to have high wealth, and families with low incomes tend to have low wealth, but the correlation between the two is far from perfect. There is a wide range of wealth at every income level. For families in the first quintile of the income distribution, median wealth is $7,000, yet 25 percent of families have wealth of less than $200 and 25 percent of families have wealth above $57,000. In the top quintile of the income distribution, median wealth is $812,000, but 25 percent of families have wealth of less than $278,000 and 25 percent of families have wealth above $2.1 million.
What is aggregate wealth?
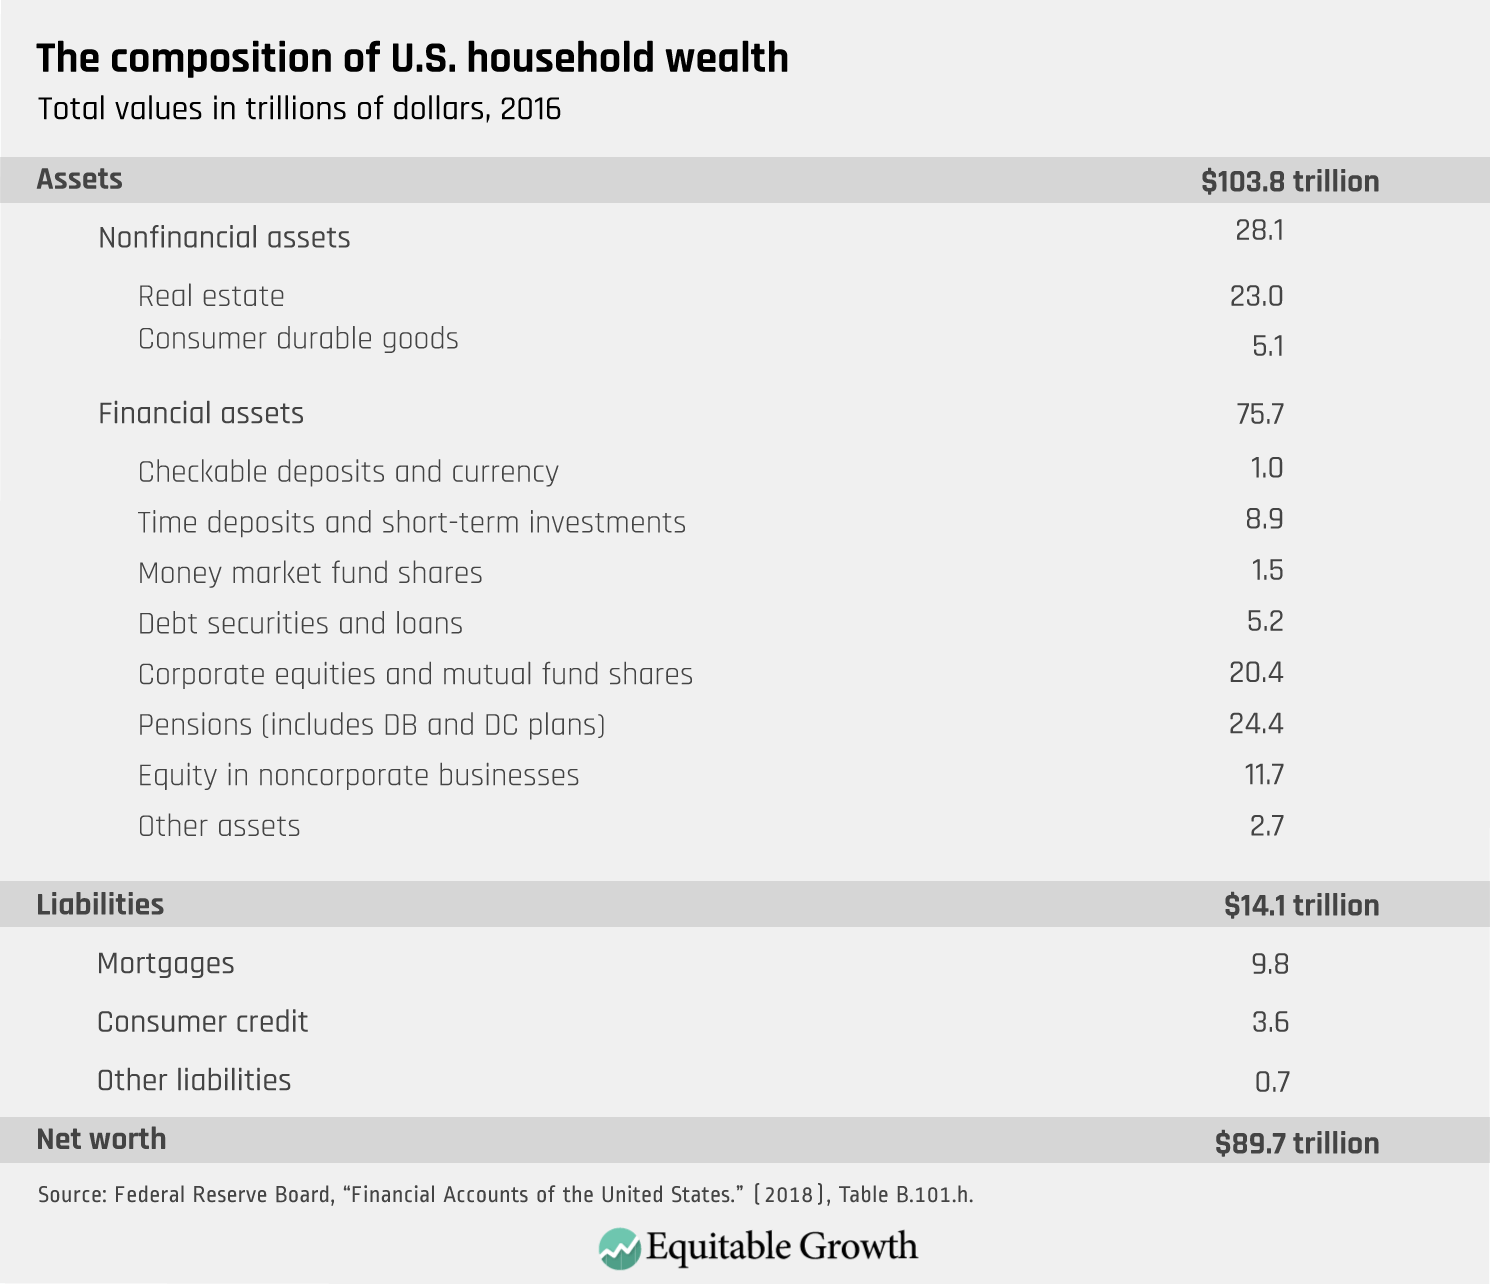
Wealth consists of the various financial and nonfinancial assets a family owns less the various debts family members owe. The total wealth for all U.S. households is the sum of these assets and debts for every family in the country. In 2016, aggregate household wealth for the United States was $90 trillion.13 Households held $28 trillion of nonfinancial assets, primarily owner-occupied housing, $76 trillion of financial assets, and $14 trillion of financial liabilities. (See Table 8.)
Table 8
Financial instruments, however, do not create wealth. Every financial asset is matched by a financial liability. A mortgage, for example, is a debt for the family borrowing money to buy a house and an asset for the bank lending money to that family. Similarly, a corporate bond is a debt for the corporation borrowing money but an asset for the investors lending to that firm. In the aggregate, these financial assets net out and generate no net wealth.
Recognizing these relationships, an alternative measure of aggregate wealth can be defined as the value of all nonfinancial assets in the United States. Assets that are physical in character—such as homes, office buildings, cars, and industrial machines—are considered tangible capital, and assets that are not physical in nature are considered intangible assets. Intangible assets include things such as patents, copyrights, and other intellectual property; brand identity and reputation; and existing business relationships, customs, or practices.
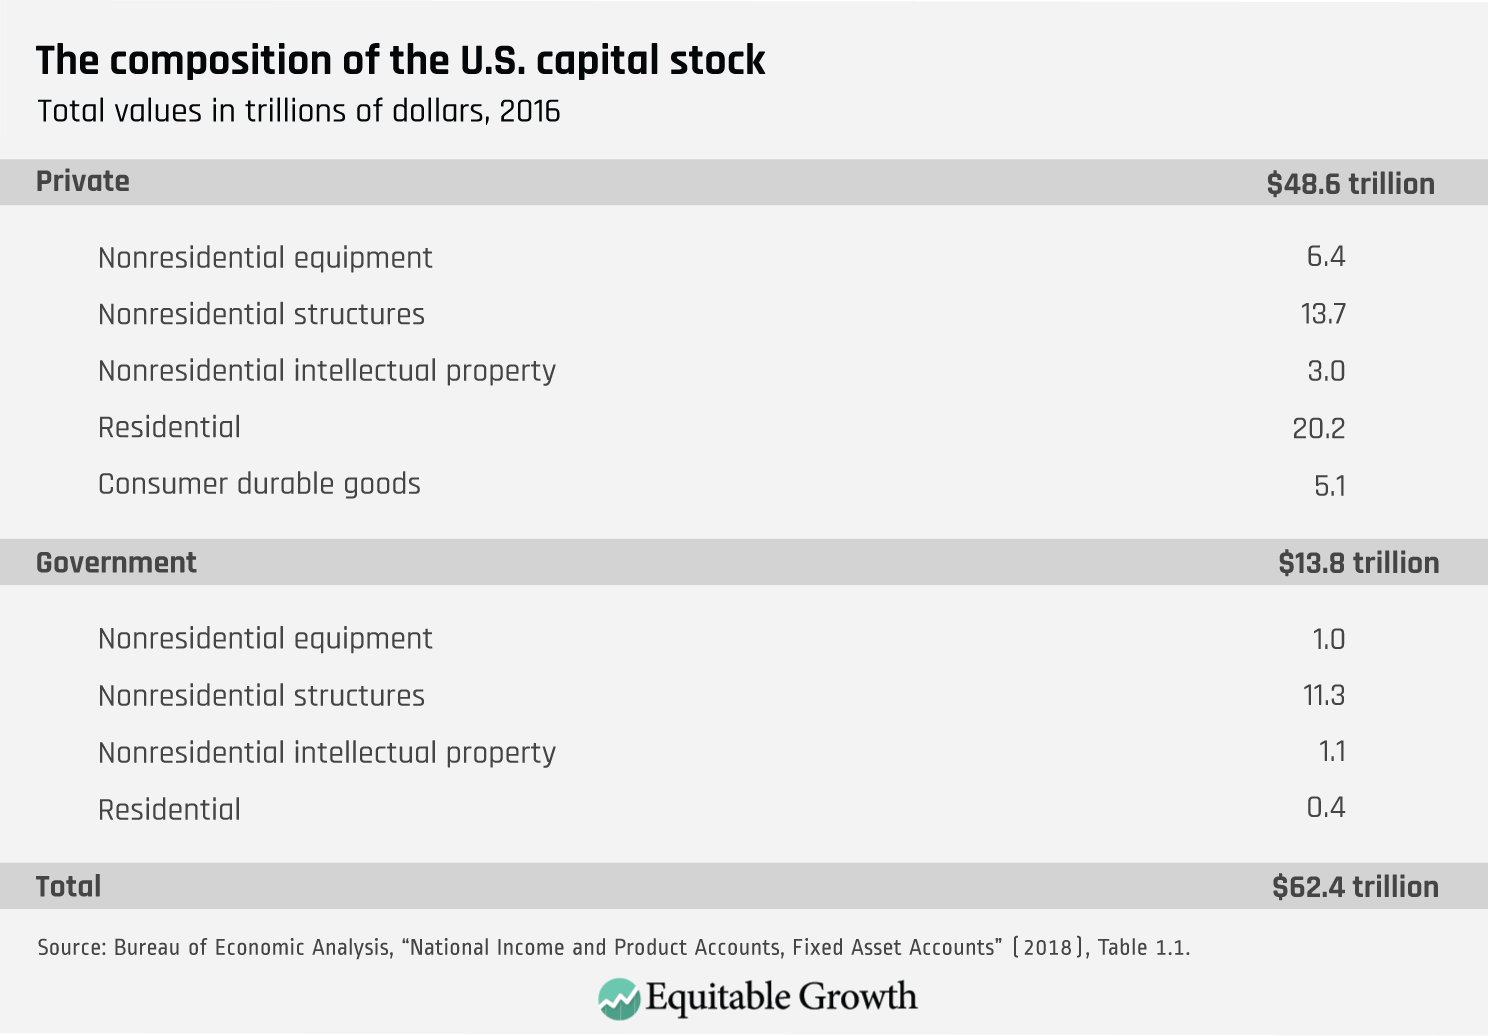
In 2016, the aggregate value of nonfinancial assets for the United States was $62 trillion.14 Of this, nonresidential structures accounted for $25 trillion, residential structures $21 trillion, nonresidential equipment $7 trillion, consumer durables $5 trillion, and intellectual property products $4 trillion. (See Table 9.)
Table 9
This measure of U.S. wealth is far smaller than total household wealth. This difference reflects a number of conceptual and measurement differences between the two estimates. The U.S. federal government is a net debtor, for example, and thus U.S. household wealth exceeds the wealth of U.S. entities. The estimate of household wealth includes the value of land underlying owner-occupied housing, but the estimate of the capital stock does not. Household wealth includes foreign assets held by U.S. households and excludes U.S. assets held by foreign households. The capital stock measure more closely tracks assets located in the United States.
Finally, intangible capital is difficult to measure, especially assets such as brand identity and existing business relationships, customs, and practices. The capital stock estimates include direct estimates of some forms of intangible capital and ignore the rest. The measure of aggregate household wealth embeds the value of some of these types of capital measured through the market valuation of firms.
The difference between these two estimates of aggregate wealth is important both for estimating the revenue raised by a net worth tax and for understanding the incentives it creates. Net worth taxes apply to household wealth, not the capital stock. Particularly in the case of net worth taxes applied only to the wealthiest families, it is thus more appropriate to understand a net worth tax as a tax on the ownership of wealth rather than the ownership or use of assets.
Regardless of measure, U.S. aggregate wealth is large. In conjunction with the highly skewed nature of the wealth distribution, this suggests that the revenue potential of a net worth tax in the United States is large, even if applied only to the very wealthiest families. The wealthiest 1 percent of families holds $33 trillion in wealth, and the wealthiest 5 percent holds $57 trillion.
The relationship between income and wealth in the aggregate
Just as there is a relationship between income and wealth for a single family, there is a relationship between income and wealth in the aggregate. Definitions of aggregate income typically start from the value of all goods and services produced in the United States. This quantity is referred to as gross domestic product, or GDP. Though typically viewed as a measure of output, it can also be understood as a measure of income. When viewed as a measure of income, it is generally referred to as gross domestic income, or GDI. Different methods are used to estimate GDP and GDI, so while the two are the same in theory, they differ in practice.
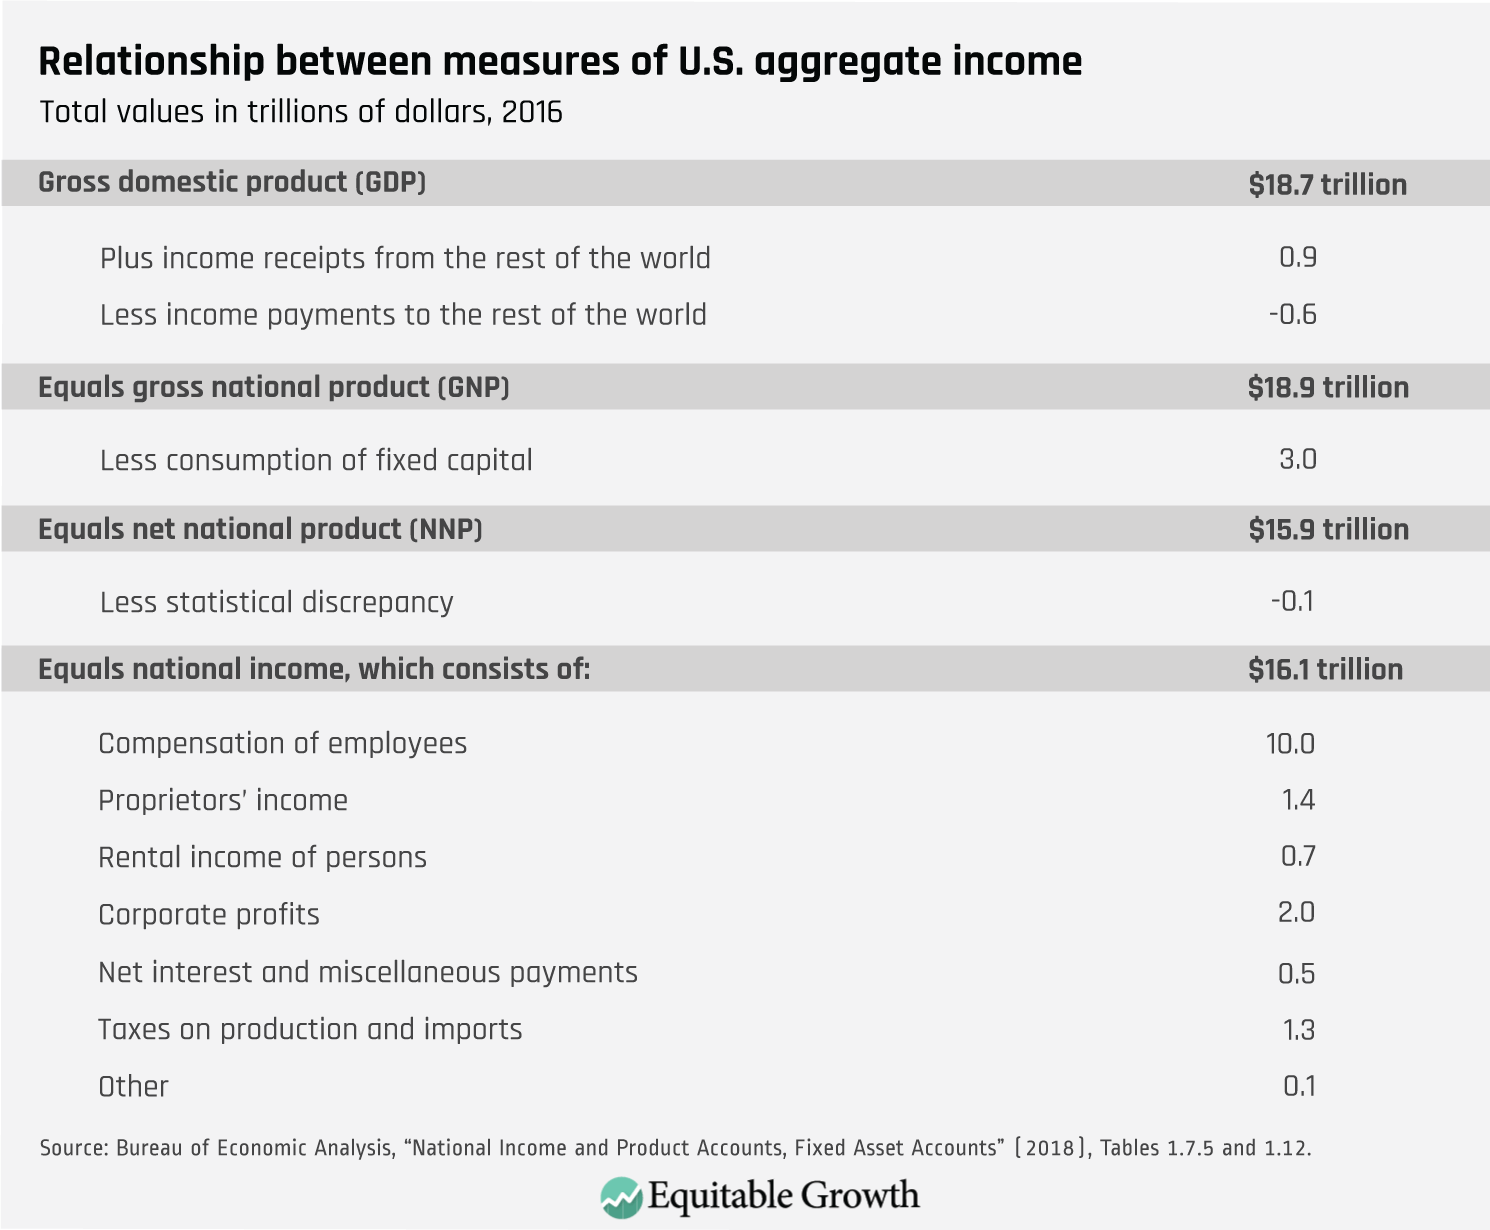
GDP measures economic activity that occurs in the United States. When focusing on income, a focus on U.S. residents is often more relevant. Adjusted to include income receipts from the rest of the world and to exclude income payments to the rest of the world, the corresponding measure is gross national product, or GNP. However, both GDP and GNP overstate the net value of output, as they do not account for the decline in value of the capital stock over time. A truck, for example, will decline in value over the course of a year due to wear and tear from use, exposure to weather, and so forth. This reduction in value is referred to as consumption of fixed capital. Adjusting GNP to reflect this decline yields net national product. Finally, just as GDP can also be thought of as a measure of income, net national product can be thought of as a measure of income. This measure is termed national income, and it reflects the total value of production accruing to U.S. residents during a year. Parallel to GDP and GDI, net national product is equal to national income in theory but not in practice, as they are estimated using different source data.
In 2016, U.S. gross domestic product and gross national product were both $19 trillion. Net national product and national income were both $16 trillion. The adjustment for measurement on a national instead of a domestic basis is of relatively modest size, but the adjustment to reflect depreciation of the capital stock is large.
National income can be decomposed into elements: compensation of employees, proprietor’s income (the profits of noncorporate businesses), corporate profits, rental income, interest, and taxes on production and imports. Employee compensation is the largest single component of national income, accounting for about 60 percent of national income in 2016. (See Table 10.)
Table 10
As with the hypothetical families shown in previous sections, aggregate wealth generates income that can contribute to future wealth (or be consumed). However, in the broad categories shown above, the distinction between income from wealth and other types of income can be ambiguous. Compensation of employees is labor income; rental income of persons, corporate profits, and net interest are primarily income from wealth; and proprietors’ income is a combination of both types.
There are two key differences between the measures of aggregate income shown above and the likely more familiar measures of household income presented in the earlier sections. First, government programs are ignored. Second, capital gains are ignored. Both exclusions are definitional choices that reflect the focus on production in the measurement of aggregate output and income. And, in both cases, the income values reported here can be adjusted—and often are—to reflect the impacts of these other types of income.
In the case of public programs, the net impact of including them is to reduce incomes by the amount of federal, state, and local tax payments and increase incomes by the amount of transfer payments to program beneficiaries. Transfer payments include benefits from a wide variety of social insurance and safety net programs, including Social Security, Medicare, and Medicaid. Adjusting for public programs thus reduces aggregate income by the net value of this difference ($1.7 trillion in 2016).15 The distributional implications of this change are substantial.
More relevant to the consideration of net worth taxes, however, is the treatment of capital gains. Capital gains are the increase in the value of an asset over time. If the price of a house increases due to increased demand for housing in the neighborhood where it is located, for example, then that increase in value would be a capital gain. In contrast, if the house increased in value because the owner renovated it, the renovation would be a further investment, and the increase in value would not be a capital gain. In the case of corporate stock, an increase in the share price would reflect a capital gain, while dividends, which are also a form of income to the shareholder, would not be a capital gain.
Capital gains are excluded from the measures of aggregate income discussed above because they do not reflect current production. Instead, they reflect changes in the value of ownership claims on previously produced assets. Yet these valuation changes are critically important in measuring a family’s economic resources. Moreover, research suggests that these changes in the value of existing assets account for a substantial share of income in recent decades.16
As a result, estimates of income inequality including and excluding capital gains can paint a different picture. As capital gains are far more unequally distributed than other sources of income, increases in capital gains relative to other sources of income can lead to substantial inequality in income across different groups. Capital gains are also volatile. Thus, measures of income that include capital gains are much noisier than other measures.
How do net worth taxes work?
Net worth taxes are taxes imposed on a family’s wealth. These taxes are often referred to as wealth taxes, though the term wealth tax can also refer to other types of taxes such as property taxes, capital gains taxes, corporate taxes, and estate or inheritance taxes.17
Two critical parameters in specifying a net worth tax are the exemption and the rates. The exemption determines which families owe the tax. A net worth tax with a $1 million exemption, for example, would mean that any family with less than $1 million of wealth would not pay the tax. As will be discussed below in greater detail, one of the dimensions along which net worth taxes vary is whether they apply only to the extremely wealthy or whether they apply to a larger share of the population.
The rates determine the amount of tax owed on wealth in excess of the exemption. A net worth tax at a 1 percent rate with a $1 million exemption, for example, would charge a family a tax equal to 1 percent of their wealth above $1 million. A family with $500,000 of wealth would pay no tax; a family with $1 million of wealth would pay no tax; and a family with $2 million of wealth would pay $10,000 in tax, for an effective tax rate on their total wealth of 0.5 percent. (See Figure 10.) Just as with income taxes, net worth taxes may have a flat rate structure or a progressive rate structure.
Figure 10
In addition to these two basic parameters, net worth taxes vary in terms of how they define wealth subject to tax. Most net worth taxes start from a broad definition of financial and nonfinancial wealth, but various types of wealth may receive preferential treatment.
There is a close parallel between the special treatment of certain types of assets in net worth taxes and income taxes. Indeed, these preferences are often applied to the same assets under the two systems such as owner-occupied housing and certain business assets. Moreover, just as with the income tax, these preferences should be examined closely. While the underlying policy goals may be reasonable, tax preferences are generally not the best way to achieve those ends. In essentially all cases, it will be preferable to include all assets and liabilities in the base of a net worth tax and achieve any other policy goals through separate policies or an increase in the exemption. We provide a brief overview of preferences for owner-occupied housing and businesses below.
Preferences for owner-occupied housing could be in the form of an additional exemption specific to housing, implicit or explicit reductions in the value of housing subject to tax, or a complete exclusion from tax, among other possibilities. Each of these approaches offers an advantage to home equity relative to other types of wealth.
Spain’s net worth tax provides a €300,000 per-person exemption for a primary residence.18 For many families, this would be sufficient to exclude the entire value of the primary residence. In Norway, 75 percent of the value of a primary residence is excluded.19 In Switzerland, housing is taxed according to assessed values by cantonal governments, which are typically substantially below market value, providing an implicit preference.20
These preferences for owner-occupied housing interact with other features of a net worth tax. A tax that exempts the first $1 million of wealth, for example, would necessarily exempt the primary residence of any family with less than $1 million in wealth and provide an implicit partial exemption for families with more than $1 million in wealth. For this reason, concerns about progressivity are generally best addressed via the exemption, not asset-specific preferences.
Preferences for closely held businesses can be more complex, particularly in the eligibility requirements. Closely held businesses are a diverse group. They may employ many people or only a few. They may have substantial assets or none. Medical practices, for example, are one form of closely held businesses common among the wealthy, many of which employ few people and have few assets. In contrast, Cargill—a company operating in a range of agricultural, food, and related industries—is one of the largest U.S. companies, public or private, but it remains closely held by descendants of the founders.
Preferences for closely held businesses can take a variety of forms, including a partial or complete exclusion and preferential valuation regimes. Eligibility requirements for these preferences can vary in terms of how concentrated ownership must be, how involved the family must be in operating the business, and similar factors. Spain, for example, offers an exemption for businesses that a person engages in directly and an exemption for the corporate equity of closely held businesses. To qualify for the latter exemption, a taxpayer must manage the business and receive income from doing so that accounts for at least 50 percent of that taxpayer’s income, while also owning at least 5 percent of the business individually or 20 percent in combination with other family members. In addition, the business must not be primarily engaged in investment or other nonoperating activity.21
Net worth taxes typically apply to the worldwide assets of residents and the domestic assets of nonresidents. This treatment has a parallel in the taxation of investment income under income tax systems around the world. Capital gains taxes are typically imposed based on the residence of the investor, not the company. Thus, the U.S. government taxes the capital gains of U.S. investors, regardless of the country where the underlying assets are located, and does not tax capital gains of foreign investors attributable to their investments in U.S. assets.
An additional set of issues is raised by entities that are exempt from tax. In the U.S. context, two key types of exempt entities are pension funds and nonprofit organizations. Pension funds are generally excluded from net worth taxes around the world, both those existing today and in the past.22 But this is not the only choice for treatment. Among other possibilities, pension entitlements could be valued and included in the net worth tax base, or a tax could be applied to the pension fund directly. Similarly, nonprofits could be exempt from the tax, taxed on their endowments, or taxed on their wealth.
Finally, net worth taxes require a variety of more technical rules as they relate to the various legal arrangements that wealthy families may use to organize their finances, much as technical rules exist for the estate and gift tax and the income tax. Two particularly salient issues are the treatment of trusts and gifts. Two polar cases for the treatment of trusts are to ignore trusts for the purposes of the net worth tax and assign all assets and liabilities to a combination of people who contributed assets and beneficiaries, or instead apply the net worth tax to trusts directly with little or no exemption. Similarly, a net worth tax may not have rules regarding gifts (effectively placing no limits on the use of gifts to avoid a net worth tax), or it may have rules that disregard certain gifts and transfers. The latter approach has a parallel in the kiddie tax, which attributes certain income of minor children to their parents for purposes of the U.S. income tax.
Beyond the specification of the tax base, one of the key administrative considerations under a net worth tax is how the assets are valued. The valuation regime combines two primary elements: What the valuation concept is and how the values are generated. Net worth taxes often combine different approaches to valuation for different assets and liabilities. Net worth taxes typically start from a market valuation concept, the hypothetical value at which two unrelated parties would agree to buy or sell the asset. These values may be self-reported, reported by a third-party such as a financial institution, or both.
Exceptions to this generalization, however, are common. Real estate is often taxed based on administrative valuations such as those used for property taxes. As noted above for housing, there may be implicit preferences embedded in these valuations. Still other approaches are also possible. Assets could be valued based on their basis and an assumed return, for example.
This diversity of approaches to valuing assets and liabilities has parallels in the U.S. tax system. The value of property for the purposes of the property tax is assessed by local governments—and the taxpayer can appeal—while the value of property for the purposes of the estate tax is provided by the taxpayer—and the government can challenge it. Third-party reporting covers many types of income under the income tax, but filers are required to self-report all sources of income on their tax return, including those that are not subject to third-party reporting.
The relationships between net worth taxes and income taxes
The distinction between taxes on income and taxes on wealth is often not clear cut. Assets have value because of the income (implicit or explicit) they are expected to generate. As such, taxing wealth through a net worth tax and taxing income from wealth through an income tax can have similar effects.
The United States imposes a number of taxes on wealth and on capital income. Estate and gift taxes impose a tax on wealth when it is transferred, though they generally apply only to the very wealthy. Property taxes apply to the value of one specific type of asset: real estate. Capital gains and dividend taxes apply to investment income. Capital gains taxes apply to increases in the value of an asset, but they are due only when the asset is sold. Dividend taxes are due when investors receive dividend payments. Taxes on business income apply to the profits of both corporate and noncorporate businesses. These profits are, in part, a return to the assets held by the business.
Other types of taxes that straddle the boundary between income and wealth taxation are also possible. The Netherlands, for example, has a tax that is formally part of the income tax system but operates much like a net worth tax. This tax, which replaced a previous explicit net worth tax, imputes income to taxpayers as a percentage of their holdings of certain types of assets. From an economics viewpoint, this tax looks like a net worth tax on those assets, but it is motivated as an income tax on those assets, based on a schedule of assumed returns.23
A simplified example illustrates the connections between income and wealth taxes. If all assets generate a 4 percent return, and all borrowing is done at a 4 percent interest rate, then there would be no difference between a 1 percent tax on wealth and a 25 percent tax on income from wealth. (See Figure 11.)
Figure 11
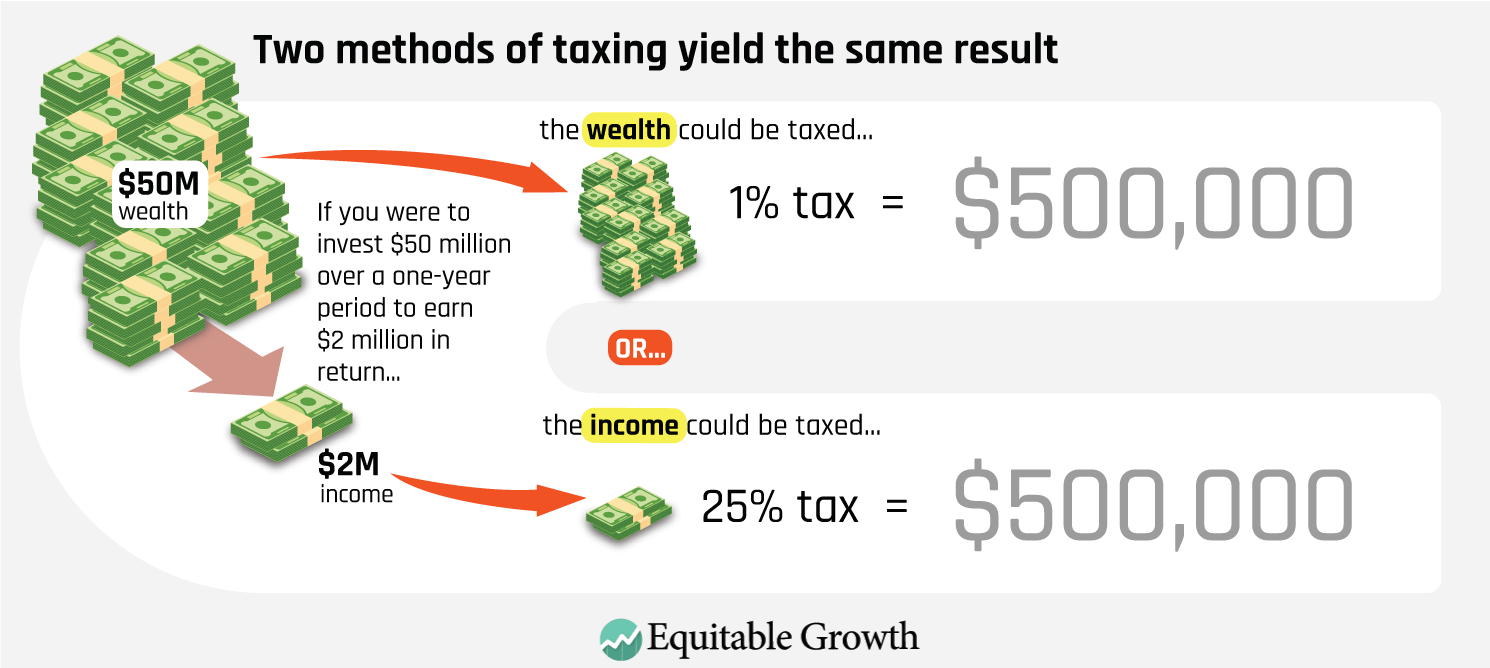
In practice, these taxes would have different effects because the assumption of a universal return and interest rate does not hold. The return on assets is variable across assets and uncertain for a single asset. Moreover, under a realization-based income tax system, income is not taxed until owners sell assets.
Thus, while idealized versions of different approaches to taxing wealth and income are closely related to each other, real-world taxes can apply to specific taxpayers in different ways. One illustration of these differences is the investor who sells few assets in any year.
Suppose a wealthy investor whose net worth is $50 million earns a return of $4 million, but he realizes only $400,000 of income. A net worth tax imposes tax on the stock of wealth regardless of the returns. At 1 percent, assuming no exemption for simplicity, the net worth tax liability would be $500,000. A mark-to-market system of taxation imposes tax on the return regardless of whether it is realized. At 25 percent, the mark-to-market income tax liability on the $4 million return would be $1 million. Finally, a realization-based system of taxation imposes tax only on realized income from asset sales, dividends, and other income payments. In this case, a 25 percent realization-based income tax liability on the $400,000 of realized gains would be only $100,000.
The net worth tax and the mark-to-market income tax differ because only the latter varies with the actual return. In the example above, the mark-to-market tax liability exceeds the net worth tax liability because the return is 8 percent, but tax liability under a mark-to-market system could also be much less than the net worth tax liability if the return is low or negative in a year. Finally, the tax liability under the realization-based system is much lower because the investor can choose not to realize gains and thus defer tax.
An important distinction between different types of taxes on wealth is whether they apply to an asset by reason of its existence or by reason of its contribution to wealth. A local property tax, for example, applies to the value of housing regardless of who owns it and regardless of whether there is a mortgage. In contrast, a tax on net worth typically applies only to high-wealth individuals.
Similarly, the corporate tax applies to the income generated by assets used by the firm, while a net worth tax applies only to those assets when owned by a high-wealth individual. These differences will tend to make net worth taxes even more progressive than other types of taxes on wealth or the income from wealth. Net worth, estate, and inheritance taxes are more frequently applied to the wealthiest families, while corporate taxes apply to businesses and thus have greater potential for the shifting of incidence.
Net worth taxes around the world
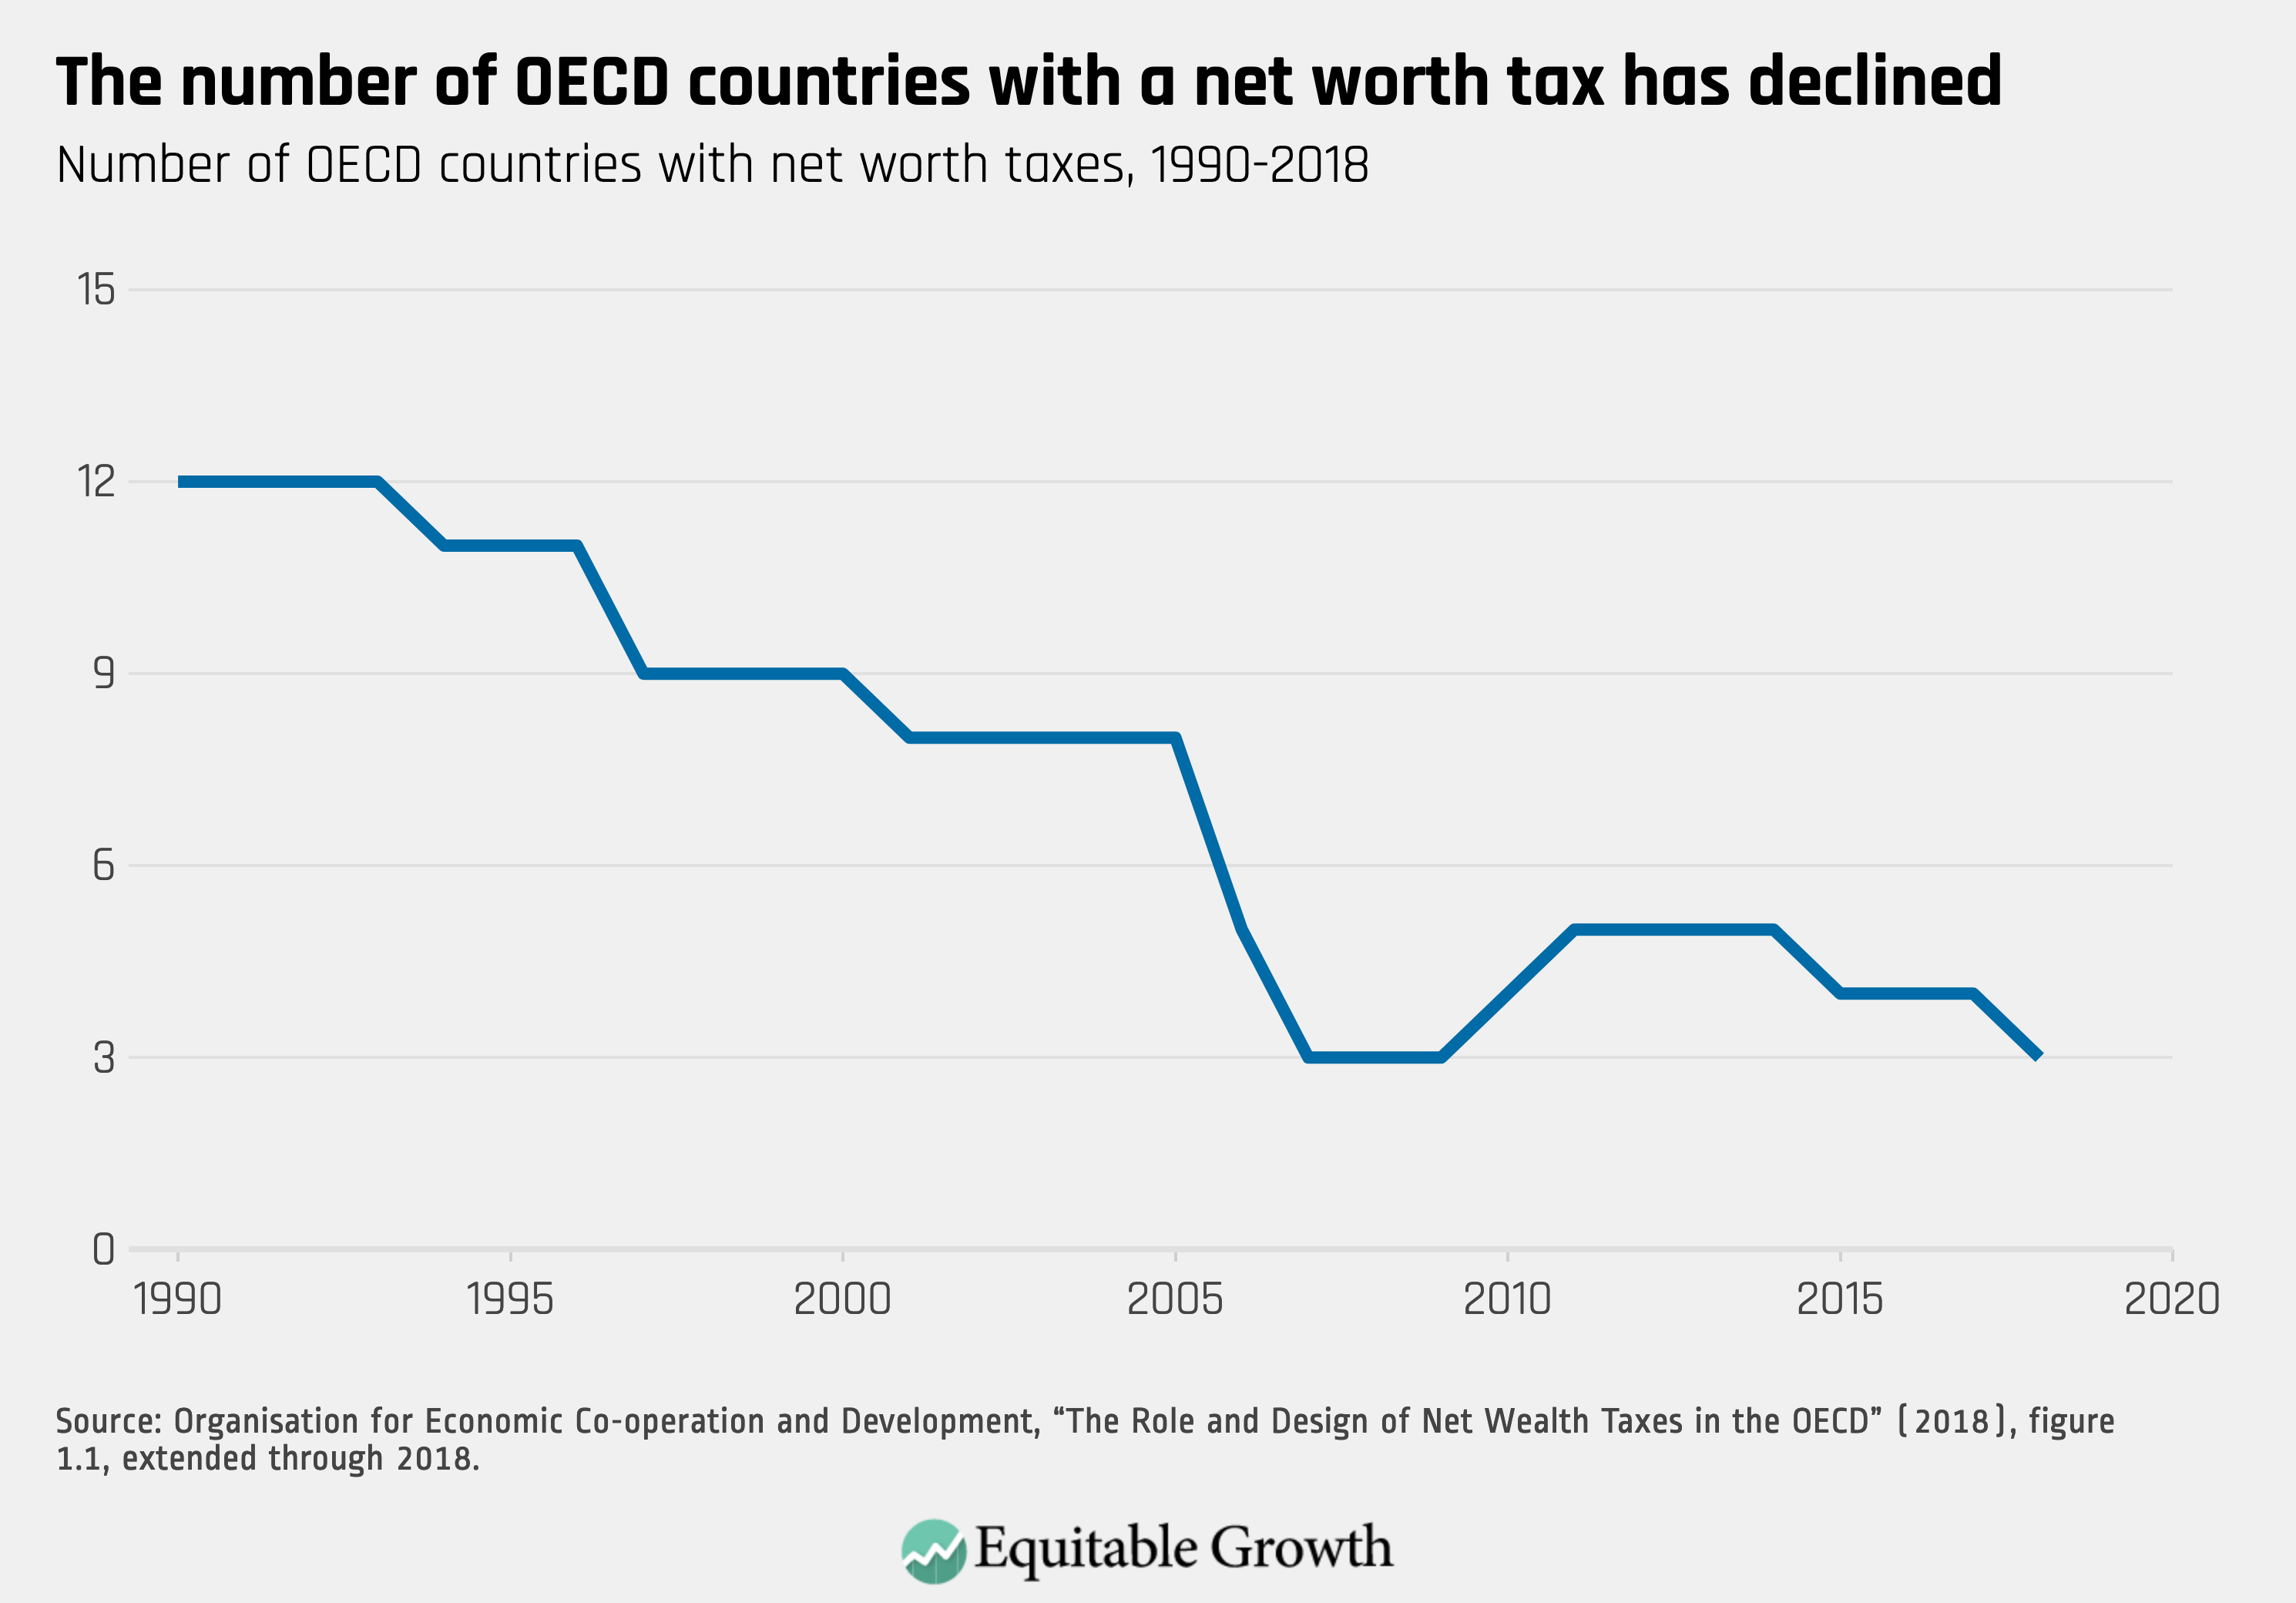
Net worth taxes have been used in countries around the world, and, while they are less common today than they were a few decades ago, they remain an important policy tool. In this section, we provide a brief overview of net worth taxes in developed countries drawing on a recent OECD report on net worth taxes.24 All cross-country comparisons combine taxes imposed by the central government and subcentral governments.
The number of OECD countries with net worth taxes has been declining over time. In 1990, 12 countries had net worth taxes. In 2000, 9 countries had net worth taxes, and in 2018, it was only three: Norway, Spain, and Switzerland. (See Figure 12.)
Figure 12
The trend away from net worth taxes has been part of a broader trend of reduced taxation of the wealthy around the world. Top statutory personal income tax rates in OECD countries fell from an average of 64 percent in 1981 to 41 percent in 2008. But measures enacted during the Great Recession of 2007–2009 resulted in a slight increase in the top rate between 2008 and 2016. In the same way, the trend away from net worth taxes was reversed during the Great Recession, with Iceland and Spain restoring their net worth taxes. (See Figure 13.)
Figure 13
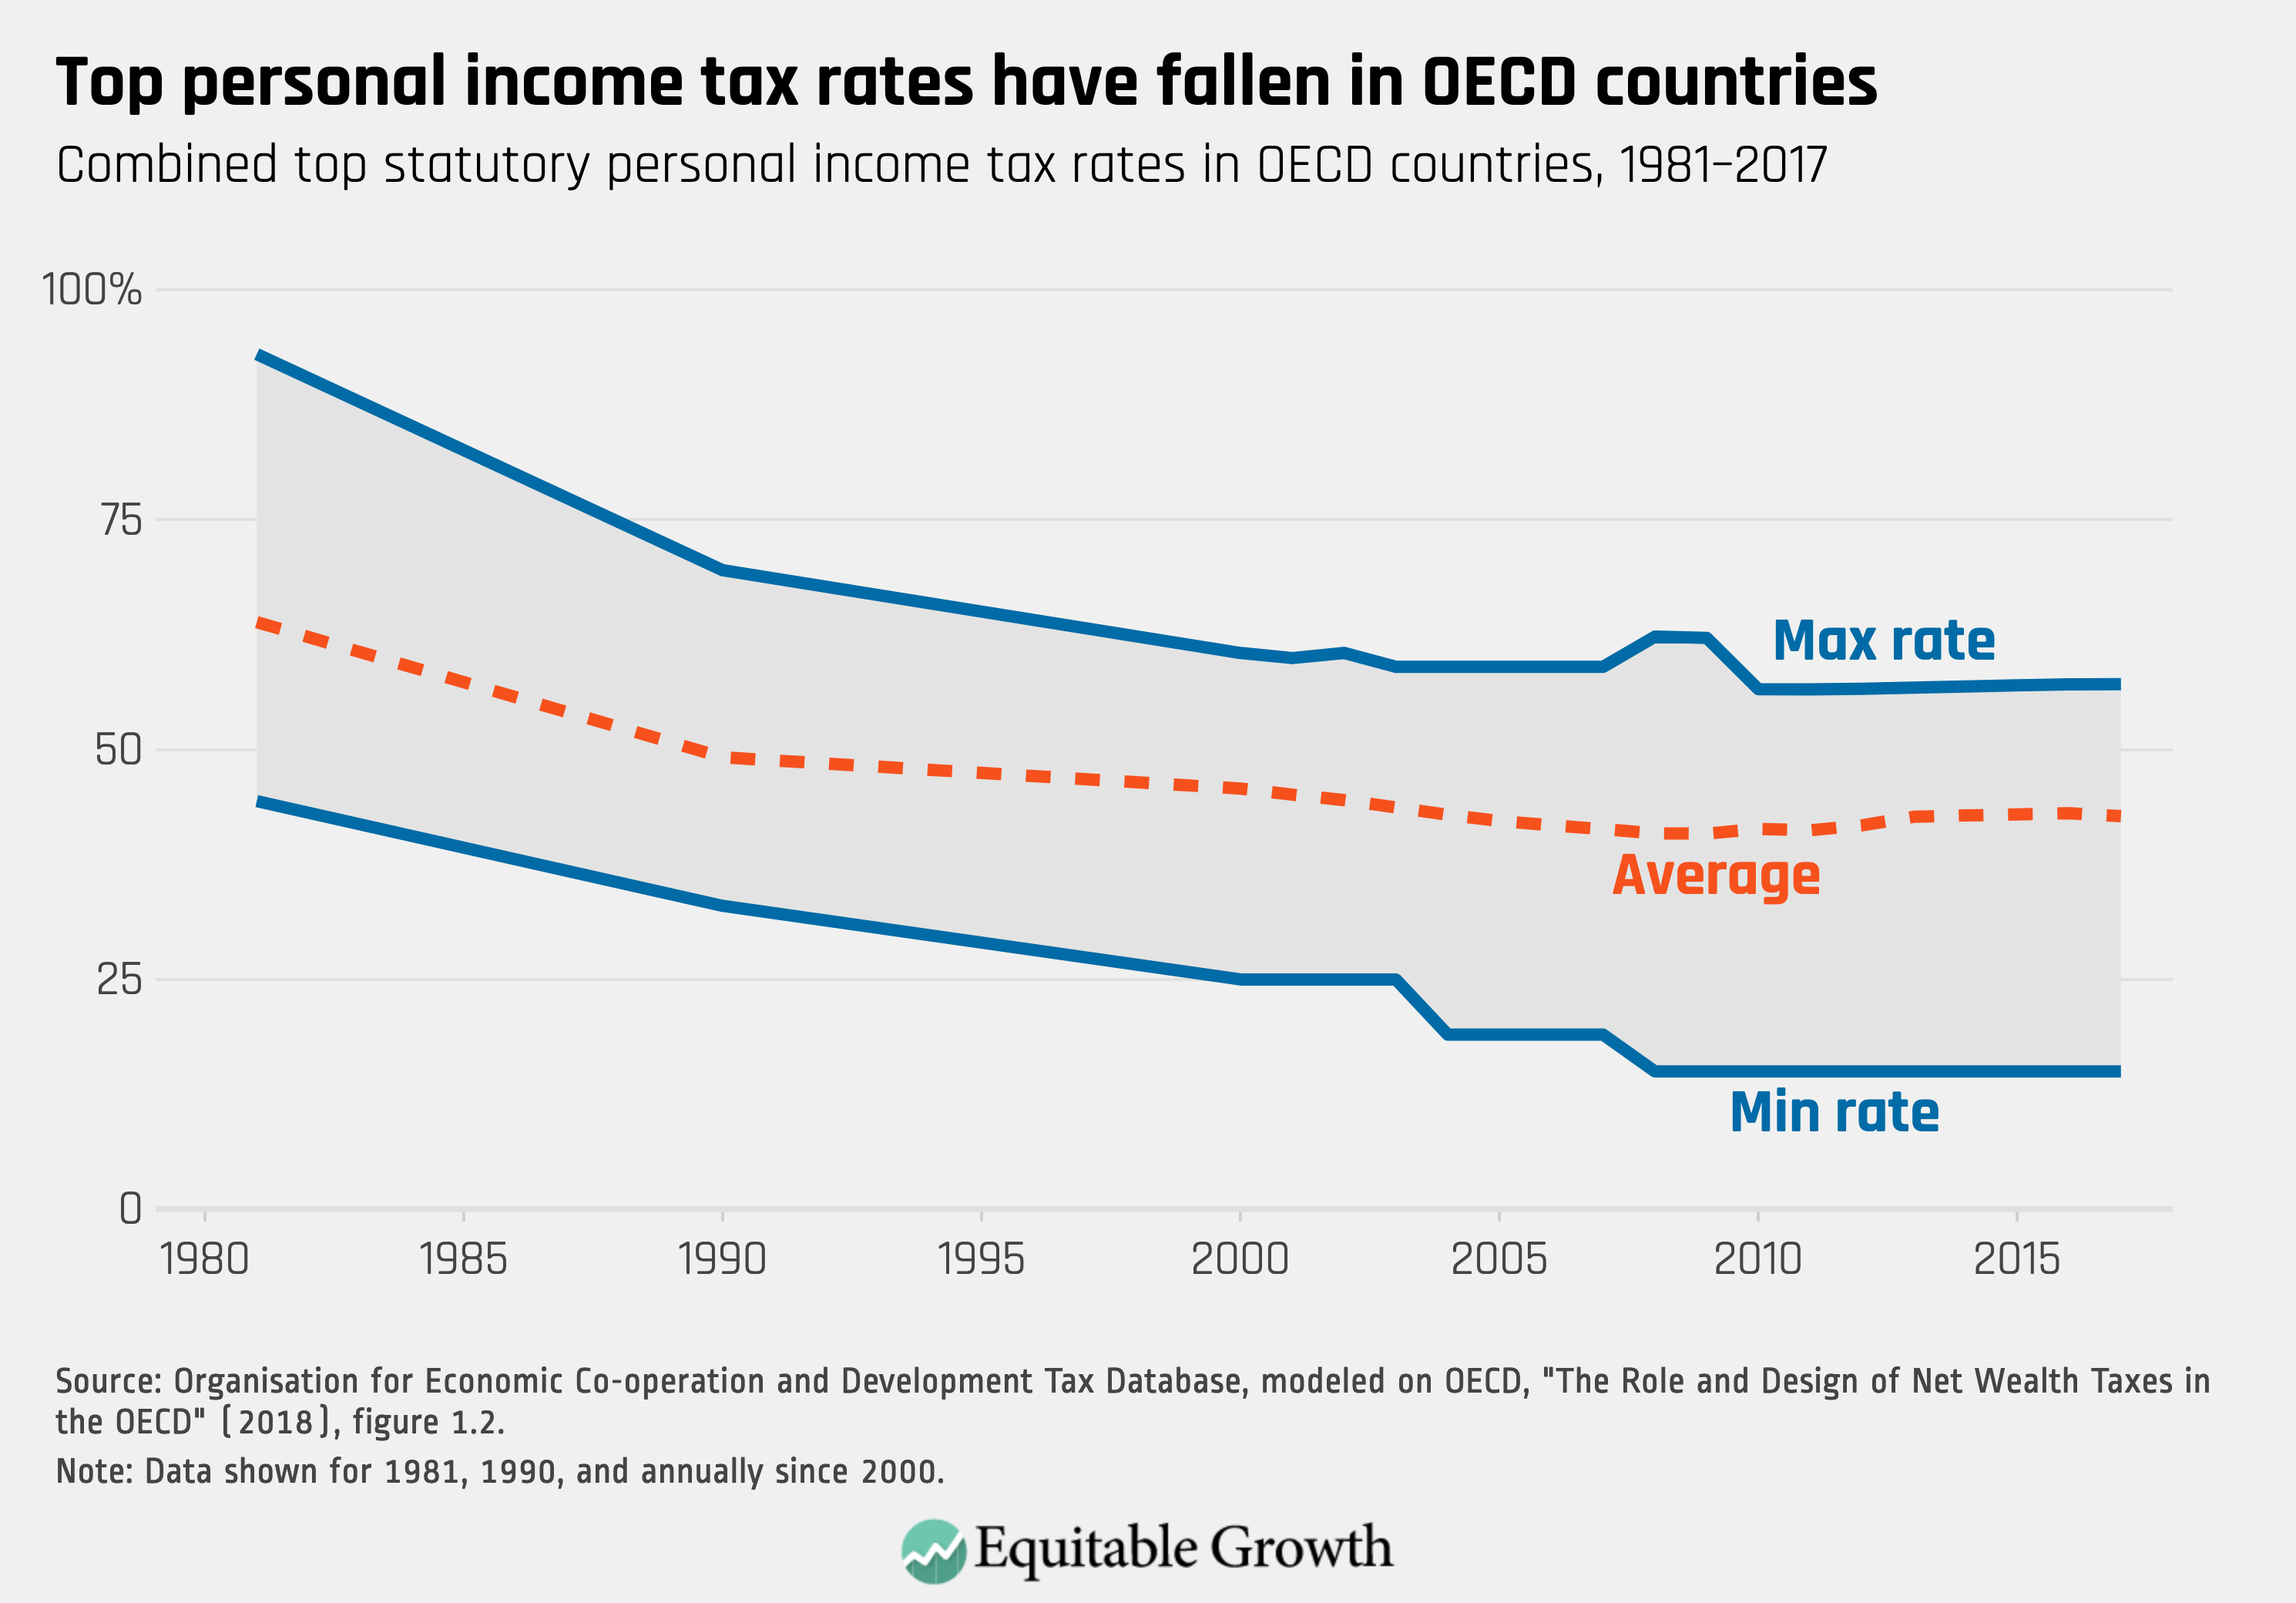
A similar downward trend in top corporate income tax rates has also occurred since 1981 (not shown in Figure 14), with the Tax Cuts and Jobs Act of 2017 a notable recent contribution to this trend in the United States.
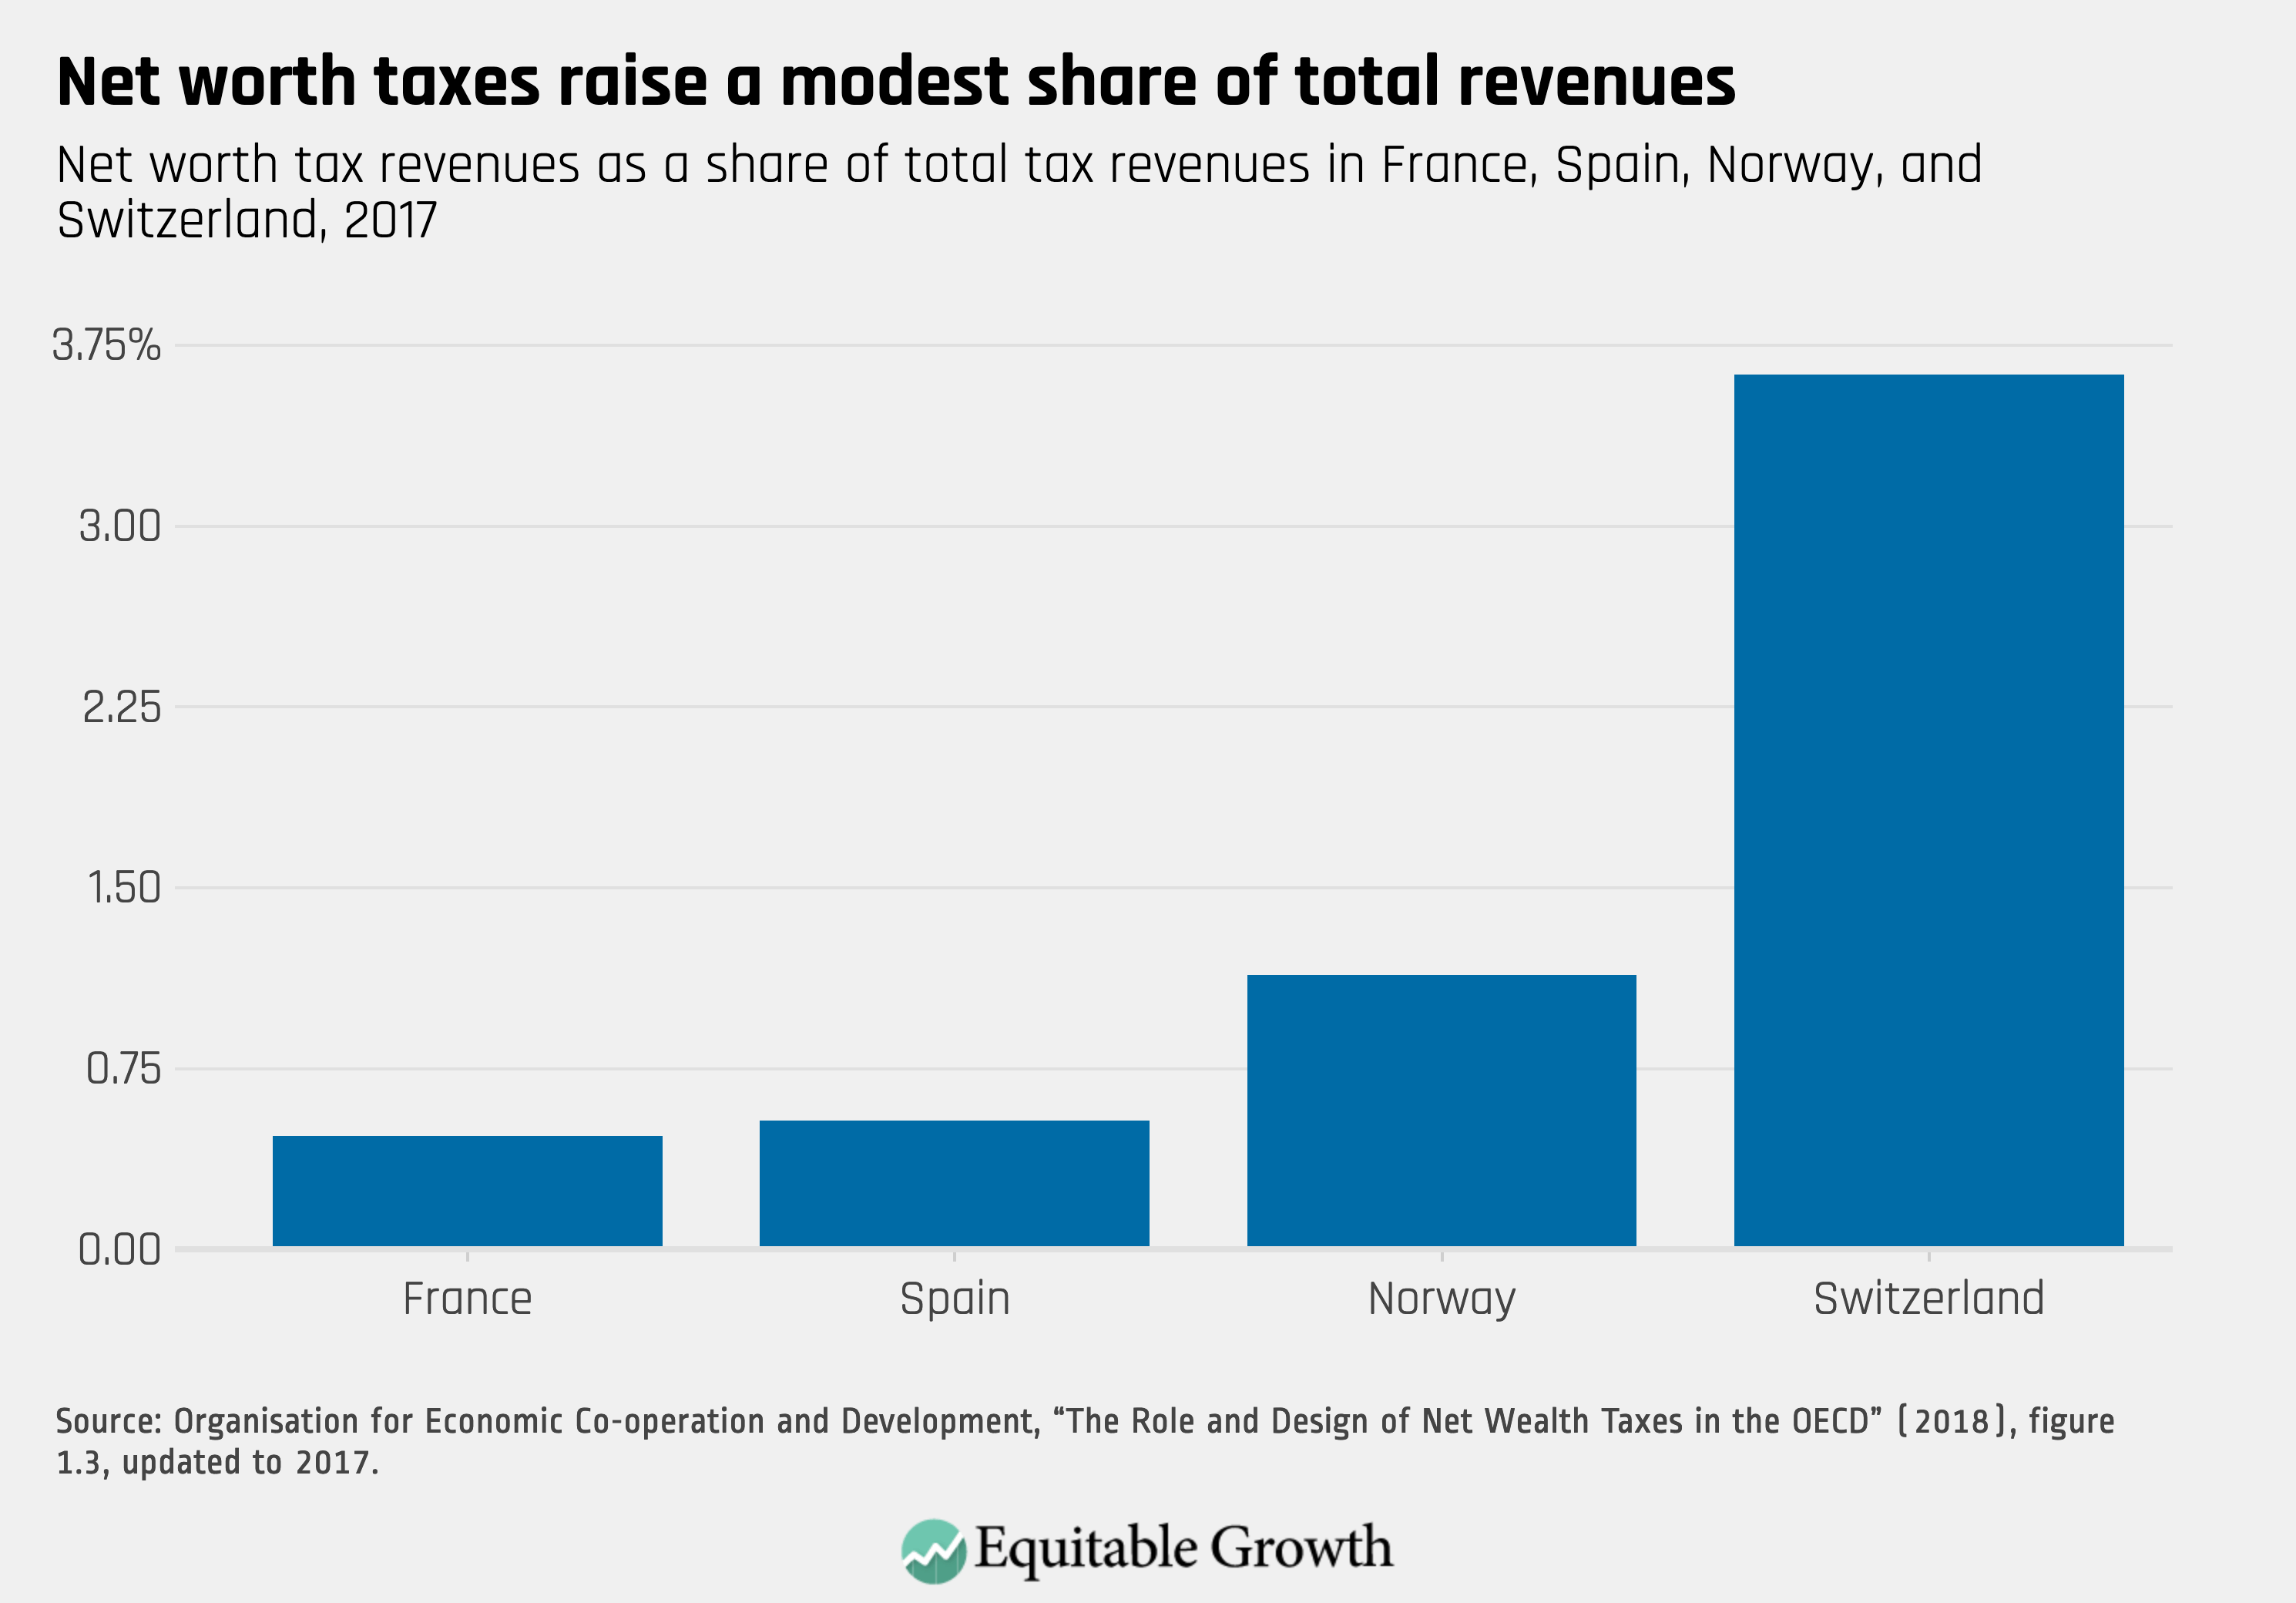
One reason policymakers may have found it politically feasible to repeal net worth taxes is that they typically account for only a modest share of total revenues. Net worth taxes in Spain and France accounted for about 0.5 percent of total tax revenues in 2017. The net worth tax in Norway accounted for about 1.1 percent of revenues, and the net worth tax in Switzerland accounted for about 3.6 percent of revenues. (See Figure 14.) Yet the revenue potential of these taxes remains large in absolute terms. The Swiss tax raised about 1 percent of GDP in 2017 and the Norwegian tax 0.4 percent of GDP. Applied to the U.S. economy, revenues at these levels would correspond to about $80 billion to $200 billion in 2018.
Figure 14
One reason that net worth taxes account for a relatively small share of total revenues is that they are typically applied only to the upper tail of the wealth distribution. In Spain, for example, the exemption from the wealth tax is €1.4 million for a married couple.25 In France, prior to repeal, it was €1.3 million. Switzerland has long been an exception to this generalization, providing a much smaller exemption. Exemptions are set by cantons; the exemption in the canton of Zurich (the largest canton) is about €135,000. Consistent with a smaller exemption, Switzerland also raises a relatively larger share of revenues from the wealth.26
In addition to the highly unequal distribution of wealth, these generous exemptions make net worth taxes one of the most progressive taxes in the policy toolbox. Even as they account for a relatively small share of total revenues, they allocate that burden to a high-wealth population, allowing for a reduced burden on the rest of the population.
Finally, as discussed above, existing and historical net worth tax bases differ in terms of their treatment of specific assets and liabilities. (See Table 11.)
Table 11
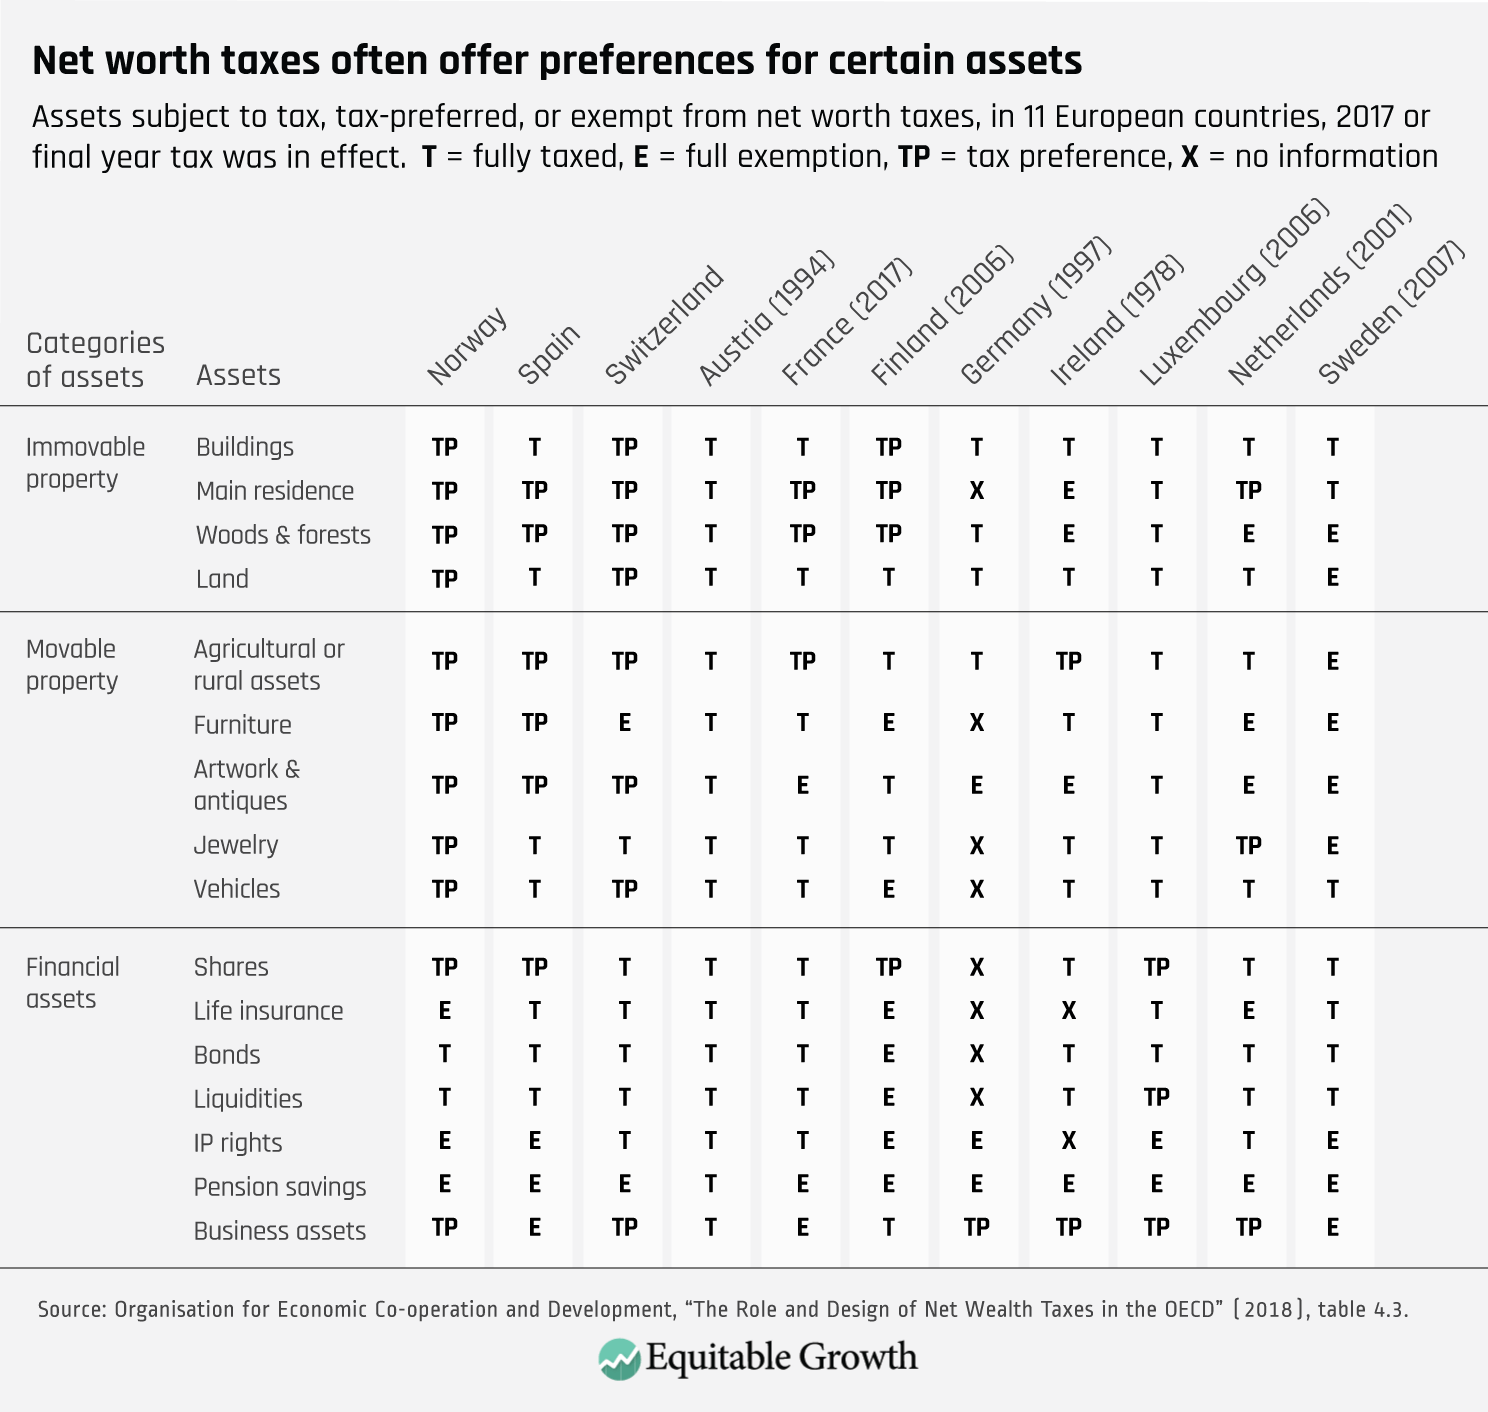
A thorough review of these differences is beyond the scope of this report.27
Conclusion
Policymakers looking for a highly progressive tax instrument that raises substantial revenue would find a net worth tax appealing. Such a tax would impose burden primarily on the wealthiest families—reducing wealth inequality—and could raise substantial revenues. Families with high wealth relative to their income would bear relatively more of the burden of a net worth tax than an income tax. Families with low wealth relative to their income would bear relatively less. A net worth tax, or other means of taxing wealth, would thus generally shift the tax burden not only from low-wealth families to high-wealth families, but also from younger families to older families and from families of color to white families.
About the authors
Greg Leiserson is the director of Tax Policy and senior economist at the Washington Center for Equitable Growth. Prior to joining Equitable Growth, he served as a senior economist at the White House Council of Economic Advisers and as an economist in the U.S. Treasury Department’s Office of Tax Analysis. He holds a doctorate from the Massachusetts Institute of Technology and a bachelor’s degree from Swarthmore College.
Will McGrew is a research assistant at the Washington Center for Equitable Growth. Prior to joining Equitable Growth, he worked as a research assistant at Yale Law School and the Yale Institution for Social and Policy Studies, and interned at Morgan Stanley Public Finance, the Washington Center for Equitable Growth, and Hillary for America. McGrew graduated from Yale University in 2018 with a bachelor’s degree in economics and political science. He is fluent in French and Spanish and proficient in Arabic.
Raksha Kopparam is a research assistant at the Washington Center for Equitable Growth. Prior to joining Equitable Growth, she interned at the Federal Housing Finance Agency, working with its Division of Housing Mission and Goals. In 2018, Kopparam earned her bachelor’s degree in political economy from the University of California, Berkeley.
Acknowledgements
The authors thank Austin Clemens, Dave Evans, and Ed Paisley for their help creating graphics for the report and preparing it for publication, and Heather Boushey for comments and feedback. As always, any mistakes are our own.
References
End Notes
1. Material from this report was included in an issue brief previously published by Equitable Growth. See Greg Leiserson, “Wealth taxation: an introduction to net worth taxes and how one might work in the United States” (Washington: Washington Center for Equitable Growth, 2019).
2. Gabriel Zucman, “Global Wealth Inequality.” Working Paper 25462 (National Bureau of Economic Research, 2019), available at http://gabriel-zucman.eu/files/Zucman2019.pdf; Jesse Bricker and others, “Changes in U.S. Family Finances from 2013 to 2016: Evidence from the Survey of Consumer Finances,” Federal Reserve Bulletin 103 (2017): 1–42, available at https://www.federalreserve.gov/publications/files/scf17.pdf.
3. Organisation for Economic Co-operation and Development, “The Role and Design of Net Wealth Taxes in the OECD” (2018).
4. Organisation for Economic Co-operation and Development, “Revenue Statistics – OECD Countries: Comparative Tables” (2018), available at https://stats.oecd.org/index.aspx?DataSetCode=REV.
5. We set aside, for purposes of this report, questions about the constitutionality of a federal net worth tax.
6. Economists often think of an individual’s education, experience, and other such intangibles as a component of wealth as well, referred to as human capital. However, these types of wealth are typically excluded from statistics on wealth and the base of net worth taxes, and we do not discuss them in detail here.
7. See, for example, the discussion in Jesse Bricker and others, “Measuring Income and Wealth at the Top Using Administrative and Survey Data.” Working Paper 2015-030 (Federal Reserve Board, 2015).
8. For simplicity, these examples exclude consumer durable goods such as home furnishings and personal property. These types of assets are also often eligible for substantial exemptions under net worth taxes for reasons of administrability and simplicity.
9. For a review of the most recent survey results, see Bricker and others, “Changes in U.S. Family Finances from 2013 to 2016.”
10. The estimates from the Survey of Consumer Finances, or SCF, presented in this report are based on the public datasets. The SCF intentionally excludes the Forbes 400—the 400 wealthiest Americans—from the sample. Thus, it is not unusual for users to apply an adjustment for this exclusion in producing estimates. Doing so would increase the amount of wealth in the upper tail and thus wealth inequality as measured by top wealth shares, but would have a modest impact on most statistics presented here.
11. An analysis of the economic incidence of a net worth tax would adjust the statutory incidence of the tax for equilibrium price changes and any other relevant factors. However, in the case of a targeted wealth tax, this shifting is likely modest. Thus, the statutory incidence of the tax is a reasonable guide to the economic incidence.
12. See, for example, Thomas Piketty, Emmanuel Saez, and Gabriel Zucman, “Distributional National Accounts: Methods and Estimates for the United States,” Quarterly Journal of Economics 133 (2) (2018): 553–609; Gerald Auten and David Splinter, “Income Inequality in the United States: Using Tax Data to Measure Long-term Trends.” Working Paper (Joint Committee on Taxation of the U.S. Congress, 2018), available at http://davidsplinter.com/AutenSplinter-Tax_Data_and_Inequality.pdf; Congressional Budget Office, “The Distribution of Household Income, 2015” (2018), available at https://www.cbo.gov/publication/54646.
13. While more recent estimates of aggregate wealth are available in the Financial Accounts, estimates are presented for 2016 for consistency with the estimates based on the Survey of Consumer Finances, for which 2016 is the most recent year for which data available.
14. As with the Financial Accounts of the United States, more recent estimates from the National Income and Product Accounts are available, but we present results for 2016 for consistency with the SCF estimates, for which 2016 is the most recent year for which data available.
15. Bureau of Economic Analysis, “National Income and Product Accounts, Fixed Asset Accounts” (U.S. Department of Commerce, 2018), tables 1.7.5 and 2.1.
16. See, for example, Jacob A. Robbins, “Capital Gains and the Distribution of Income in the United States.” Working Paper (Brown University, 2018), available at https://users.nber.org/~robbinsj/jr_inequ_jmp.pdf.
17. We exclude financial transactions taxes from this list of taxes on wealth under the view that they are most appropriately classified as a targeted excise tax and the taxes considered here are elements of a broader system of taxing wealth or the income from wealth. However, under the OECD’s classifications, taxes on financial and capital transactions are treated as a tax on property, along with estate, inheritance, and gift taxes; net worth taxes, and recurrent taxes on immovable property.
18. EY, “Cross-country Review of Taxes on Wealth and Transfers of Wealth” (2014), available at https://ec.europa.eu/taxation_customs/sites/taxation/files/docs/body/2014_eu_wealth_tax_project_finale_report.pdf.
19. The Norwegian Tax Administration, “What are you liable to pay tax on in Norway?” (2019), available at https://www.skatteetaten.no/en/person/foreign/are-you-intending-to-work-in-norway/the-tax-return/what-are-you-liable-to-pay-tax-on-in-norway/.
20. Steven C. Bourassa, Martin Hoseli, and Donato Scognamiglio, “Housing Finance, Prices, and Tenure in Switzerland,” Journal of Real Estate Literature 10 (2010): 263–282.
21. EY, “Cross-country Review of Taxes on Wealth and Transfers of Wealth.”
22. Organisation for Economic Co-operation and Development, “The Role and Design of Net Wealth Taxes in the OECD.”
23. For an overview of the system, see Deloitte, “Netherlands Tax Highlights 2018” (2018), available at https://www2.deloitte.com/content/dam/Deloitte/global/Documents/Tax/dttl-tax-netherlandshighlights-2018.pdf.
24. OECD, “The Role and Design of Net Wealth Taxes in the OECD.”
25. The Spanish net worth tax is imposed on an individual basis, and each individual is entitled to a $700,000 exemption. The stated exemption is the exemption under national law; autonomous regions can—and do—change the exemption.
26. Norway has an exemption level closer to Switzerland than Spain or France, but generous preferences serve to limit the scope of the tax through other means.
27. See, for example, EY, “Cross-country Review of Taxes on Wealth and Transfers of Wealth.”