Introduction
Household income in the United States became significantly more volatile beginning in the 1970s despite relatively stable overall economic growth during the 1980s.1 Macroeconomists called this period of stable aggregate growth three decades ago “the Great Moderation,” but the term masked the growing unequal distribution of economic growth.2 From 1980 to 2014, average pretax income increased 61 percent while only rising 1 percent for adults in the bottom 50 percent of the income distribution, illustrating how poorly economic growth has been distributed across the U.S. population.3 Indeed, the top 1 percent of adults in 1980 earned 27 times more than the bottom 50 percent of adults on average, but in 2016 the top 1 percent earned 81 times more.4
Download FileHousehold insecurity matters for U.S. economic growth and stability
This report examines the academic literature on rising household insecurity and its effects on overall economic growth and macroeconomic stability. An array of recent research demonstrates that unstable household balance sheets (in concert with the unequal distribution of economic gains) impedes the capacity for strong and stable economic growth. Rising household instability—and thus uncertainty about their future economic positions—contributes to households feeling increasingly insecure. This report then closes with a brief look at the policies that could mitigate household insecurity and help ensure more stable and broad-based economic growth.
Household insecurity and macroeconomic instability
Household economic insecurity may have lasting consequences on broad economic growth and stability. Specifically, greater household levels of income and wealth volatility and uncertainty have implications for the way families choose to consume or save. Consumer demand is a consistently large portion of U.S. aggregate demand, which means that household consumption decisions are key in determining levels of aggregate demand in the economy.5 Indeed, consumption by households has contributed nearly 70 percent of overall Gross Domestic Product over the past decade, making consumption the largest component of GDP.6 And personal consumption was between 65 percent and 69 percent of total U.S. GDP from the first quarter of 2000 to the first quarter of 2013.7 (See Figure 1.)
Figure 1
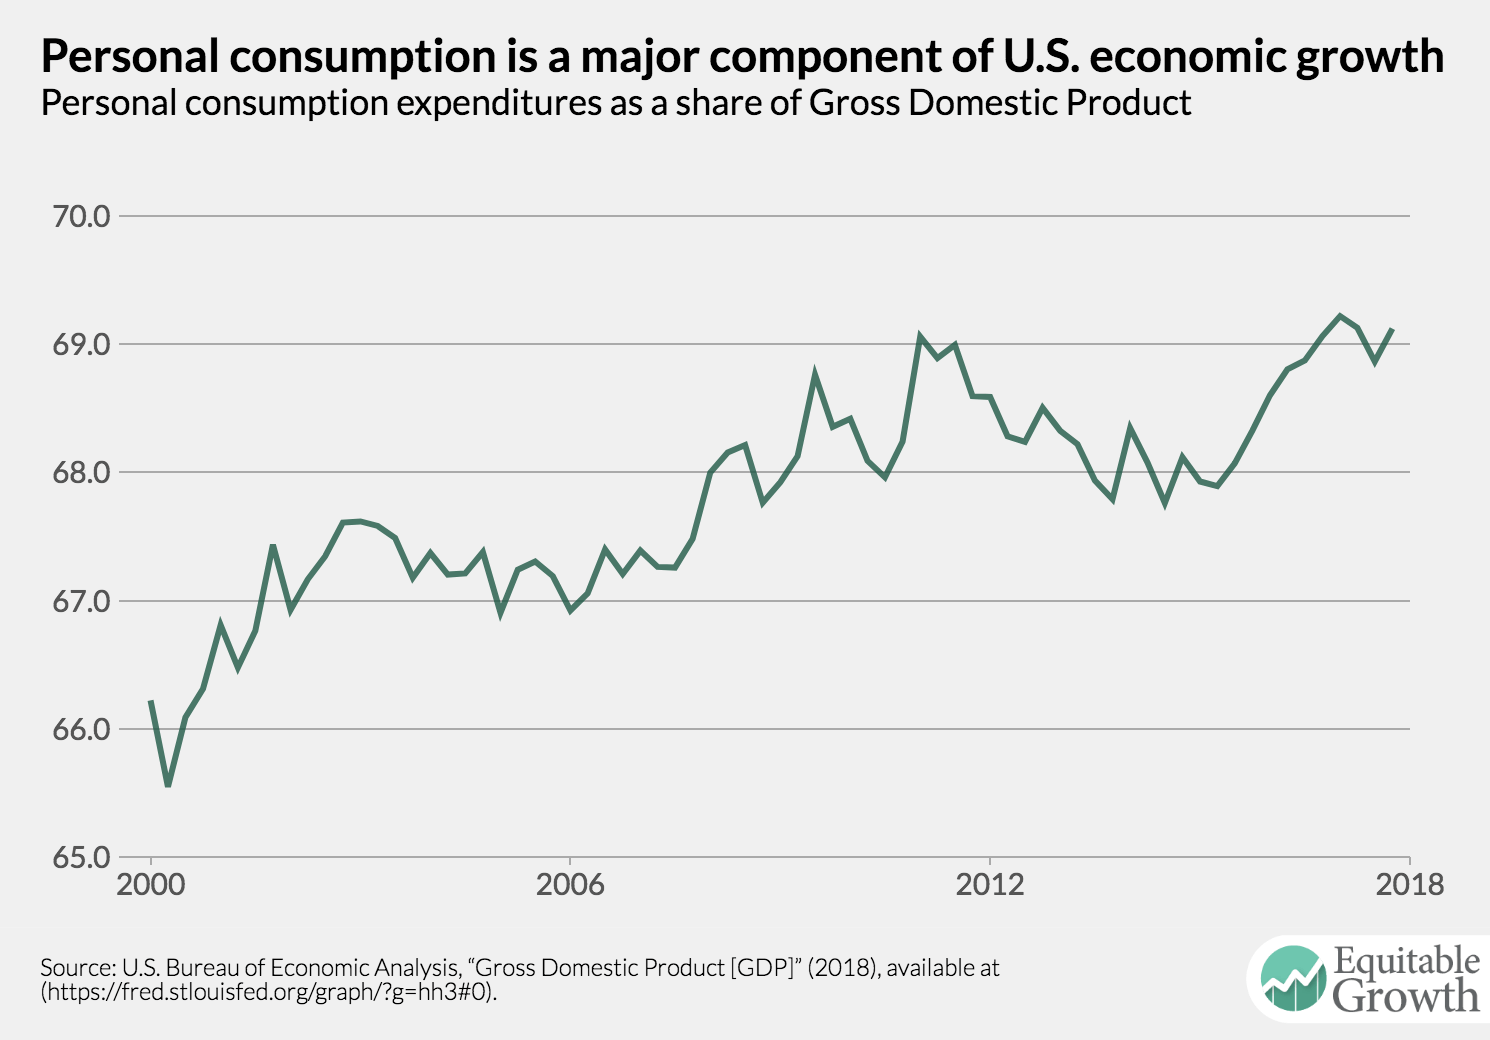
For most families, a stable and predictable income is important to maintaining stable levels of household consumption. Evidence shows that consumer spending is responsive to fluctuations in income.8 Recent research finds that the consumption of nondurable goods such as food and clothing drops immediately after workers lose their jobs—by about 6 percent—stabilizing at that lower level during the time those workers are receiving unemployment insurance as income but falling once again—by about 13 percent—after unemployment insurance is exhausted.9
Digging in on household economic insecurity and instability
“Economic insecurity is perhaps best understood as the intersection between ‘perceived’ and ‘actual’ downside risk,” explains Equitable Growth’s expert on family economic security, Elisabeth Jacobs.10 Economic insecurity is both subjective (“perceived”) and objective (“actual”) in its characterization. At the household level, economic insecurity may be influenced by differences in wealth, access to credit, or family structure. Insecurity rises as exposure to adverse risk increases (the risk of job losses or family illnesses) and is mitigated when protection from adverse risk is expanded (increased insurance or family savings).
The ability for households to protect themselves against economic hardship by minimizing the risk of losing a large supply of economic resources gives them greater economic security. Having a predictable income makes it possible for households to plan for expenses, save or invest, and pay down debts. Although there are many ways to measure the economic security or insecurity of families, scholars have turned to economic volatility as an indicator of “experienced” or “actual” economic insecurity. Income volatility is the most straightforward measure of how the income of a family changes from one period to the next, though volatility of earnings also has been studied.11 Income volatility captures the changes in total household income, which may come from a variety of sources, while earnings volatility only captures the changes in labor income.
For the purposes of measuring household instability, income volatility provides a more complete measure since it takes into account the full scope of resources that are accruing to families rather than only the resources they gain from working. Focusing solely on earnings volatility excludes important sources of income such as capital income and government transfers (cash or in-kind assistance in the form of supplemental nutrition assistance, Social Security income, and other social safety net programs). Both the size and direction of this variation in household income tells us about how a family is doing economically now relative to some period in the past.
Household income volatility is commonly measured as a change in income of 25 percent or more from one year to the next or one month to the next.12 Any household that experiences a gain or drop in income of 25 percent or more from one month to the next or one year to the next is considered to have volatile income. Another common method of measuring income volatility is to calculate the standard deviation as a percent of two-year average income—that is, the dispersion in income from year to year as a percent of average income over two years.13 Experiencing large swings in income leads to unstable levels of household economic resources and thus uncertainty about future economic position.
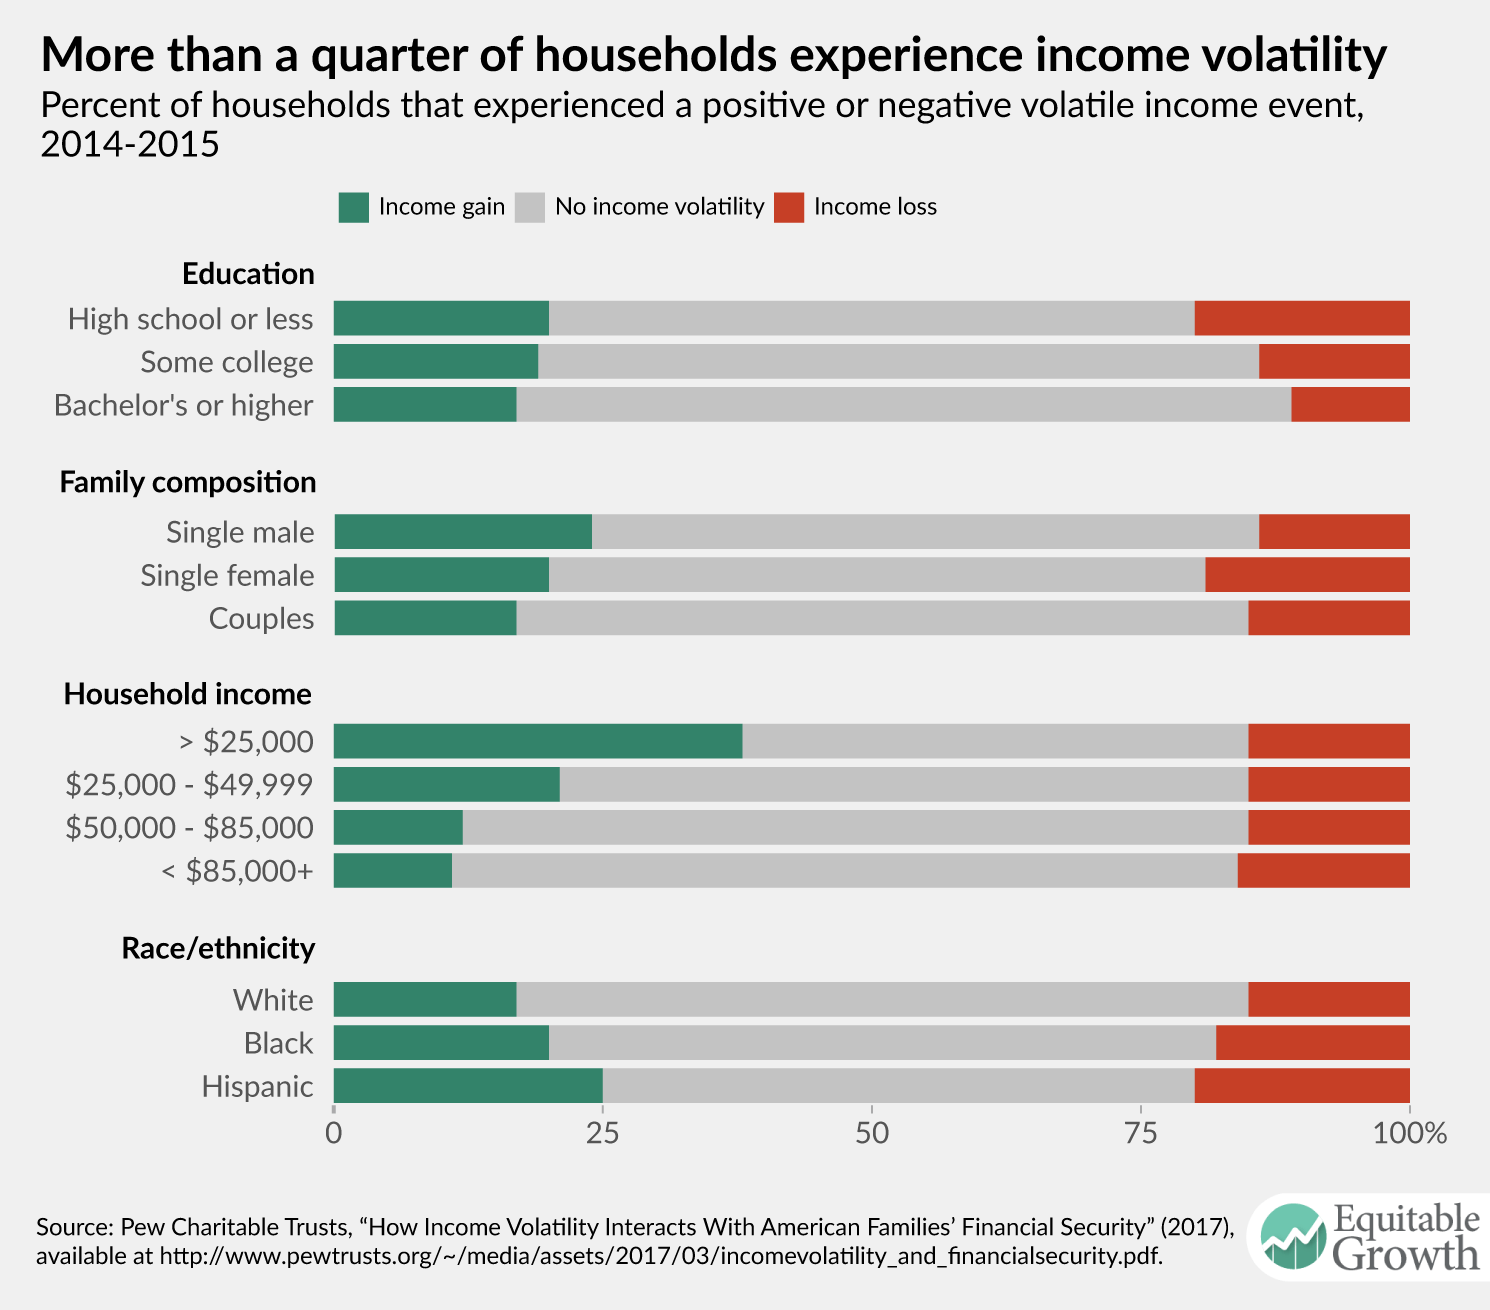
Recent research illustrates that income volatility is a common experience among U.S. adults today. A 2016 Federal Reserve report stated, “Thirty-two percent of adults report that their income varies to some degree from month to month … Forty-two percent of those with volatile incomes or expenses say that they have struggled to pay their bills at times because of this volatility.”14 (See Figure 2.)
Figure 2
Research also shows that earnings volatility is much higher for those in the bottom 25 percent of the earnings distribution than for those in the upper 75 percent,15 although all households across the income distribution experienced greater volatility between 1980 and 2009.16 Indeed, household income volatility has generally been increasing for all types of families by educational group, even higher-income ones that have a college-educated head of household. (See Figure 3.)
Figure 3
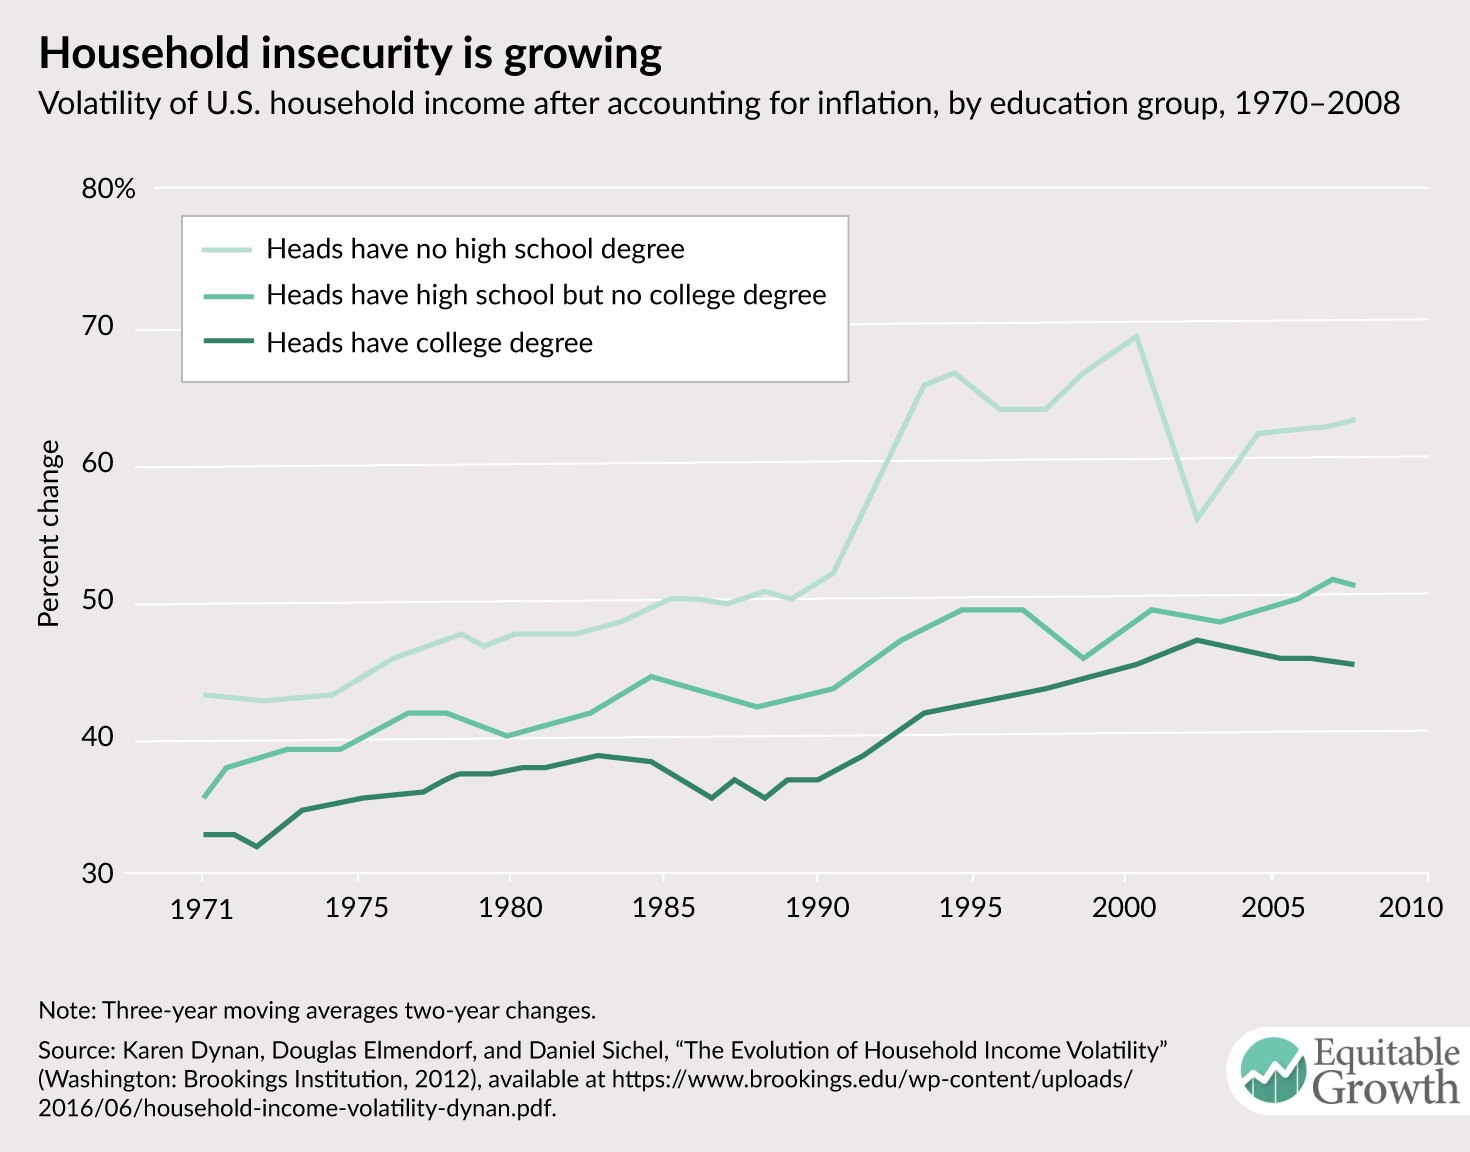
Figure 3 charts household volatility until the end of the past decade, but the overall trend of rising income volatility since the 1970s is well-documented.17 Karen Dynan, an economics professor at Harvard University and former chief economist at the U.S. Department of the Treasury, and her co-authors document a steady increase in income volatility over “the past several decades,” with increases for every main age and educational group.18 Bradley Hardy of American University and James Ziliak of the University of Kentucky found a similarly strong rise in household income volatility, peaking in 2001 and flattening thereafter.19 They found that from 1980 to 2009, households with positive income saw an increase in income volatility of about 78 percent on average.20
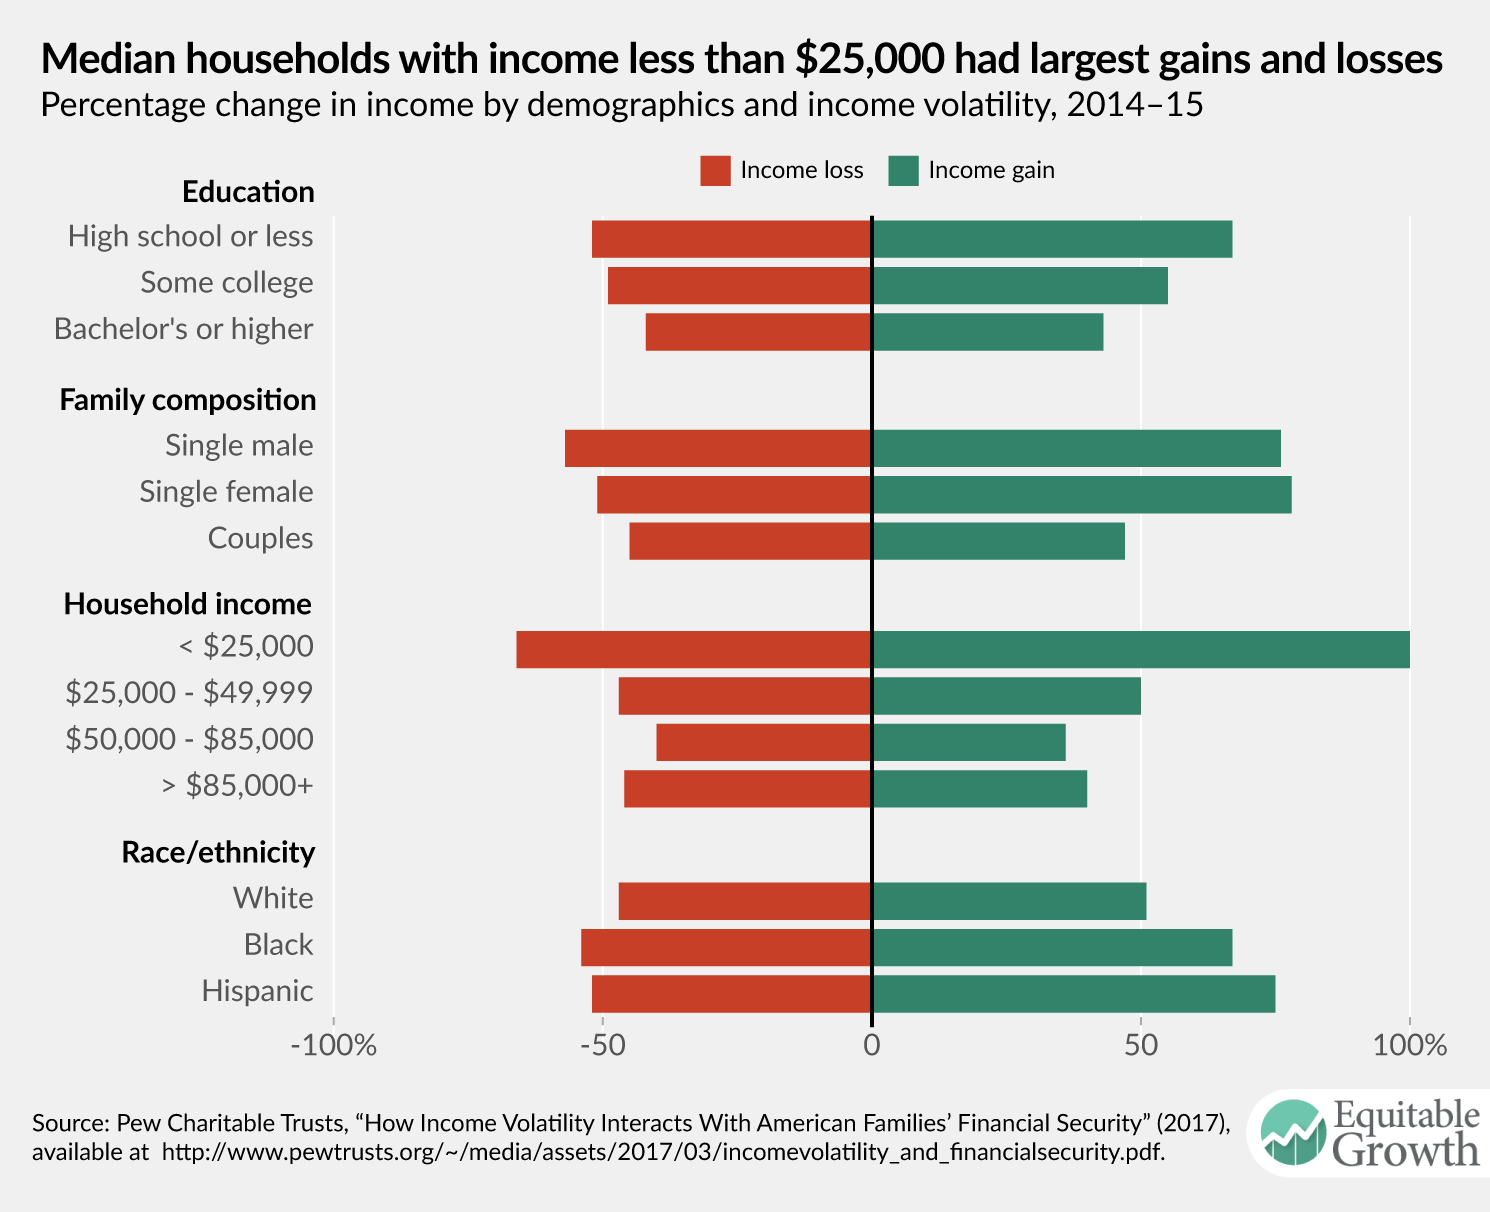
Moreover, Robert Moffitt of Johns Hopkins University and Peter Gottschalk of Boston College found that household earnings instability, which they measure as transitory variance, rose slightly in the 1970s, flattened, and then rose sharply in the mid-1980s through the early-2000s for all groups across the earnings distribution.21 Recent data show how much income fluctuation the typical household experienced from 2014 to 2015 across demographic groups, with the largest swings in household income among low-income households and single female-headed households. (See Figure 4.)
Figure 4
Why has U.S. household income volatility increased over time?
Why is it that household income volatility has increased so dramatically over the past several decades? The key drivers of household income volatility include factors that increase risk exposure such as:
- Changes in the labor market
- Credit market dynamics
- Changes in savings rates
This issue brief will examine each of these factors in turn, alongside other factors that mitigate exposure to risk such as automatic stabilizers—for example, unemployment insurance and other social insurance programs, as well as savings and accumulated wealth.
Changes in the labor market
Labor income is the largest source of total household income for low- and middle-income households.22 Labor market dynamics thus impact household income profiles for all working families and the vast majority of U.S. households. The trends in volatility of men’s labor income have largely followed the patterns we see in overall income volatility over the past few decades. Evidence shows that men’s earnings volatility increased during the 1970s and stabilized until the 1990s, when volatility appears to increase once again into the 21st century.23 Women’s earnings volatility, however, decreased during the same period, effectively “cancelling out” or offsetting some of the trend in men’s rising earnings volatility.24 Still, men’s increasing earnings volatility is an important driver of overall U.S. household volatility because men earn more than women on average.25
Earnings and income insecurity in turn may influence aggregate economic demand when volatility affects household consumption and savings behavior. One way that economists try to understand the connection between household income and consumption and aggregate economic demand is via economic theory. The permanent income hypothesis is a theory that posits people will optimize their consumption over their lifetimes based on their own estimated lifetime income by, on average, saving while they earn more in order to be able to spend while they earn less than estimated.26 According to Tullio Jappelli of the University of Naples Federico II and Luigi Pistaferr of Stanford University, three influencial economists writing in the 1950s—Franco Modigliani, Richard Brumberg, and Milton Friedman—“celebrated life-cycle and permanent income models that posit people use savings to smooth income fluctuations, and that they should respond little if at all to changes in income that are anticipated.”27 This theory leads one to believe that consumption should not respond to anticipated changes in income but should respond to unanticipated changes in income.28
Yet more recent empirical work finds that households do respond to anticipated increases in income by reducing consumption above what a standard consumption smoothing model would suggest.29 In other words, changes in consumption not only respond to changes in preferences (driven by age or family structure for example) and changes in permanent income, but also to transitory or temporary income fluctuations. In addition, other evidence-based research finds that household consumption changes due to permanent and transitory shocks to income, suggesting that consumer behavior is not consistent with the permanent income hypothesis.30
Alternatively, “hand-to-mouth” models posit that household consumption is strongly affected by changes in income. John Campbell and Gregory Mankiw of Harvard University estimated that “when income is expected to rise by 1 percent, consumption should be expected to rise by 0.5 percent.”31 This model suggests that aggregate consumption would fluctuate depending on how the “hand-to-mouth” consumers’ incomes change over time.32 This research suggests that aggressive fiscal or monetary policies can be effective in offsetting low consumer demand by creating demand through public spending or lowering interest rates, but there are limits to these tools. Efforts to increase aggregate demand in the economy, for example, may be unable to offset changes in aggregate consumption if interest rates are constrained by the zero lower bound of rates or expansionary fiscal policy is constrained by politics.33
Consumption and savings behavior also differ by household-level characteristics. An important concept to understand when thinking about consumption versus saving is the marginal propensity to consume. This is the portion of an extra dollar of income that a household will spend rather than save. Evidence shows that variations in marginal propensities to consume exist among households with different wealth levels.34 Indeed, poor households have a higher marginal propensity to consume, and conversely richer households have a higher marginal propensity to save.35 For every additional 1 percent shift in income from the bottom 90 percent of households to the top 10 percent of households, aggregate consumption slightly decreases by about 0.1 percent.36
How, then, do changes in household earnings and income translate into changes in consumption? Well, the coinciding changes in the structure of work with upward trends in household income volatility suggest that, together, these shifts make it difficult for families to smooth their consumption.
Jonathan Heathcote of the Federal Reserve Bank of Minneapolis and his co-authors estimate that approximately 60 percent of typical wage fluctuations are effectively smoothed, while the other 40 percent are passed through to household consumption.37 This smoothing can occur in many ways, including through changes in labor supply (adjusting hours worked), progressive taxation, social insurance, and family and network support.38 Evidence shows that both hours worked and earnings per hour have become more variable since the 1970s, which together contribute to the rise in household income insecurity and the inability of many households to smooth consumption.39
A look at income volatility over the past several decades reveals why household balance sheets are now more volatile. The standard deviation, or dispersion, of hours worked by heads of households rose 30 percent between 1971 and 2008, compared to a 28 percent rise in the dispersion of earnings per hour. These changes in hours worked and wage rates can be either involuntary or voluntary. Earnings may fluctuate for many reasons either voluntary or involuntary such as a job change or loss, turnover, taking paid or unpaid leave, a change in the minimum wage or regulation, or a pay raise. Hours worked may vary voluntarily if, for example, an employee makes the choice to switch from full-time to part-time work, or involuntarily if his or her employer has control over scheduling his or her work hours and makes adjustments on a weekly or bi-weekly basis. Approximately 90 percent of hourly retail workers experience variable hours as a result of unstable scheduling practices on the part of employers.40 Other recent research supports the hypothesis that variable hours have negative consequences on household financial security, worker health, and well-being.41 This diminished certainty in hours created by unpredictable and unstable scheduling practices further complicates household consumption smoothing.
In addition, the recent body of work around the “fissured workplace”—a phenomenon characterized by a rise in alternative and nonstandard work arrangements where workers provide labor through intermediaries—may be another factor in rising earnings volatility.42 Nonstandard and alternative work arrangements, which include temporary work, contracting, on-call working, and freelancing, have grown from 10.7 percent of workers in early 2005 to 15.8 percent in late 2015.43 Workers engaged in these types of labor have fewer protections from earnings volatility and uncertainty: Their hours and earnings are unstable, and they are not eligible for unemployment insurance or other benefits that standard full-time employees receive.44
Earnings volatility is not only influenced by how many hours one works or what kind of job one holds, but also by the type of firm for which one works. Research that investigates the rise in inequality at the firm level suggests that inequality in earnings is driven by an increased dispersion in earnings between firms rather than within firms.45 In fact, almost all of the rise in earnings inequality since 1982 can be explained by the variance in earnings between firms.46 Earnings dispersion between firms is rising, while earnings within firms is relatively stable, which indicates that the rise in earnings inequality is mainly driven by the differences between firms.
Moreover, employee segregation—the clustering of high-wage and low-wage employees into different firms—is driving this increase in between-firm inequality.47 This trend in the growing dispersion of wages between firms, along with the break-up of firms to isolate core business functions from other portions of the firm, are forms of fissuring that increase the risk of earnings volatility, weaken protections for workers, and contribute to the increase in household income volatility.48
Credit market dynamics
Credit access is one mechanism that may allow households to smooth their consumption while experiencing income volatility. It allows for families to borrow now for expenses in the short term and pay for them in the future when they have a higher level of income. But at the household level, too much credit availability may have negative consequences. There is evidence that credit can be used as a cushion to smooth consumption, but also that credit directed toward debt may amplify macroeconomic business cycles.
Recent research demonstrates that when the unemployed have the ability to take out more revolving credit they are able to search for a new job longer and as a result find a better job match.49 Recent studies also show that lifting credit constraints on displaced workers to increase their credit limit by 10 percent of their prior annual earnings allows individuals to take 0.15 weeks to 3 weeks longer to find a job—and when they do find work, they receive higher earnings and work at more productive firms.50 These findings suggest that credit access for those with high levels of credit constraints and low access can help workers attain better labor market outcomes. All else being equal, these outcomes in the labor market increase productivity and overall economic output to help sustain strong economic growth.
But all things are rarely equal. Recent research also finds that while increasing access to credit has led to stronger economic expansion by boosting local demand, it did not necessarily flow into productivity-enhancing investments, thus contributing to stronger economic downturns.51 Productivity enhancing investments include things such as education or training, research and development, and new technologies, whereas household debt does not increase production. Emerging research points to this “credit-driven household demand channel,” or the expansion of credit supply in response to household demand, as an important driver of business cycles.52 The fact that credit expansion driven by household demand and used for nonproductive investments can amplify business cycles is concerning for overall economic performance and stability.
Changes in savings rates
An important pathway through which income volatility affects consumption is the precautionary saving channel. Policymakers and economists alike learned from the large decline in net wealth following the Great Recession that wealth-poor households increase savings more sharply than richer households during economic downturns.53 Although the behavioral response to cut back on consumption and increase savings is more dramatic for low-income households, richer households take part in precautionary savings as well. Since this tool is used across all household types to protect themselves from economic hardship, it has large and lasting implications for the economy overall.54
Economists Atif Mian at Princeton University and Amir Sufi at the Unicersity of Chicago and data scientist Kamalesh Rao show that during the Great Recession, risks were not being shared by all U.S. homeowners, creating variable insecurity among households that led to large responses in consumption for wealth-poor and indebted households.55 This precautionary saving dampens consumption patterns across the income spectrum.56
Increasing wealth inequality in the United States since 1978 may have important implications for the magnitude of the precautionary savings response.57 The decline in the wealth share of the bottom 90 percent of U.S. families since the 1980s suggests that a larger response in precautionary savings overall during economic downturns is more expected today than prior to the rise in wealth inequality. In other words, if the bottom 90 percent had maintained the same share of total wealth over the past 40 years, then an economic downturn would elicit a weaker response in increased precautionary savings. The loss of wealth among the bottom 90 percent of households also suggests that savings rates in general have diverged, with the bottom 90 percent losing part of its personal safety net in wealth relative to prior generations and contributing to an inability for the majority of households to use accumulated wealth to smooth consumption.58
Automatic stabilizers and social insurance
In the absence of stable earnings and employment for a growing number of U.S. households, public assistance programs can serve as automatic stabilizers to help maintain aggregate consumer demand and more broadly less volatile economic growth. Social insurance programs such as unemployment insurance and supplemental nutrition assistance fill in the gaps when household income is not sufficient to meet basic needs. These programs act as a form of public credit, helping to prop up demand for goods and services when the economy is performing poorly. In this regard, they serve as an automatic stabilizer by increasing available economic resources to families during economic downturns and stabilizing aggregate demand.
One of the most prominent automatic stabilizers used to protect against the risk of unemployment is unemployment insurance, which aims to ameliorate the effects of lost income due to unemployment. Evidence shows that unemployment insurance acts as a moderate stabilizer by mitigating some of the effects of unemployment and partially propping up consumer spending.59 But once unemployment insurance benefits run out, the rest of the social safety net fails to make up for the loss of income, leading to large drops in consumption of about 13 percent.60 In effect, once unemployment insurance benefits expire, the remaining safety net replaces only a small portion of lost income.
Importantly, though, other recent empirical work shows that unemployment insurance is effective in its role as an automatic stabilizer and is key in smoothing consumption during labor market shocks. Unemployment insurance reduces the effects of adverse shocks to earnings by allowing households to continue to receive income for a few weeks after being laid off and search for a new job. Indeed, every dollar of unemployment insurance increases the consumption of nondurable goods and services (such as groceries and utility bills) by 38 cents.61 Unemployment benefits also contribute to aggregate demand at the local level with a fiscal multiplier of 1.9, meaning that every dollar that households receive as unemployment insurance and is spent in the local economy creates nearly two dollars of demand, doubling the value of investments in unemployment insurance.62
Another large automatic stabilizer in the United States is the Supplemental Nutrition Assistance Program, which provides low-income households with vouchers to buy food. Since there are means-based eligibility rules to qualify for these benefits, the levels of benefits allocated is correlated with the incomes of families at the bottom of the income distribution. Research shows that families increase their overall spending on food when supplemental nutrition assistance is available to them and that the marginal propensity to consume out of these benefits is similar to the marginal propensity to consume out of cash income.63
Automatic stabilizers and social insurance are effective tools in helping to stabilize business cycles. It’s estimated that automatic stabilizers mitigate negative demand shocks by approximately 20 percent after 2 years.64 These tools, however, are no longer as effective as they once were. Research suggests that cash welfare programs are playing a less and less significant role as a countercyclical source of income, though the Supplemental Nutrition Assistance Program plays an increasingly important one.65 One explanation for this change is that in recent years, policies have weakened the U.S. economy’s automatic stabilizers and social insurance programs. According to Joseph Stiglitz of Columbia University, “The reductions in the progressivity of the income tax system, the shift of pension plans from defined benefit to defined contribution systems, and the broader undermining of social protections” have made “the economy more vulnerable to shocks.”66
Indeed, Medicaid programs—which are paid for in part by state governments, as well as the federal government—have recently fallen short during recessionary periods, impeding economic growth and stability.67 State governments must balance their budgets and oftentimes cut spending during an economic downturn to the detriment of social insurance programs such as Medicaid.68 More work on how these changes to social insurance have contributed to household instability would help us better understand the tools we can use to manage macroeconomic fluctuations.
Why should policymakers care about household insecurity?
Maintaining stable consumer demand is important for stable economic growth overall, which is a key driver of economic well-being. And public policies can either help stabilize or destabilize consumer demand in profound ways. Unfortunately, policies that aim to stabilize consumer demand have been weakened over the past several decades.
One key contributor to household insecurity is rising labor market volatility, which carries over into the economic lives of families. Antiquated labor laws and regulations have failed to keep pace with the rapidly evolving structure of work. The increase in nonstandard work arrangements and nontraditional work schedules creates uncertainty around work hours and earnings for an increasing share of the U.S. workforce. And the increase in women’s labor force participation over the past half-century has created additional household income volatility around the birth of a child or for caregiving.69
Another contributor to household instability is a lack of tools and resources that families can tap into during periods of economic hardship. The lack of both opportunities to build private wealth and social insurance protections to stabilize demand during economic downturns has hindered economic growth and stability. The devastation of the Great Recession exhibited the consequence of unstable demand and poor public policy protections to combat persistent economic downturns.
In order to help increase household security and support stable economic growth, policymakers, communities, and firms must look for remedies both to promote access to stable economic resources and to minimize risk. In the U.S. labor market, solutions that add security and certainty to earnings such as predictable scheduling practices can help stabilize earned income.70 Policies that support strong labor force participation and wage growth such as paid family and medical leave or minimum wage raises can not only increase household economic stability in the short term but also promote labor force attachment and long-term household stability.71
Then there are policies that encourage asset building and wealth accumulation, which are important to developing individual household safety nets and overall household economic stability. Increasing access to retirement and health savings programs, for example, could be an important step in promoting wealth accumulation, as well as economic security and stability. Strengthening automatic stabilizers and enhancing social insurance programs to mitigate the effects of economic downturns and reduce downside risk for families are effective tools in stabilizing consumer demand and supporting overall economic well-being. Increasing federal financing of social insurance programs such as Medicaid automatically during recessionary periods could alleviate state budgets and provide countercyclical benefits.72
Recent research provides direction for creating strong, stable consumer demand in the economy. By focusing on household stability over time rather than snapshots of well-being at one point in time, economists and other social scientists are able to better understand how to support more stable macroeconomic growth. The increasingly common experience of household economic instability and uncertainty along with the unequal distribution of economic gains in the United States hampers economic growth and can lead to amplified business cycle fluctuations. By focusing on the goals of reducing economic insecurity by mitigating household instability, policymakers and employers could help to create greater macroeconomic stability for all.
End Notes
1. Karen Dynan, Douglas Elmendorf, and Daniel Sichel, “The Evolution of Household Income Volatility” (Washington: Brookings Institution, 2012), available at https://www.brookings.edu/wp-content/uploads/2016/06/household-income-volatility-dynan.pdf.
2. Thomas Piketty, Emmanuel Saez, and Gabriel Zucman, “Distributional National Accounts: Methods and Estimates for the United States.” Working Paper (National Bureau of Economic Research, 2016), available at https://eml.berkeley.edu/~saez/Piketty-Saez-ZucmanNBER16.pdf.
3. Piketty, Saez, and Zucman, “Distributional National Accounts: Methods and Estimates for the United States.”
4. Piketty, Saez, and Zucman, “Distributional National Accounts: Methods and Estimates for the United States.”
5. Atif Mian, and Amir Sufi, “What Explains High Unemployment? The Aggregate Demand Channel.” Working Paper No. 17830 (National Bureau of Economic Research, 2012), available at http://www.nber.org/papers/w17830.
6. U.S. Bureau of Economic Analysis, “Gross Domestic Product (GDP)” (2018), available at https://fred.stlouisfed.org/graph/?g=hh3#0.
7. U.S. Bureau of Economic Analysis, “Gross Domestic Product (GDP).”
8. Nicholas Souleles, “The Response of Household Consumption to Income Tax Refunds” American Economic Review 8 (4) (1999): 947–58.
9. Peter Ganong and Pascal Noel, “Consumer Spending During Unemployment: Positive and Normative Implications.” Working Paper (Harvard University, 2017), available at https://scholar.harvard.edu/ganong/publications/how-does-unemployment-affect-consumer-spending-job-market-paper.
10. Elisabeth Jacobs, “Family Economic Insecurity in the United States,” Ph.D. dissertation, Harvard University, 2008.
11. Jacob Hacker and others, “The Economic Security Index: A New Measure for Research and Policy Analysis” Working Paper (Federal Reserve Bank of San Francisco, 2012), available at http://www.frbsf.org/economic-research/files/wp12-21bk.pdf.
12. See, for example, Molly Dahl, Thomas DeLeire, and Jonathan A. Schwabish, “Estimates of Year-to-Year Volatility in Earnings and in Household Incomes from Administrative, Survey, and Matched Data” Journal of Human Resources 46 (4) (2011): 750–74, available at https://doi.org/10.1353/jhr.2011.0000.
13. See, for example, Dynan, Elmendorf, and Sichel, “The Evolution of Household Income Volatility.”
14. Board of Governors of the Federal Reserve System, “Report on the Economic Well-Being of U.S. Households in 2015” (2016), available at https://www.federalreserve.gov/2015-report-economic-well-being-us-households-201605.pdf.
15. Peter Gottschalk and Robert Moffitt, “The Growth of Earnings Instability in the U.S. Labor Market” (Washington: Brookings Institution, 1994), available at https://www.brookings.edu/wp-content/uploads/1994/06/1994b_bpea_gottschalk_moffitt_katz_dickens.pdf.
16. Bradley Hardy and James P. Ziliak, “Decomposing Trends in Income Volatility: The ‘Wild Ride’ at the Top and Bottom” Economic Inquiry 52 (1) (2014): 459–76, available at https://doi.org/10.1111/ecin.12044.
17. See Dahl, DeLeire, and Schwabish, “Estimates of Year-to-Year Volatility in Earnings and in Household Incomes from Administrative, Survey, and Matched Data”; Gottschalk and Moffitt, “The Growth of Earnings Instability in the U.S. Labor Market”; Dynan, Elmendorf, and Sichel, “The Evolution of Household Income Volatility.”
18. Dynan, Elmendorf, and Sichel, “The Evolution of Household Income Volatility.”
19. Hardy and Ziliak, “Decomposing Trends in Income Volatility: The ‘Wild Ride’ at the Top and Bottom” Working Paper 43 (University of Kentucky Center for Poverty Research, 2012), available at https://uknowledge.uky.edu/ukcpr_papers/43.
20. Hardy and Ziliak, “Decomposing Trends in Income Volatility: The ‘Wild Ride’ at the Top and Bottom.”
21. Robert A. Moffitt and Peter Gottschalk, “Trends in the Transitory Variance Of Earnings In The United States” The Economic Journal 112 (478) (2002): C68–73, available at https://doi.org/10.1111/1468-0297.00025. Transitory variance is a measure of temporary changes in income (as opposed to permanent changes in income). For discussion, see Gottschalk and Moffitt, “The Growth of Earnings Instability in the U.S. Labor Market.”
22. U.S. Department of the Treasury, “Distribution of Income by Source” (2017), available at https://www.treasury.gov/resource-center/tax-policy/Pages/Tax-Analysis-and-Research.aspx; Thomas Piketty and Emmanuel Saez, “Income Inequality in the United States, 1913–1998” The Quarterly Journal of Economics 118 (1) (2003): 1–39, available at https://eml.berkeley.edu/~saez/pikettyqje.pdf.
23. Donggyun Shin and Gary Solon, “Trends in Men’s Earnings Volatility: What Does the Panel Study of Income Dynamics Show?” Journal of Public Economics 95 (7) (2011): 973–82, available at http://www.nber.org/papers/w14075.pdf.
24. Dynan, Elmendorf, and Sichel, “The Evolution of Household Income Volatility.”
25. Recent declines in female labor force participation rates may have even more important implications for household income volatility moving forward. See, for example, Sandra Black, Diane Schanzenbach, and Audrey Breitwieser, “The Recent Decline in Women’s Labor Force Participation” (Washington: The Hamilton Project, 2017), available at https://www.brookings.edu/wp-content/uploads/2017/10/es_10192017_decline_womens_labor_force_participation_blackschanzenbach.pdf.
26. Milton Friedman, “The Permanent Income Hypothesis.” In A Theory of the Consumption Function (Princeton, NJ: Princeton University Press, 1957), available at http://www.nber.org/chapters/c4405.
27. Tullio Jappelli and Luigi Pistaferri, “The Consumption Response to Income Changes” Annual Review of Economics 2 (2010): 479–506, available at https://doi.org/10.1146/annurev.economics.050708.142933.
28. Jappelli and Pistaferri, “The Consumption Response to Income Changes”; Costas Meghir, “A Retrospective on Friedman’s Theory of Permanent Income*: Friedman’s Theory of Permanent Income” The Economic Journal 114 (496) (2004): F293–306, available at https://doi.org/10.1111/j.1468-0297.2004.00223.x.
29. Jappelli and Pistaferri, “The Consumption Response to Income Changes.”
30. Jappelli and Pistaferri, “The Consumption Response to Income Changes”; Melvin Stephens, “The Consumption Response to Predictable Changes in Discretionary Income: Evidence from the Repayment of Vehicle Loans” The Review of Economics and Statistics 90 (2) (2008): 241–52.
31. John Y.Campbell and N. Gregory Mankiw, “Consumption, Income, and Interest Rates: Reinterpreting the Time Series Evidence” NBER Macroeconomics Annual 4 (1989): 185–216, available at https://doi.org/10.1086/654107.
32. Greg Kaplan, Giovanni Violante, and Justin Weidner, “The Wealthy Hand-to-Mouth.” Working Paper (Brookings Institution, 2014), available at http://www.brookings.edu/~/media/projects/bpea/spring-2014/2014a_kaplan.pdf.
33. Interest rates are constrained by the zero lower bound (at least historically). When short-term interest rates are near the zero lower bound, policymakers run into problems (or constraints) because they are not able to push the interest rate below zero in order to stimulate the economy.
34. Atif Mian, Kamalesh Rao, and Amir Sufi, “Household Balance Sheets, Consumption, and the Economic Slump” The Quarterly Journal of Economics 128 (4) (2013): 1687–1726, available at https://www.ucl.ac.uk/economics/non-seminar/macrodynamics/mian.pdf.
35. Karen Dynan, Jonathan Skinner, and Stephen Zeldes, “Do the Rich Save More?” Journal of Political Economy 112 (2) (2004), available at https://www.dartmouth.edu/~jskinner/documents/DynanKEDotheRich.pdf.
36. Adrien Auclert and Matthew Rognlie, “Inequality and Aggregate Demand.” Working Paper (Washington Center for Equitable Growth, 2016), available at http://equitablegrowth.org/wp-content/uploads/2018/02/02192018-WP-inequality-aggregate-demand.pdf.
37. Jonathan Heathcote, Kjetil Storesletten, and Giovanni L. Violante, “Consumption and Labor Supply with Partial Insurance: An Analytical Framework” American Economic Review 104 (7) (2014): 2075–2126, available at https://doi.org/10.1257/aer.104.7.2075.
38. Heathcote, Storesletten, and Violante, “Consumption and Labor Supply with Partial Insurance: An Analytical Framework.”
39. Dynan, Elmendorf, and Sichel, “The Evolution of Household Income Volatility.”
40. Susan Lambert, Peter Fugiel, and Julia Henly, “Precarious Work Schedules among Early-Career Employees in the US: A National Snapshot” (Chicago: Employment Instability, Family Well-Being, and Social Policy Network at the University of Chicago, 2014), available at https://ssascholars.uchicago.edu/sites/default/files/work-scheduling-study/files/lambert.fugiel.henly_.precarious_work_schedules.august2014_0.pdf.
41. Daniel Schneider and Kristen Harknett, “Schedule Instability and Unpredictability and Worker and Family Health and Wellbeing.” Working Paper (Washington Center for Equitable Growth, 2016), available at http://equitablegrowth.org/working-papers/schedule-instability-and-unpredictability/.
42. David Weil, The Fissured Workplace: Why Work Became So Bad for So Many and What Can Be Done to Improve It (Cambridge, MA: Harvard University Press, 2014).
43. Lawrence F. Katz and Alan B. Krueger, “The Rise and Nature of Alternative Work Arrangements in the United States, 1995-2015.” Working Paper (Princeton University Department of Economics, 2016), available at http://dataspace.princeton.edu/jspui/bitstream/88435/dsp01zs25xb933/3/603.pdf.
44. U.S. Government Accountability Office, “CONTINGENT WORKFORCE: Size, Characteristics, Earnings, and Benefits” (2015), available at https://www.gao.gov/products/GAO-15-168R.
45. Jae Song and others, “Firming Up Inequality.” Working Paper (National Bureau of Economic Research, 2015), available at http://www.nber.org/papers/w21199.
46. Jae Song and others, “Firming Up Inequality.”
47. Jae Song and others, “Firming Up Inequality.”
48. Virginia Anderson and others, “Addressing Income Volatility of Low Income Populations” (Madison, WI: Robert M. La Follette School of Public Affairs at the University of Wisconsin-Madison, 2015), available at http://www.lafollette.wisc.edu/images/publications/workshops/2015-income.pdf.
49. Kyle Herkenhoff, Gordon Phillips, and Ethan Cohen-Cole, “How Credit Constraints Impact Job Finding Rates, Sorting & Aggregate Output.” Working Paper (National Bureau of Economic Research, 2016), available at http://www.nber.org/papers/w22274.
50. Herkenhoff, Phillips, and Cohen-Cole, “How Credit Constraints Impact Job Finding Rates, Sorting & Aggregate Output.”
51. Atif Mian, Amir Sufi, and Emil Verner, “How Do Credit Supply Shocks Affect the Real Economy? Evidence from the United States in the 1980s” (Rochester, NY: Social Science Research Network, 2017), available at https://papers.ssrn.com/sol3/papers.cfm?abstract_id=2971086.
52. Atif Mian and Amir Sufi, “Finance and Business Cycles: The Credit-Driven Household Demand Channel.” Working Paper (National Bureau of Economic Research, 2018), available at http://www.nber.org/papers/w24322.
53. Mian, Rao, and Sufi, “Household Balance Sheets, Consumption, and the Economic Slump.”
54. Mian, Rao, and Sufi, “Household Balance Sheets, Consumption, and the Economic Slump.”
55. Mian, Rao, and Sufi, “Household Balance Sheets, Consumption, and the Economic Slump.”
56. Jonathan Heathcote and Fabrizio Perri, “Wealth and Volatility” (Minneapolis, MN: Federal Reserve Bank of Minneapolis, 2017), available at https://doi.org/10.21034/sr.508.
57. Emmanuel Saez and Gabriel Zucman, “Wealth Inequality in the United States since 1913: Evidence from Capitalized Income Tax Data” Working Paper 20625 (National Bureau of Economic Research, 2014), available at http://www.nber.org/papers/w20625.
58. Saez and Zucman, “Wealth Inequality in the United States since 1913: Evidence from Capitalized Income Tax Data.”
59. Jesse Rothstein and Robert G. Valletta, “Scraping By: Income and Program Participation After the Loss of Extended Unemployment Benefits.” Working Paper (Federal Reserve Bank of San Francisco, 2017), available at https://www.frbsf.org/economic-research/files/wp2014-06.pdf.
60. Rothstein and Valletta, “Scraping By: Income and Program Participation After the Loss of Extended Unemployment Benefits”; Ganong and Noel, “Consumer Spending During Unemployment: Positive and Normative Implications.”
61. Ganong and Noel, “Consumer Spending During Unemployment: Positive and Normative Implications.”
62. Marco DiMaggio and Amir Kermani, “The Importance of Unemployment Insurance as an Automatic Stabilizer.” Working Paper 22625 (National Bureau of Economic Research, 2016), available at http://www.nber.org/papers/w22625.pdf.
63. Hilary W. Hoynes and Diane Whitmore Schanzenbach, “Consumption Responses to In-Kind Transfers: Evidence from the Introduction of the Food Stamp Program” American Economic Journal: Applied Economics 1 (4) (2009): 109–39, available at https://doi.org/10.1257/app.1.4.109.
64. Byron F. Lutz and Glenn R. Follette, “Fiscal Policy in the United States: Automatic Stabilizers, Discretionary Fiscal Policy Actions, and the Economy” SSRN Electronic Journal (2010), available at https://doi.org/10.2139/ssrn.1684810.
65. Marianne Bitler and Hilary Hoynes, “The More Things Change, the More They Stay the Same? The Safety Net and Poverty in the Great Recession” Journal of Labor Economics 34 (S1) (2016): S403–44, available at https://gspp.berkeley.edu/assets/uploads/research/pdf/Bitler-Hoynes-JOLE-2016.pdf.
66. Joseph Stiglitz, “Macroeconomic Fluctuations, Inequality, and Human Development” Journal of Human Development and Capabilities (2012), available at https://academiccommons.columbia.edu/catalog/ac:157959. A progressive tax system itself acts as an automatic stabilizer during recessions, putting more cash benefits into the pockets of lower-income individuals. But the lump sum annual tax return can make it difficult for families to make big purchases at any point during the year and can lead to deferred consumption of goods and services. See, for example, Mathias Dolls, Clemens Fuest, and Andreas Peichl, “Automatic Stabilization and Discretionary Fiscal Policy in the Financial Crisis” IZA Journal of Labor Policy 1 (2012): 4, available at https://doi.org/10.1186/2193-9004-1-4.
67. Gabriel Chodorow-Reich and others, “Does State Fiscal Relief During Recessions Increase Employment? Evidence Form the American Recovery and Reinvestment Act” American Economic Journal: Economic Policy 4 (3) (2012): 118–45, available at https://scholar.harvard.edu/files/chodorow-reich/files/does_state_fiscal_relief_during_recessions_increase_employment.pdf.
68. Chodorow-Reich and others, “Does State Fiscal Relief During Recessions Increase Employment? Evidence Form the American Recovery and Reinvestment Act.”
69. Alexandra B. Stanczyk, “The Dynamics of Household Economic Circumstances Around a Birth.” Working Paper (Washington Center for Equitable Growth, 2016), available at http://equitablegrowth.org/wp-content/uploads/2016/09/10042016-WP-income-volatility-around-birth.pdf.
70. Schneider and Harknett, “Schedule Instability and Unpredictability and Worker and Family Health and Wellbeing.”
71. Tanya S. Byker, “Paid Parental Leave Laws in the United States: Does Short-Duration Leave Affect Women’s Labor-Force Attachment?” American Economic Review 106 (5) (2016): 242–46, available at https://doi.org/10.1257/aer.p20161118; David Card and Alan B. Krueger, “Minimum Wages and Employment: A Case Study of the Fast-Food Industry in New Jersey and Pennsylvania” American Economic Review 84 (4) (1994): 772–93, available at http://www.nber.org/papers/w4509.pdf.
72. Chodorow-Reich and others, “Does State Fiscal Relief During Recessions Increase Employment? Evidence Form the American Recovery and Reinvestment Act.”