The federal tax reform blueprint developed by Speaker of the House Paul Ryan (R-WI) and his colleagues in the majority in the House of Representatives combines lower tax rates for individuals with a “destination-based cash flow” business tax applicable to all businesses. The cash flow element means that businesses will be allowed to write off capital expenses such as machines and that routine investment returns will be exempt from taxation. The destination basis means that exports will be tax exempt and imports taxable.
The Ryan tax reform plan has several major problems. Specifically, it:
- Is incompatible with our trade law obligations
- Is incompatible with our tax treaties
- Would generates large federal revenue losses
- Would make our tax system less progressive at the proposed tax rates
- Will not solve the problems of businesses shifting their incomes to overseas tax havens even though this is what it is designed to address
Our working paper details these problems. Here, we summarize our findings and recommend an alternative approach to tax reform that is both progressive and revenue neutral.
New Working Paper
Problems with destination-based corporate taxes and the Ryan blueprint
The “border adjustment” feature of the Ryan blueprint raises key problems. Indeed, the incompatibility of the Ryan blueprint with trade rules is no mere technicality. U.S. trading partners are likely to be hurt by increased incentives to operate in the United States and by much larger profit shifting by their businesses. Trading partners are likely to retaliate, which risks large negative effects to the world trading system as well as an uncertain investment climate. There is no easy way to solve the tax reform plan’s incompatibility with U.S. obligations under the World Trade Organization. If the U.S. government in the end were to comply with WTO rules by turning this plan into a “normal” value added tax, or VAT, then it would turn the corporate tax into a regressive consumption tax. And the border adjustment feature could not be dropped without huge revenue losses as well as enormous tax avoidance problems.
In addition, the Ryan blueprint generates vexing technical tax problems that are not easily fixed. There are important issues surrounding how U.S. exporters with losses would be handled (which could lead to inefficient tax-induced mergers), how financial transactions would be handled, how U.S. state corporate tax systems would be affected, and how the transition to the new tax system would be handled. There are also multi-trillion dollar wealth effects, with a large reduction in wealth for U.S. holders of foreign assets.
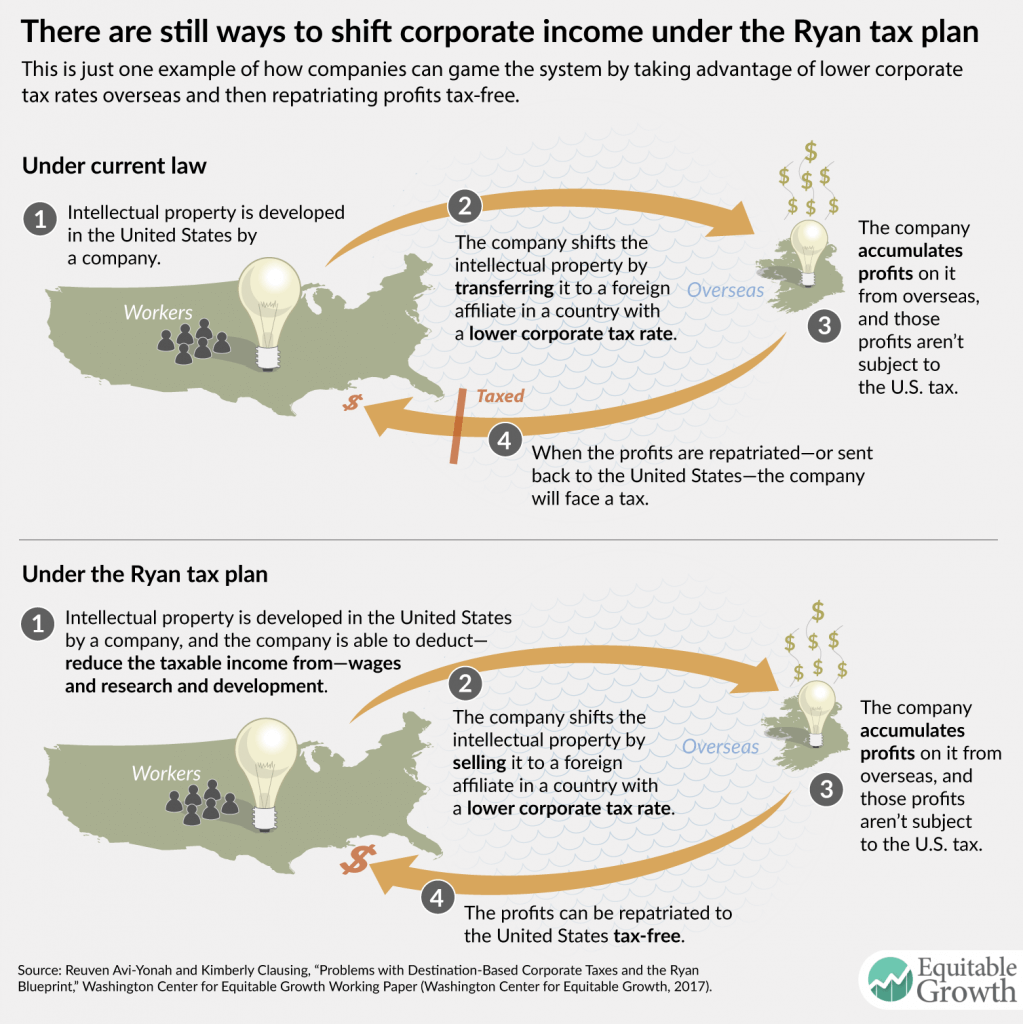
Profit shifting is not completely eliminated by the plan, contrary to claims. As an example, the Ryan plan makes it easier for U.S. corporations to move profits offshore on intellectual property, especially when the intellectual property serves foreign markets. (See Figure 1.)
Figure 1
The tax reform plan is likely to generate large revenue losses, too, estimated at $3 trillion over ten years by the Tax Policy Center. These revenue losses may be understated since they assume there will not be tax avoidance due to the large discrepancy between the proposed top personal rate of 33 percent and the business rate of 20 percent (or 25 percent for those filing pass-through business income). New tax avoidance opportunities will arise as wealthy individuals seek to earn their income in tax-preferred ways that reduce their labor compensation in favor of business income that would be taxed at a lower rate.
Further, while the border tax provisions generate more federal tax revenue over the short run, the revenue from the border adjustment is contingent on the United States maintaining its current trade deficit. Since trade deficits eventually have to be paid back in the form of trade surpluses, these revenue gains are really being borrowed from future U.S. taxpayers.
Finally, due to the tax rates that have been proposed, the Ryan tax reform plan creates a less progressive tax system. Tax Policy Center estimates show that the top 1 percent of individual income earners receive a tax cut of $213,000, while the tax cut for the bottom 80 percent averages $210. The regressive nature of these tax changes is unjustifiable given the increases in economic inequality over the previous decades. Capital income and rents (undue business profits due to market concentration), are far more concentrated than labor income. And the lower business tax rates chosen by the plan are intellectually incoherent because the plan exempts taxes on the normal return to capital and reduces profit shifting—both of which are the usual arguments for a lower rate in the first place. If such concerns are moot, then there is no reason to tax business income at a lower rate than labor income.
Given these concerns, we would recommend that Congress reject the Ryan blueprint. Instead, it should focus on revenue neutral tax reform that reduces the corporate tax rate and eliminates the major corporate welfare provisions, including taxing accumulated offshore earnings in full. Doing so would eliminate the incentive to earn income in tax havens, by treating foreign and domestic income alike for tax purposes. Pairing that reform with a lower corporate tax rate need not raise tax burdens on average. A more fundamental reform would require treating multinational enterprises as a single business entity, which would better align the tax system with the reality of globally integrated corporations.
—Reuven Avi-Yonah is the Irwin I. Cohn professor of law at the University of Michigan Law School, and Kimberly Clausing is the Thormond A. Miller and Walter Mintz professor of economics at Reed College
"Problems with destination-based corporate taxes and the Ryan blueprint" (Fact Sheet)
View the fact sheet in your browser
- Kimberly A. Clausing, “Profit shifting and U.S. corporate tax policy reform,” (Washington, DC: Washington Center for Equitable Growth, 2016), https://equitablegrowth.org/report/profit-shifting-and-u-s-corporate-tax-policy-reform/.
- Kimberly A. Clausing, “Strengthening the indespensible U.S. corporate tax,” (Washington, DC: Washington Center for Equitable Growth, 2016), https://equitablegrowth.org/report/strengthening-the-indispensable-u-s-corporate-tax/.