The importance of unemployment benefits for protecting against income drops

People walk by the recruiters at a jobs fair in the Pittsburgh suburb of Green Tree, Pennsylvania.

During the worst part of the Great Recession, virtually every segment of the U.S. economy was adversely affected. Employment losses were severe and unevenly distributed, making many likely to be eligible for unemployment insurance. The program is supposed to support the unemployed as they search for a new job. But what happens when someone can’t find a job before his or her benefits expire? The consequences could be dire.

In an important new paper, economists Jesse Rothstein of the University of California, Berkeley and Robert Valletta of the Federal Reserve Bank of San Francisco investigate the role that unemployment insurance plays in supporting family incomes and how the unemployment insurance system interacts with other parts of our social safety net. The unemployment insurance system is designed to provide temporary income to workers during spells of unemployment. The typical duration of these benefits—individual states have broad latitude in setting the exact details in each state—is 26 weeks or less. But during and after the Great Recession, many states extended eligibility to up to 99 weeks.

Even with these extensions, however, many unemployed workers still exhausted these benefits before finding new jobs. Rothstein and Valletta find that after a job loss, households with unemployed workers saw their incomes fall by about half. Unemployment benefits replaced about a half of the lost income, supporting family incomes to a significant extent but failing to help many families experiencing unemployment avoid slipping into poverty as they tried to find new jobs. Initially, unemployment insurance and a rise in income from other household members helped to buffer the blow of a 50 percent drop in income due to job loss. Yet once these benefits expired, households suffered a second blow to income of 13 percent, with nearly no additional support from other social safety net programs. The remaining social safety net replaced only a small share of the lost unemployment benefits. (See Figure 1.)

Figure 1

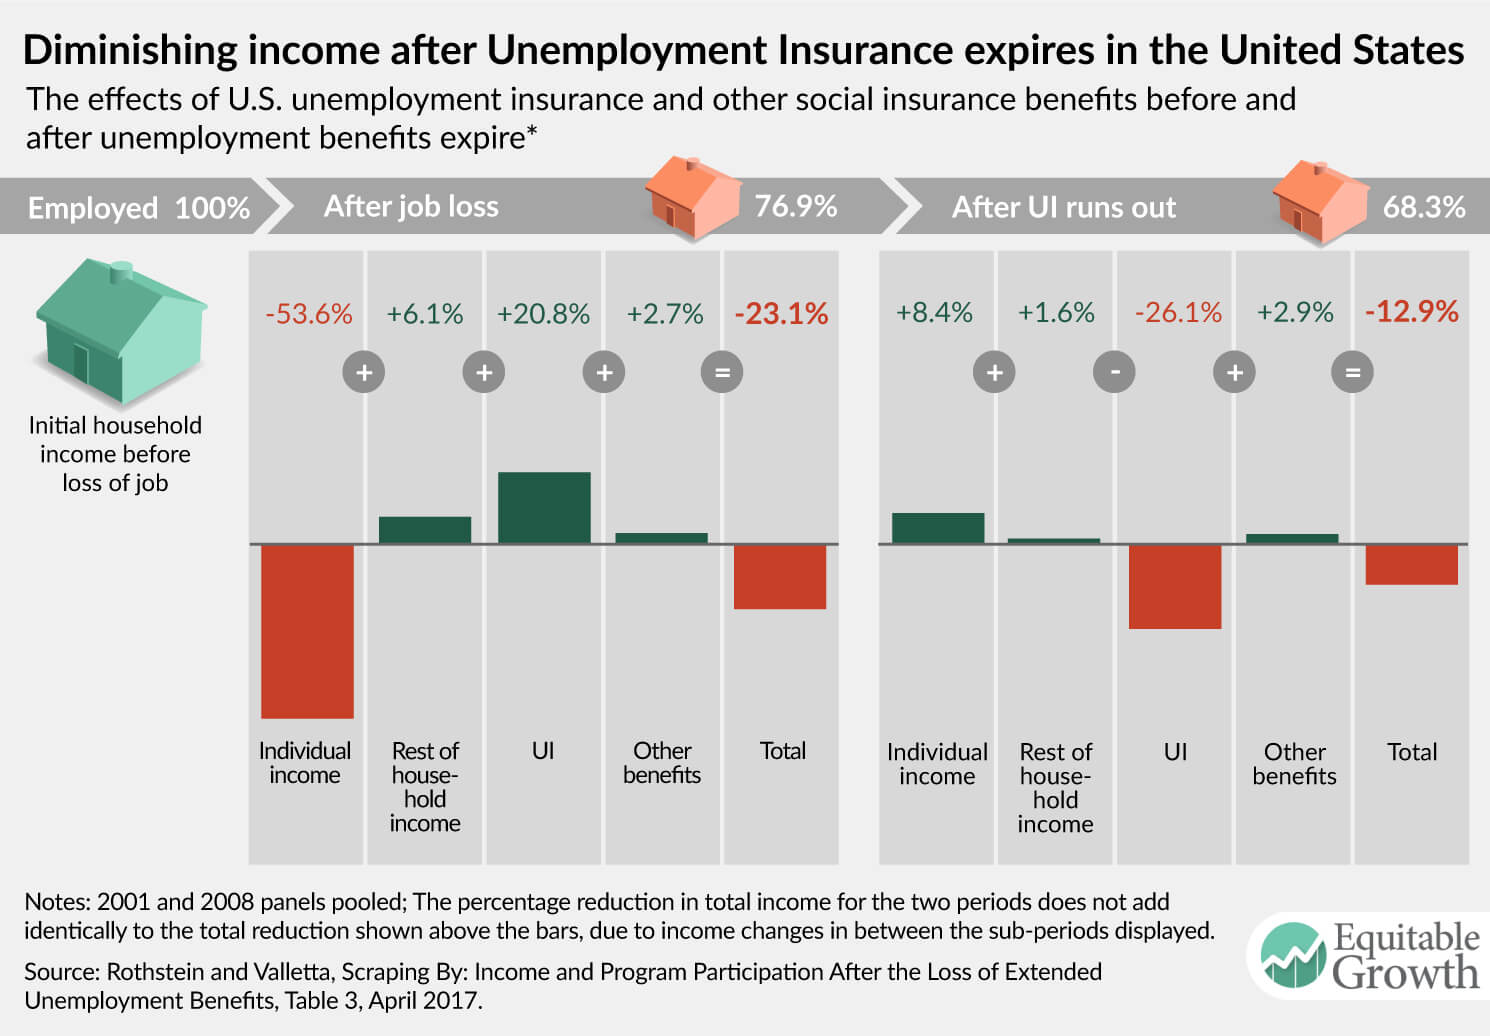
The Supplemental Nutrition Assistance Program, for example, made up for only about 2 percent of pre-job loss income in households that tapped unemployment insurance and then about the same 2 percent after they lost unemployment insurance benefits.

It’s important to note that household consumption may not have fallen as dramatically as income over the period of job loss and unemployment exhaustion. But given the evidence that more than half of American families could not replace a month of their income with liquid savings and that one-third have no savings at all, it is difficult to see how households would be able to maintain their standards of living.

The bright side of these findings is that unemployment insurance does its job: partially insuring against large income declines after a job loss. But once an unemployed worker is no longer eligible for the program, the rest of the social insurance system does little to support those households. Other new research shows the significant decline in income and spending that happens after unemployment benefits are exhausted. If policymakers want to ensure that U.S. workers can have some modicum of economic security during the next economic downturn, they should take this research to heart.

Must- and Should-Reads: April 24, 2017


Interesting Reads:

A Low-Pressure Economy Is Not Only Dark But Invisible in the Horserace Noah Smith is Running…

Cursor and Cracking the Mystery of Labor s Falling Share of GDP Bloomberg View

I think the estimable Noah Smith gets this one wrong. He writes:

Noah Smith: Cracking the Mystery of Labor’s Falling Share of GDP: “Economists are very worried about the decline in labor’s share of U.S. national income… https://www.bloomberg.com/view/articles/2017-04-24/cracking-the-mystery-of-labor-s-falling-share-of-gdp

…For decades, macroeconomic models assumed that labor and capital took home roughly constant portions of output—labor got just a bit less than two-thirds of the pie, capital slightly more than one-third. Nowadays it’s more like 60-40. Economists are therefore scrambling to explain the change. There are, by my count, now four main potential explanations for the mysterious slide in labor’s share. These are: 1) China, 2) robots, 3) monopolies and 4) landlords…”

There is, in my view, a fifth—and a much more likely—possibility: the low-pressure economy.

The first misstep Noah takes is in saying that 100% of national income is divided between “labor” and “capital”. It is not. Entrepreneurship, risk-bearing, innovation, monopoly rents, and other factors are rolled into the non-labor share as well. It’s not the labor share and the capital share. It’s the labor share and everything else.

Suppose that you were not attached to sophisticated economic theory but just believed in the basic Adam Smith supply-and-demand: when something is in high demand, its price goes up; when something is in low demand, its price goes down. How then would you interpret the graph above at the top of this post?

You would say:

  1. Hmmm. In the late 1960s Lyndon Johnson created a high-pressure economy—he did not want to raise taxes to pay for fighting the Vietnam War, and did not want the Federal Reserve to raise interest rates. Then Richard Nixon continued the policy, naming Arthur Burns his own partner in his attempt in 1959 to persuade Eisenhower to create a high-pressure economy for the 1960 campaign, to run the Federal Reserve. And so the labor share went up.

  2. The 1973-1975 oil shock recession and then the 1979-1982 Iran Revolution plus Volcker Disinflation recessions gave a further large negative wallop to the pressure the economy was under. And so the labor share fell.

  3. It may have been “morning in America” from 1984 on in Reagan campaign commercials, but that was definitely not the case as far as the labor market was concerned.

  4. When the labor market became tight again in the internet boom of the late 1990s, lo and behold the labor share jumped back up again.

  5. But the recovery from the recession that followed the dot-com boom and 9/11 was a disappointing one. And the labor share fell.

  6. And then came the financial crisis and the disappointing recovery since. And the labor share fell some more.

Noah Smith’s quadriad of “China, robots, monopolies, and landlords” is needed only if you have a strong belief that there is one unique macroeconomic equilibrium point about which the business cycle fluctuates and to which the economy returns rapidly after a business-cycle shock creates a high- or a low-pressure economy. It is certainly convenient for economic model builders to believe in such a tendency for a rapid return to a unique macroeconomic equilibrium.

But where in the real world is there any evidence that there is in fact such a thing?

IMHO, the low-pressure economy is the leading horse in the race to understand why the labor share today is lower than it was in the late 1960s or the late 1990s. Yet Noah Smith does not even see it as in the race…

Must-Read: Matthew Yglesias: If you really respect Trump voters, tell them the truth

Must-Read: Matthew Yglesias: If you really respect Trump voters, tell them the truth: “A wave of recent columns argue that what Trump superfans… http://www.vox.com/policy-and-politics/2017/4/24/15375206/respect-trump-voters-truth

…or at least some hazily imagined, hard-pressed Northern working-class version of them—really want is respect. By all appearances, though, the opposite is the case. Those voters want what most voters want from politicians: to be disrespected, via shameless pandering and the occasional blatant lie. This was true of the men I spoke to in Bucksport, Maine, in the summer of 2016…. They seemed most of all to want to be told that reopening the [paper] mill was a realistic dream, even though it almost certainly is not. That doesn’t make Trump fans unique. It makes them normal….

But if you really respect people and really want to help them, you need to level with them…. When my grandparents were growing up in Brooklyn, it was a great hub of American manufacturing. Those jobs vanished, hard times ensued, and between 1950 and 1980 the borough lost nearly 20 percent of its population. Things have turned around over the course of my lifetime. But the specific lost jobs never came back…. Seattle, San Francisco, and other prosperous metropolitan areas, similarly, aren’t rich today because they never lost any good-paying jobs or industries. They’re rich today because they are home to brand-new industries….

Texas is successful because it’s grown big cities that anchor modern service economies, has built a world-class public university system, and has K-12 schools that, despite stingy funding, perform extremely well on a demographically adjusted basis. Successfully navigating this sort of transition is objectively difficult, especially if you don’t have Southern California’s weather or Texas’s fossil fuel resources…. But to change and adapt successfully, you need to want to do it. To accept that your kid may grow up to wear cowboy boots but probably won’t be an actual cowboy….

Claire Garofalo of the Associated Press recently published a brilliant examination of the small city of Lewiston, Maine—a long-declining factory town that has in many ways been revitalized by an influx of refugees from Somalia…. But… the majority of local whites don’t seem to like it—they wanted Lewiston’s glory days restored, not for culturally alien newcomers to transform their hometown…. The ultimate irony of today’s era of nostalgia politics, after all, is that the era people are nostalgic for was itself an era of incredibly rapid change. The “good old days” were a time when new industries were rising, the population was growing fast, and the built environment shifted rapidly in the direction of suburbanization….

Telling people that their community needs to change is probably not what they want to hear. But when you really respect people, you tell them the truth.

Must-Read: Ezra Klein: The GOP’s biggest health care achievement has been making Obamacare more popular

Must-Read: Ezra Klein: The GOP’s biggest health care achievement has been making Obamacare more popular: “It is bizarre watching House Republicans persuade themselves that the problem they face on health care… https://www.vox.com/obamacare/2017/4/20/15373092/republicans-made-obamacare-more-popular

…is cutting a deal between the Freedom Caucus and the Tuesday Group rather than crafting legislation that people actually like, and that will actually make some part of the health care system noticeably better. But the GOP’s refusal to take public opinion even mildly into account has put them in a disastrous position.

I’m not sure Republicans realize how deep a hole they’re in on this issue. But here’s a way to make it clear. Obamacare is now significantly more popular than Donald Trump, Mike Pence, Paul Ryan, the Republican Party, or the American Health Care Act…

Should-Read: Fatih Guvenen and Greg Kaplan: Top Income Inequality in the 21st Century: Some Cautionary Notes

Should-Read: Fatih Guvenen and Greg Kaplan: Top Income Inequality in the 21st Century: Some Cautionary Notes: “IRS and SSA data reveal diverging patterns in top income shares… http://papers.nber.org/w23321.pdf

…due to the increasing importance of income accruing to pass-through entities (partnerships and S-corporations)… included in the IRS measure of total income but not in either the IRS or SSA measure of labor income…. The bulk of this growth… was concentrated at the very top… above the 99.99th percentile, a group that contains only about 12,000 households. The share of incomes above the 99th percentile (around $372,000 in 2012) but below the 99.99th percentile (around $7.2 million in 2012) has barely changed in the last two decades…

Must-Read: Kevin Drum: We’re Now In the Second Biggest Housing Boom of All Time

Must-Read: There were three good reasons in the mid-2000s to believe that housing prices should jump substantially. The coming of secular stagnation—then called the “global savings glut”—greatly boosted demand by boosting how much households could afford to pay for America. The filling-up of America restricted supply: first cars and superhighways had meant that for nearly three generations there were greenfield potential housing sites within thirty minutes of everywhere, but that ended with the twentieth century. At some point the anti-global warming carbon tax will come, and when it does auto transportation will become much more expensive and that will tilt the location price gradient. How much were these worth? Not enough to boost housing prices to their 2005 values. But plausibly enough to boost housing prices to their values today. IMHO, the best way to view the graph is as a positive “displacement” boom caused by true fundamentals, a bubble upward overshoot, a crash downward undershoot, and now (we hope) equilibrium:

Kevin Drum: We’re Now In the Second Biggest Housing Boom of All Time: “The most remarkable feature of this chart… http://www.motherjones.com/kevin-drum/2017/04/were-now-second-biggest-housing-boom-all-time

We re Now In the Second Biggest Housing Boom of All Time Mother Jones

…is that between 1953 and 1997, average housing prices increased by zero percent. Zero…. The second most remarkable feature of this chart is, of course, the insane Bush-era boom. Here in California we considered the 80s boom to be a very, very big deal. But it was a mere blip. The Bush boom was without precedent. Finally, we get to the third most remarkable feature of this chart: the Obama-Trump era boom that’s happening right now…. So what happens next? Are things really different this time, and home prices will stay permanently high? Or are we due for another housing bust? Beats me…

Must-Read: Òscar Jordà, Moritz Schularick, and Alan M. Taylor: Monetary Policy Medicine: Large Effects from Small Doses?

Must-Read: Òscar Jordà, Moritz Schularick, and Alan M. Taylor: Monetary Policy Medicine: Large Effects from Small Doses?: “How do we know that higher interest rates will bring prices under control?… http://www.frbsf.org/economic-research/publications/economic-letter/2017/april/monetary-policy-medicine-using-quasi-random-experiments/

…And how do we know how much of the monetary “medicine” to administer?… The long history of international finance turns out to be an excellent laboratory to conduct monetary experiments…. Interest rates have sizable effects….

Economies that fix their exchange rate but allow capital to move freely across borders effectively relinquish control of domestic monetary policy. In such situations, monetary policy may not respond to domestic conditions and hence may produce quasi-random variation in interest rates that is less sensitive to unobserved factors. We take advantage of this…. Figure 1 shows the response of inflation-adjusted GDP per capita in response to a 1 percentage point increase in short-term interest rates in year 0 calculated two different ways… controlled variation… peg variation…. In the first case, interest rates barely cause a ripple, whereas in the second, real GDP per capita is about 2% lower in year 4 than it was at the start…. The measured response of prices using controlled variation in interest rates is muted—prices are about 0.5% lower by year 4 relative to year 0. The same response calculated with peg variation is estimated to be nearly 2%. In other words, assuming a constant rate of price decline, inflation is about 0.4 percentage point per year lower…

Should-Read: Chris Hayes: On escaping the “doom loop” of Trump’s presidency

Should-Read: Chris Hayes: On escaping the “doom loop” of Trump’s presidency: “I tend to think of it in terms of my own behavior… https://www.vox.com/2017/4/19/15356534/chris-hayes-donald-trump-media-elections-2016-criminal-justice

…Like, what am I going to do? How am I going to avoid the doom loop? My whole approach to the Trump era is to act as if reality matters, facts matter, the basic political gravity of whether you make people’s lives better or worse matters, rigorous thinking, nonconspiratorial thinking, logical skepticism — all of these things, these principles I hold as a journalist, as a thinker, as a writer, as a citizen, they all matter. Act as if that’s the case, even with the knowledge they may not.

I don’t know if in the end they will matter, but I can’t figure out how to conduct myself in my life or in my work if they don’t…

Weekend reading: “This post is tax-ing” edition

This is a weekly post we publish on Fridays with links to articles that touch on economic inequality and growth. The first section is a round-up of what Equitable Growth published this week and the second is the work we’re highlighting from elsewhere. We won’t be the first to share these articles, but we hope by taking a look back at the whole week, we can put them in context.

Equitable Growth round-up

 Nick Bunker writes about a new working paper that looks at how income inequality in the United States has changed in the 21st century. The research finds that the increase in income inequality since 2000 is largely driven by higher capital income among the top .01 percent of earners.

With tax day 2017 having come and gone this past week, Kavya Vaghul compiles a roundup of graphics showing interesting trends in U.S. tax policies over the years.

In the aftermath of almost a decade of unconventional monetary policy to fight the Great Recession, many political actors are contemplating new rules on monetary policy. But Nick Bunker cautions that when it comes to creating rules-based monetary policy these politicians should be aware of what aspects of monetary policy the rule is trying to govern.

Links from around the web

In the face of big job declines within some U.S. service sectors, Paul Krugman asks why the discussion on job loss focuses almost exclusively on mining and manufacturing. [nytimes]

In the past 10 years, student loan debt in the United States has grown by a whopping 170 percent, to $1.4 trillion, which is more than car loans or credit card debt. As more debt is transferred out of the private sector and into the public “in an eerie echo of the housing crisis,” Rana Foroohar says that increasing economic anxiety is well founded. [ft]

Claire Cain Miller looks about a new study that shows how investments in childcare pay off for mothers and kids alike, especially for boys, and returned $7.30 for every dollar spent. The study’s researchers (who include Nobel Laureaute James Heckman) found that children who were enrolled in a free, full-time childcare program in North Carolina earned more later in life, were healthier, and had fewer misdemeanor arrests. The mothers of these children also earned more. [the upshot]

Vanessa Williamson debunks the myth that Americans hate paying taxes. Instead, her research finds that many Americans are angered by their belief that some people aren’t paying their fair share. Williamson argues that, not only are these beliefs untrue, but as the country gears up to debate tax reform, these misperceptions can have a profound effect on our future policies. [washington post]

One sign that monopolies are a problem in the United States? The University of Chicago, where economists have argued that growing concentration is not a threat to economic growth, recently held a conference around antitrust concerns. [the economist]

Friday figure

Figure from “Taxing the rich more—evidence from the 2013 federal tax increase,” by Emmanuel Saez