A few graphs for Tax Day 2017
If you haven’t filed your federal taxes yet, here’s a reminder that today is Tax Day. As tax-filing season (at least for those who haven’t gotten an extension) comes to an end, let’s look at some data and trends on the U.S. tax system. Below are a few interesting graphs from recent Equitable Growth analyses.
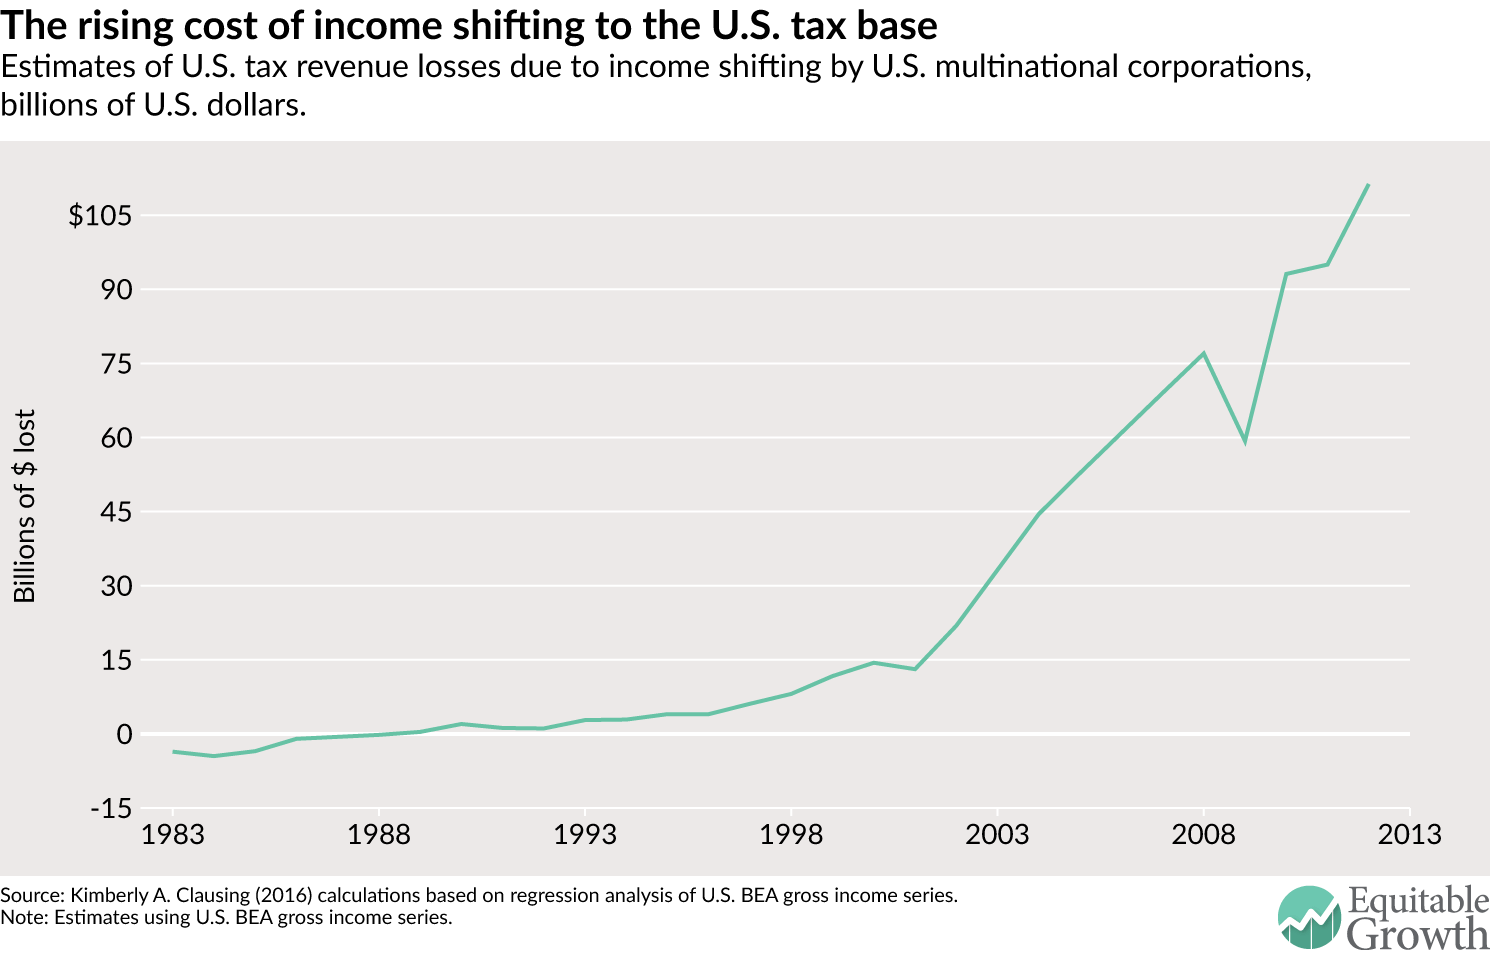
Figure from “Profit shifting and U.S. corporate tax policy reform,” by Kimberly A. Clausing
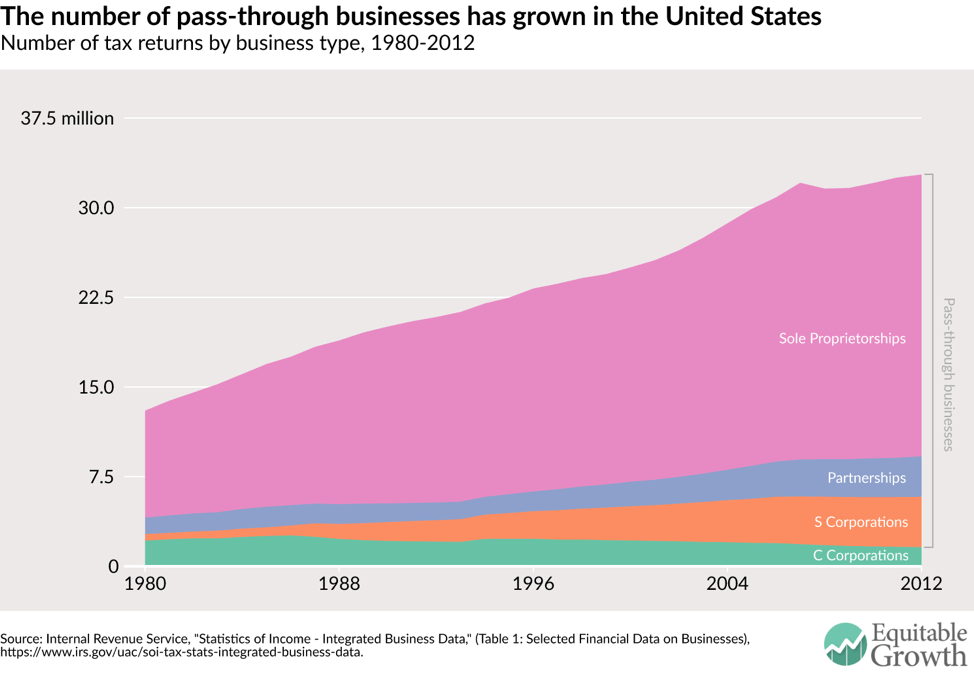
Figure from “U.S. tax revenue will rise modestly in the next 10 years, no thanks to corporate taxes,” by Kavya Vaghul
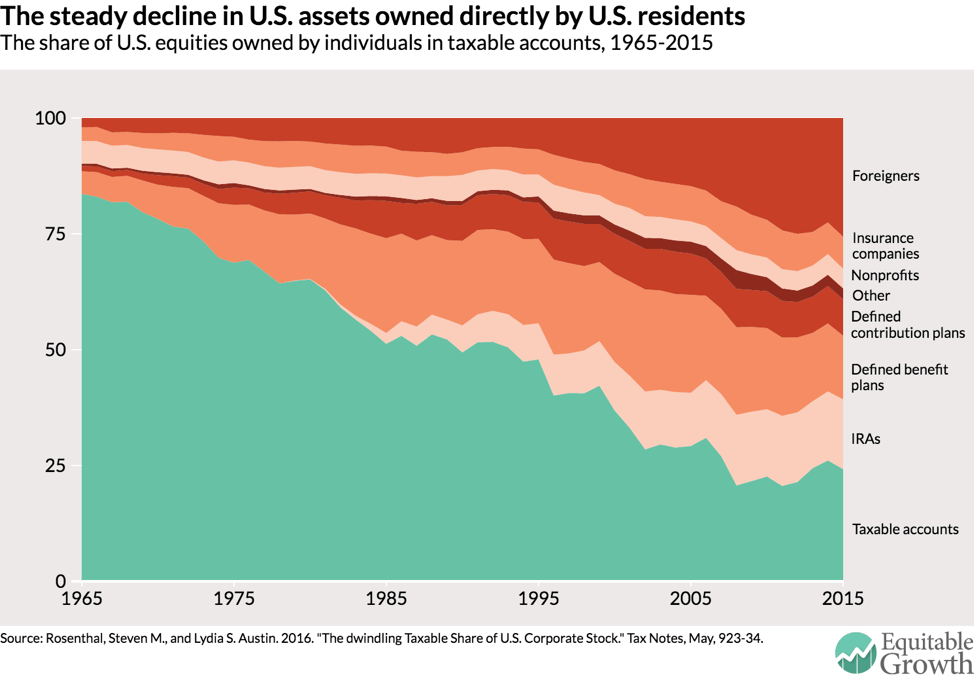
Figure from “Strengthening the Indispensable U.S. Corporate Tax,” by Kimberly A. Clausing
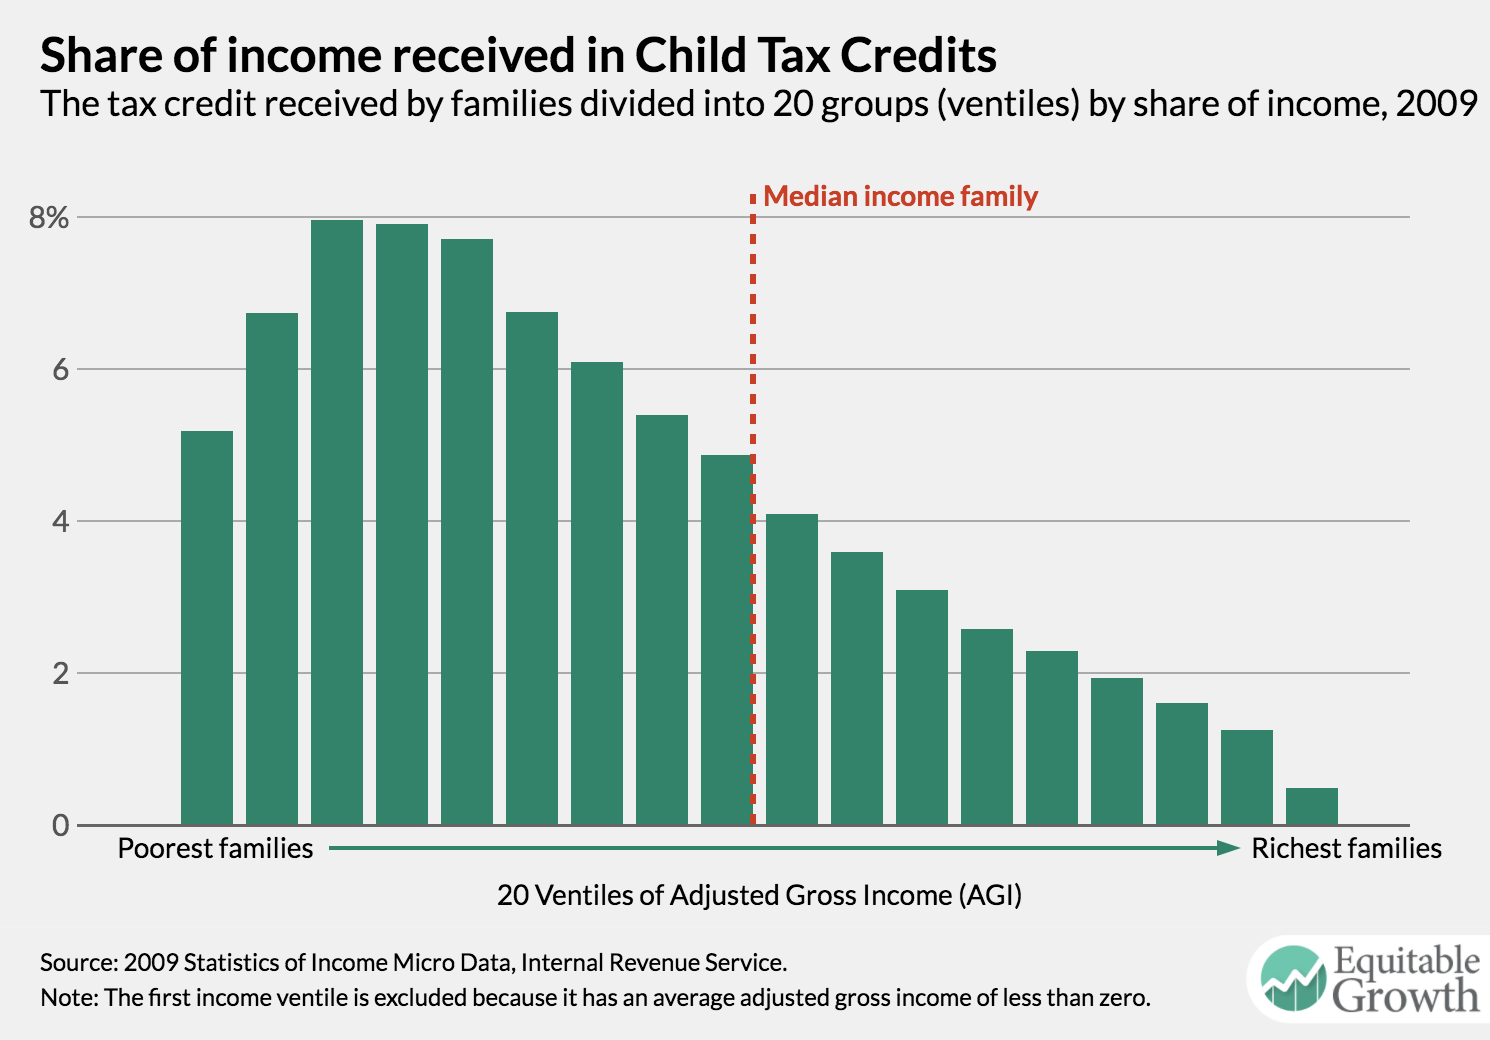
Figure from “A Child Tax Credit primer,” by Nisha Chikhale
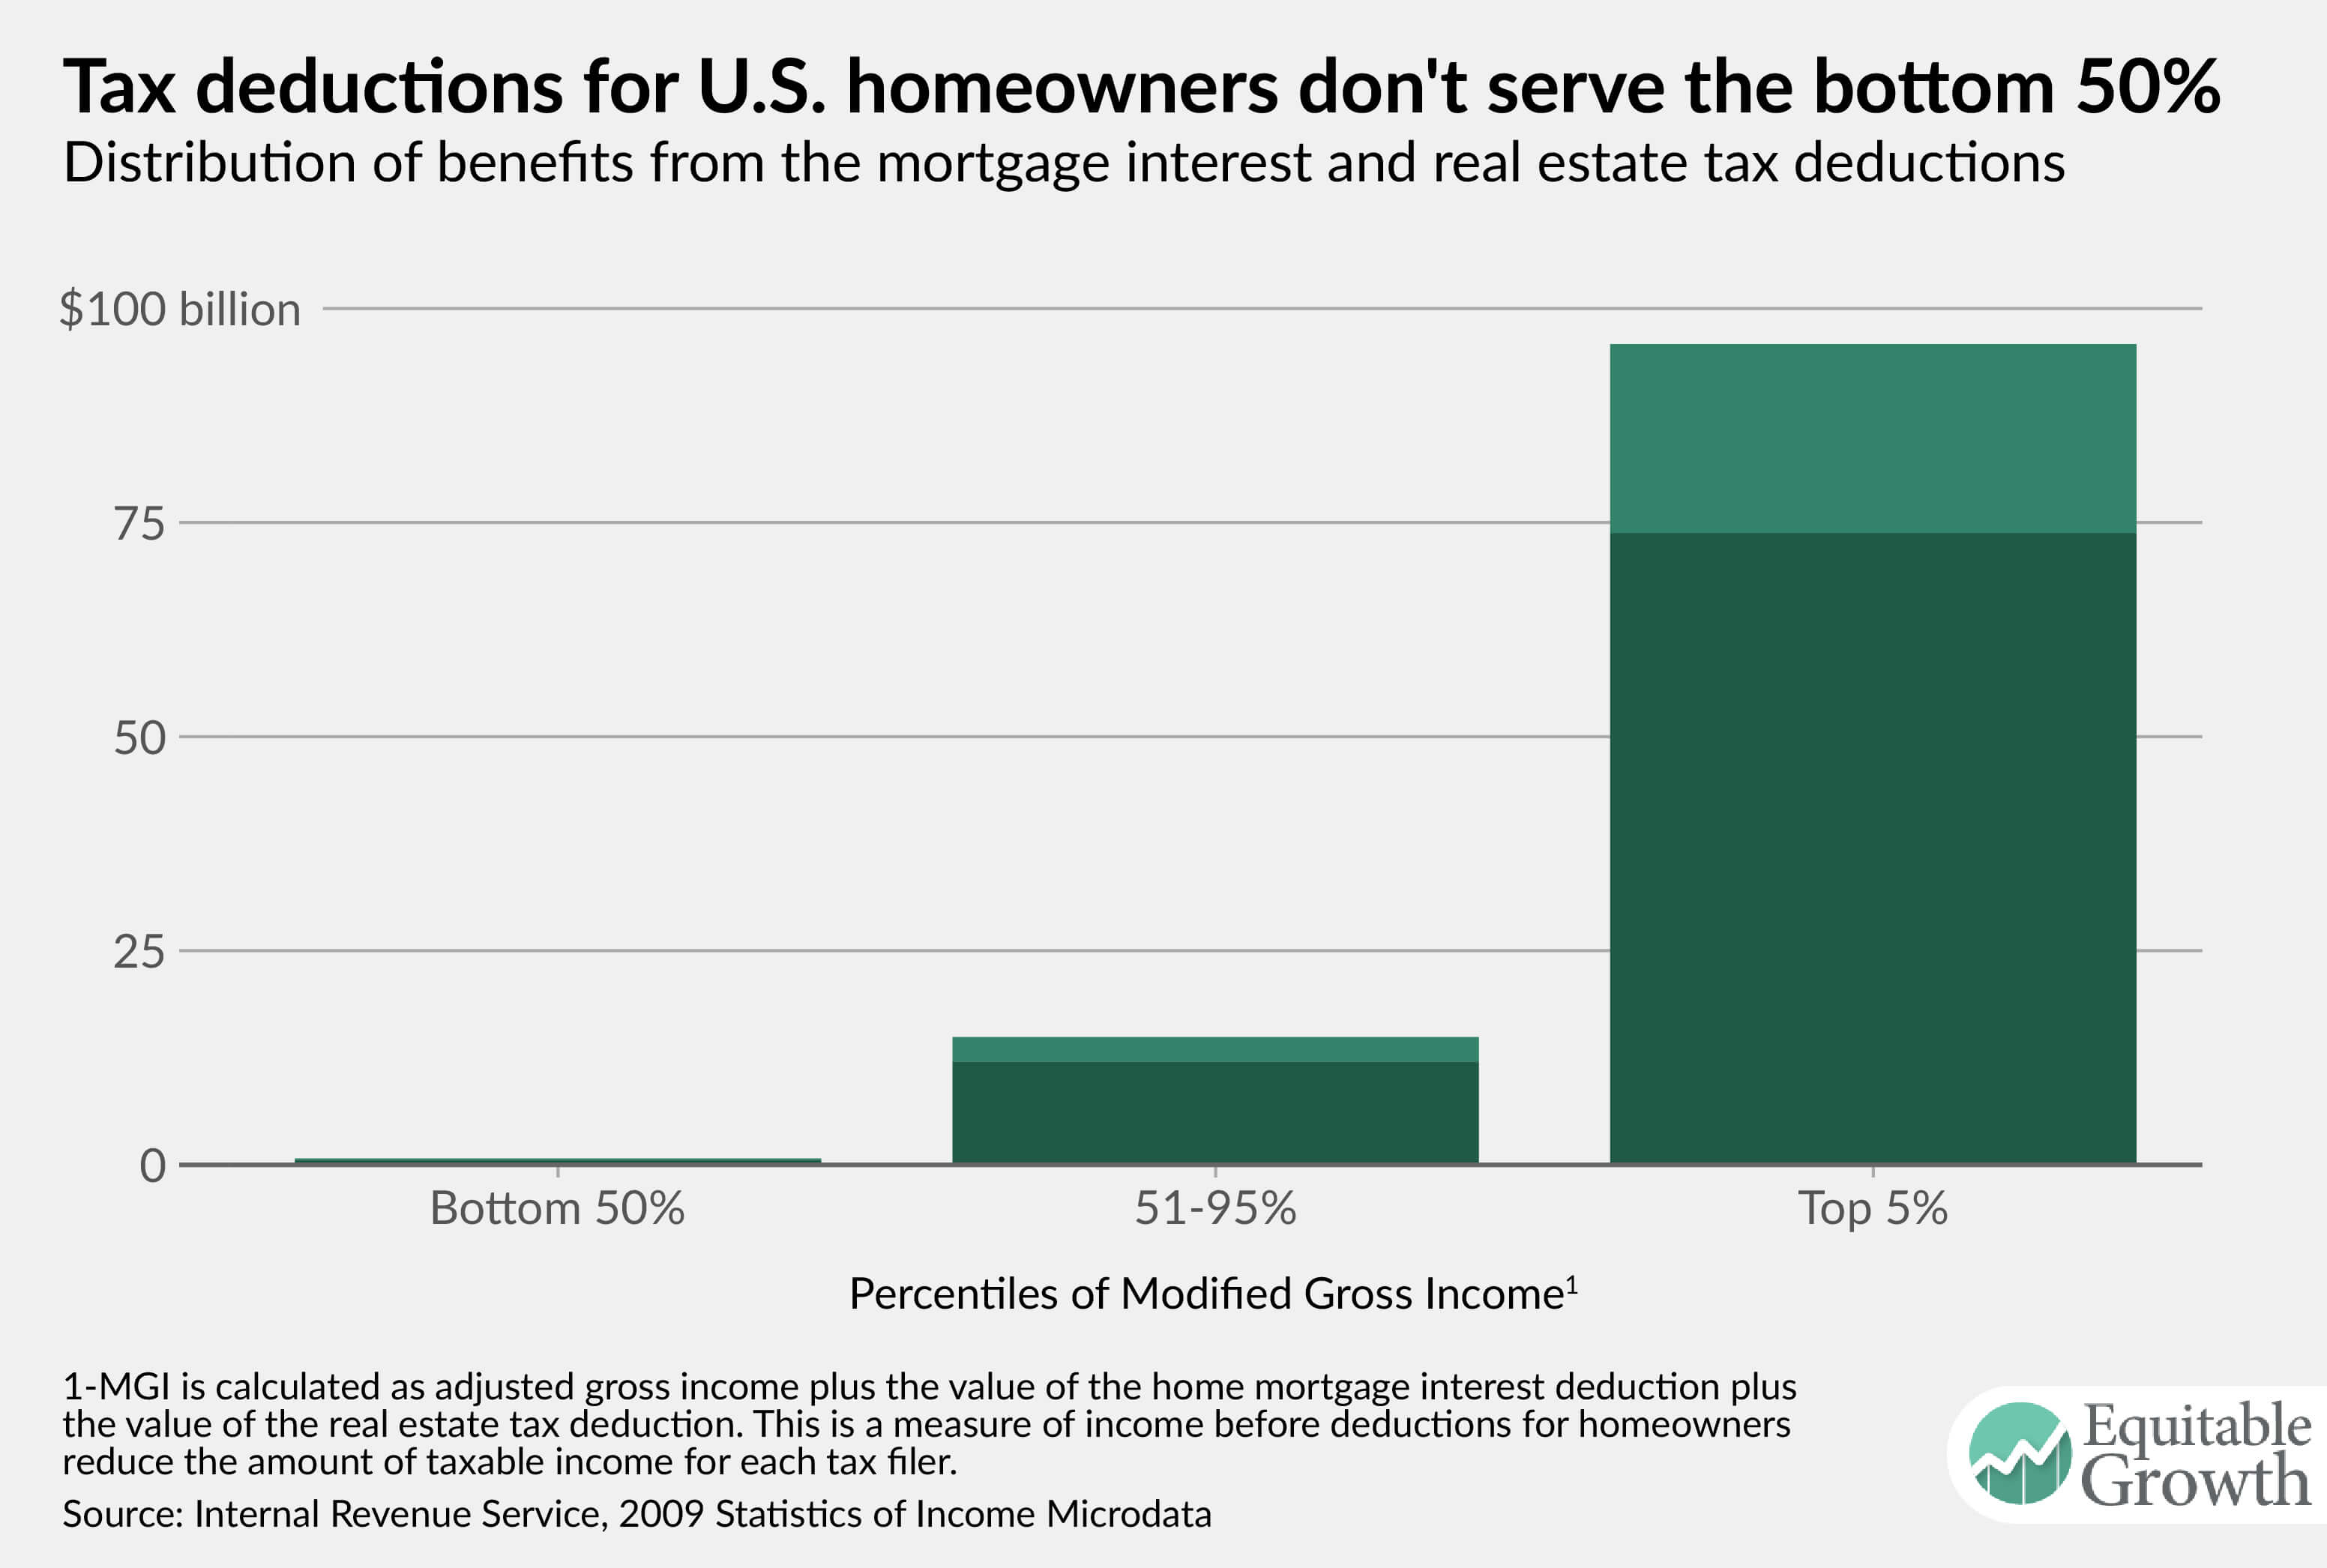
Figure from “U.S. homeownership tax policies are expensive and inequitable,” by Nisha Chikhale
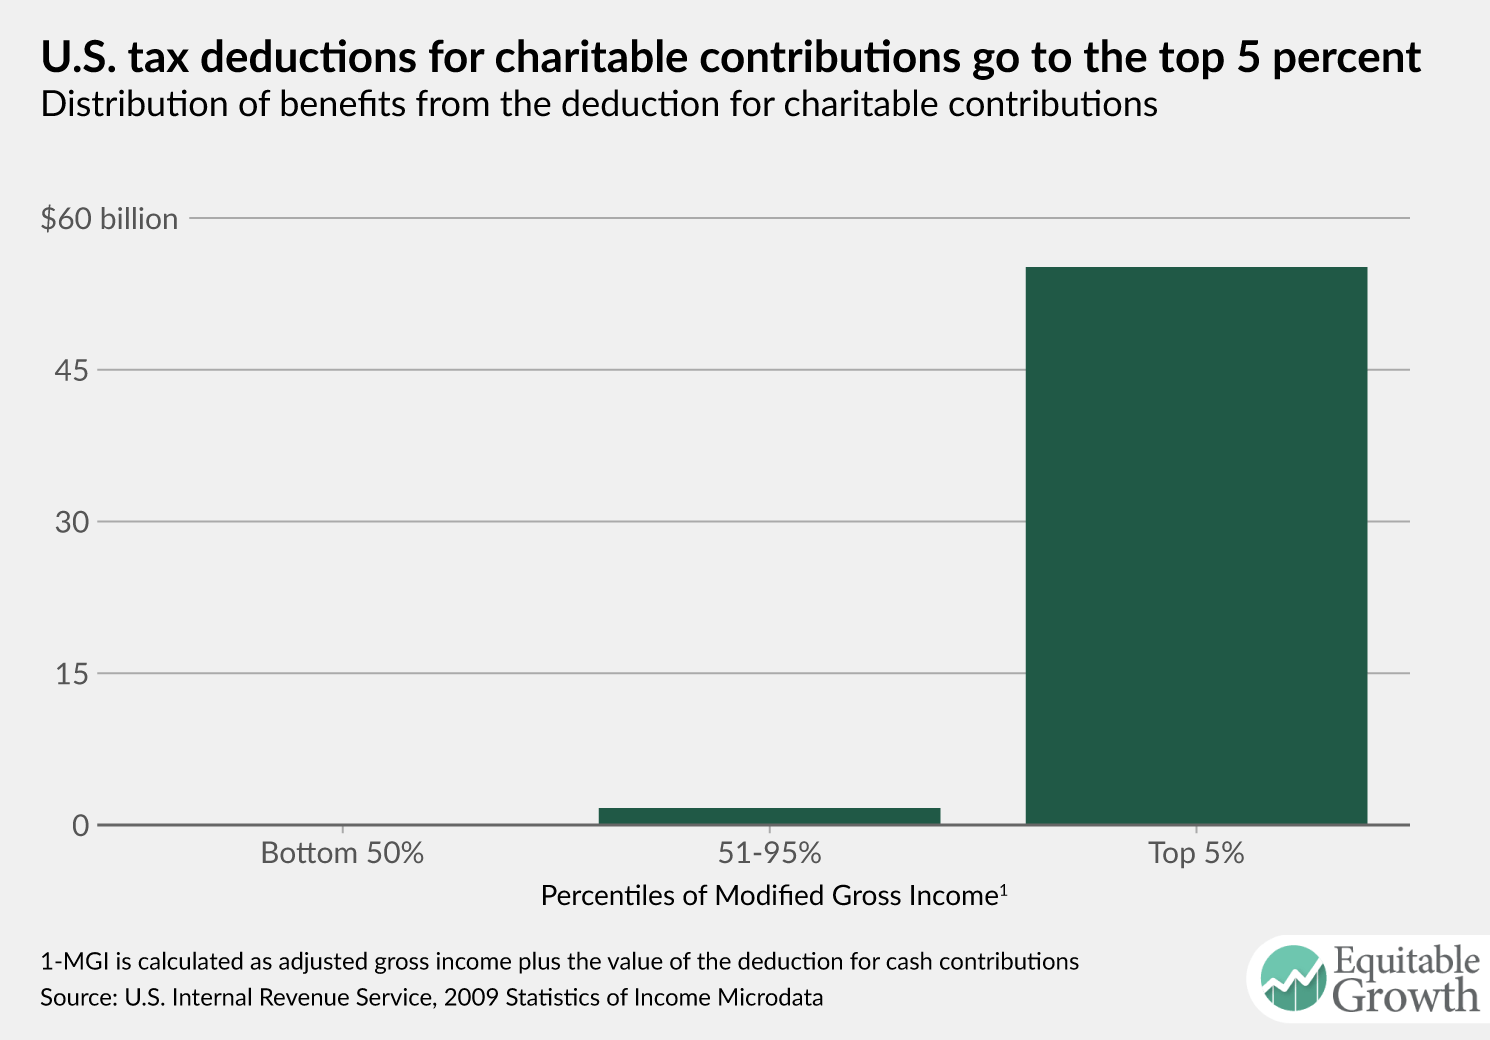
Figure from “Should the U.S. tax deduction for charitable contributions be more equitable?,” by Nisha Chikhale
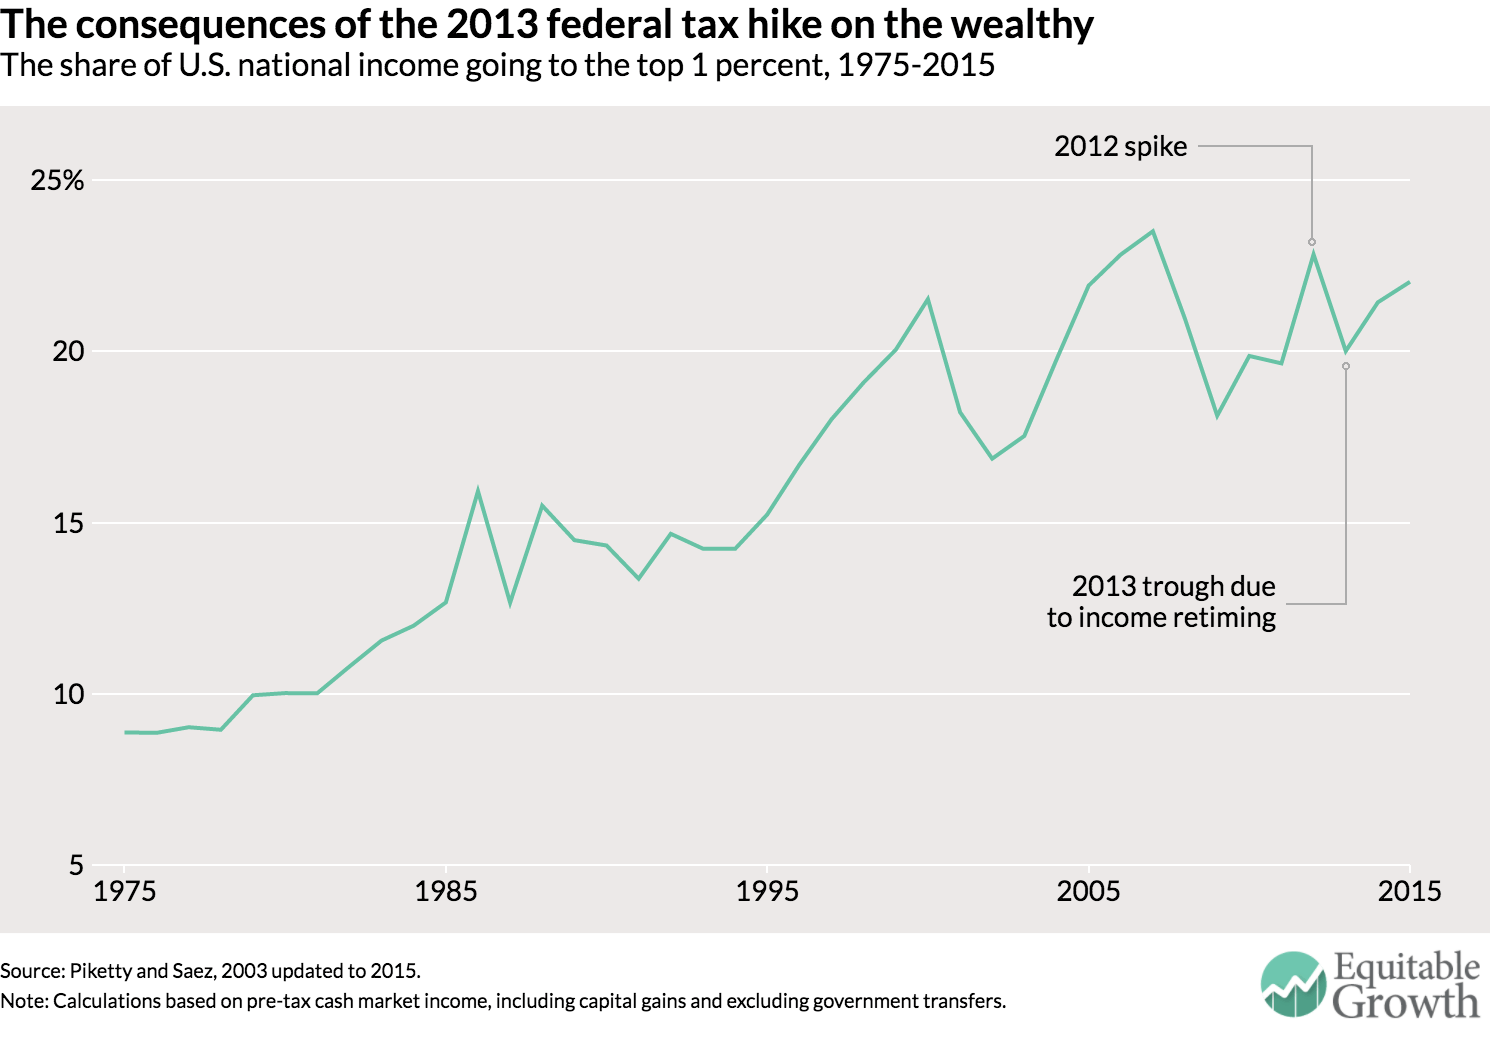
Figure from “Taxing the rich more—evidence from the 2013 federal tax increase,” by Emmanuel Saez