JOLTS Day Graphs: October 2021 Edition

Every month the U.S. Bureau of Labor Statistics releases data on hiring, firing, and other labor market flows from the Job Openings and Labor Turnover Survey, better known as JOLTS. Today, the BLS released the latest data for October 2021. This report doesn’t get as much attention as the monthly Employment Situation Report, but it contains useful information about the state of the U.S. labor market. Below are a few key graphs using data from the report.

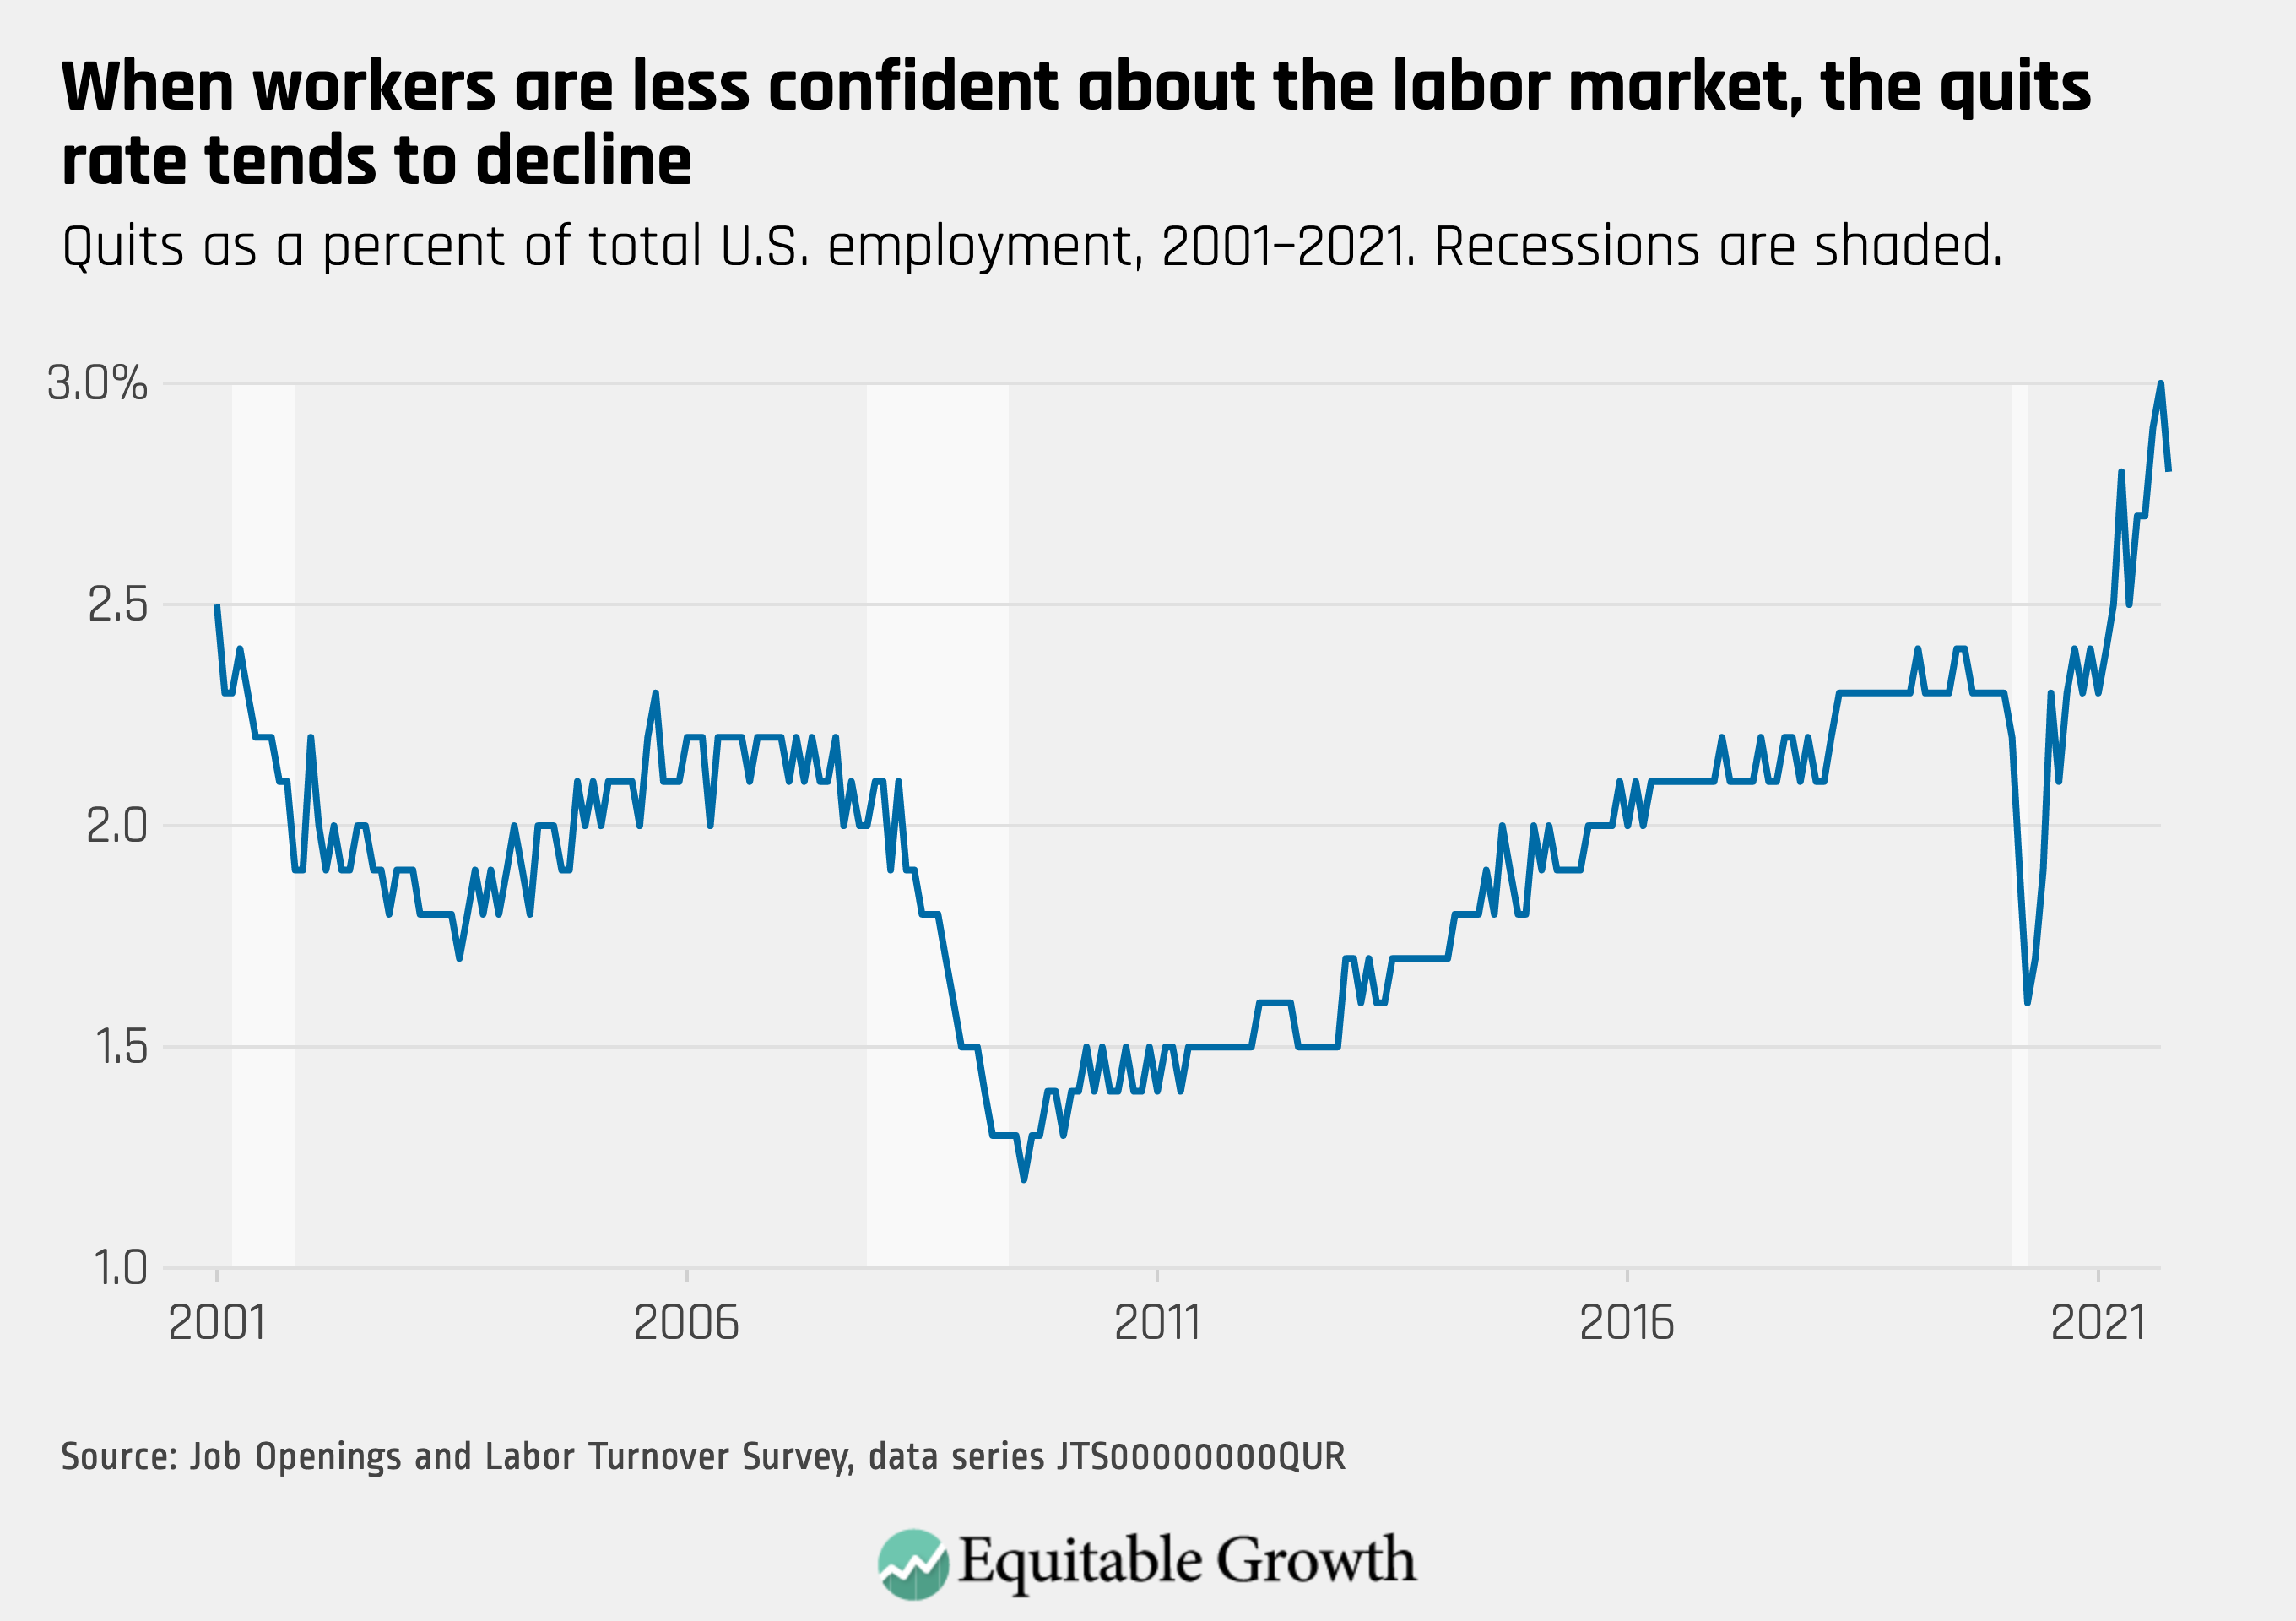
The quits rate declined to 2.8 percent as 4.2 million workers quit their jobs in October, down 205,000 from the previous month, but remains well above typical levels.

Quits as a percent of total U.S. employment, 2001–2021. Recessions are shaded.

The vacancy yield fell further as job openings (11 million) rose and hires (6.5 million) stayed relatively constant in October.

U.S. total nonfarm hires per total nonfarm job openings, 2001–2021. Recessions are shaded.

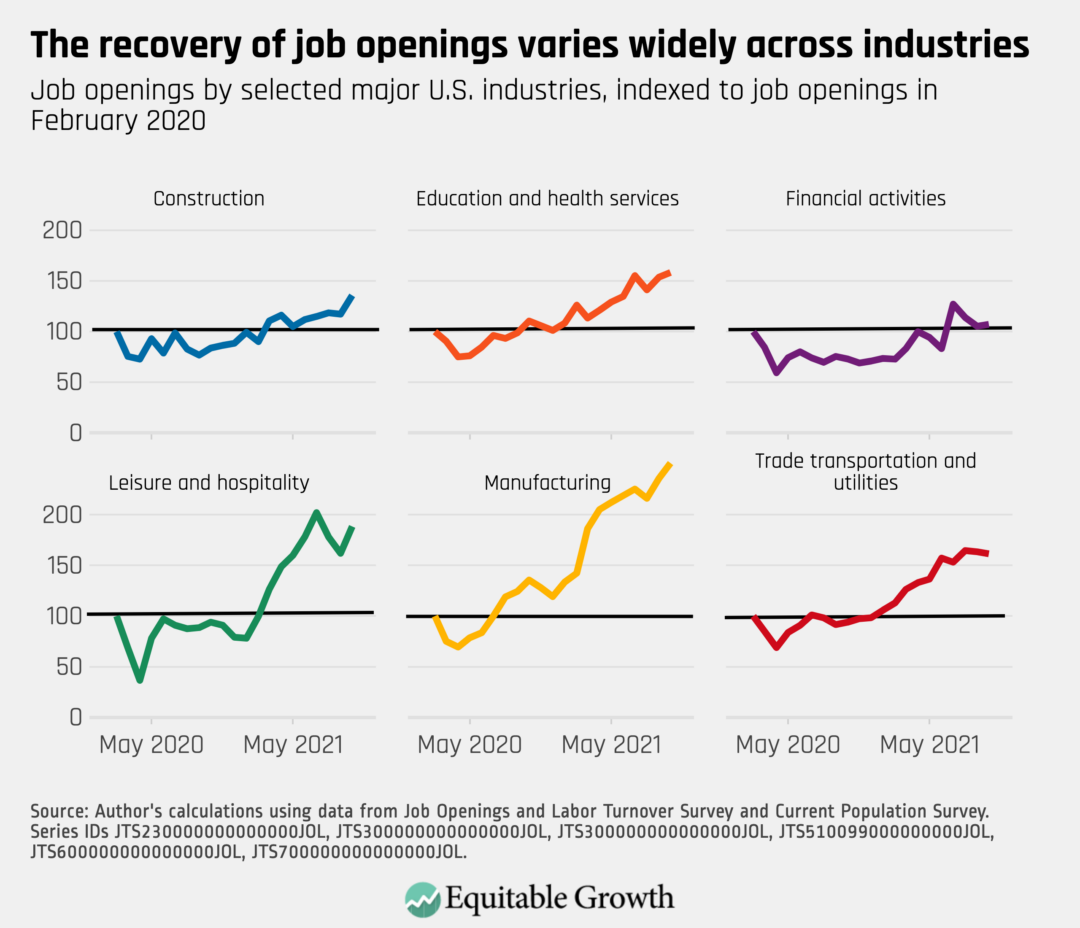
Job openings rose by 431,000 in October, with growth in several industries such as construction, manufacturing, and leisure and hospitality.

Job openings by selected major U.S. industries, indexed to job openings in February 2020

The ratio of unemployed-worker-per-job-opening remains extremely low, falling from 0.72 in September to 0.67 in October. At the same time, 255,000 workers left the labor force in October.

U.S. unemployed workers per total nonfarm job opening, 2001-2020. Recessions are shaded.

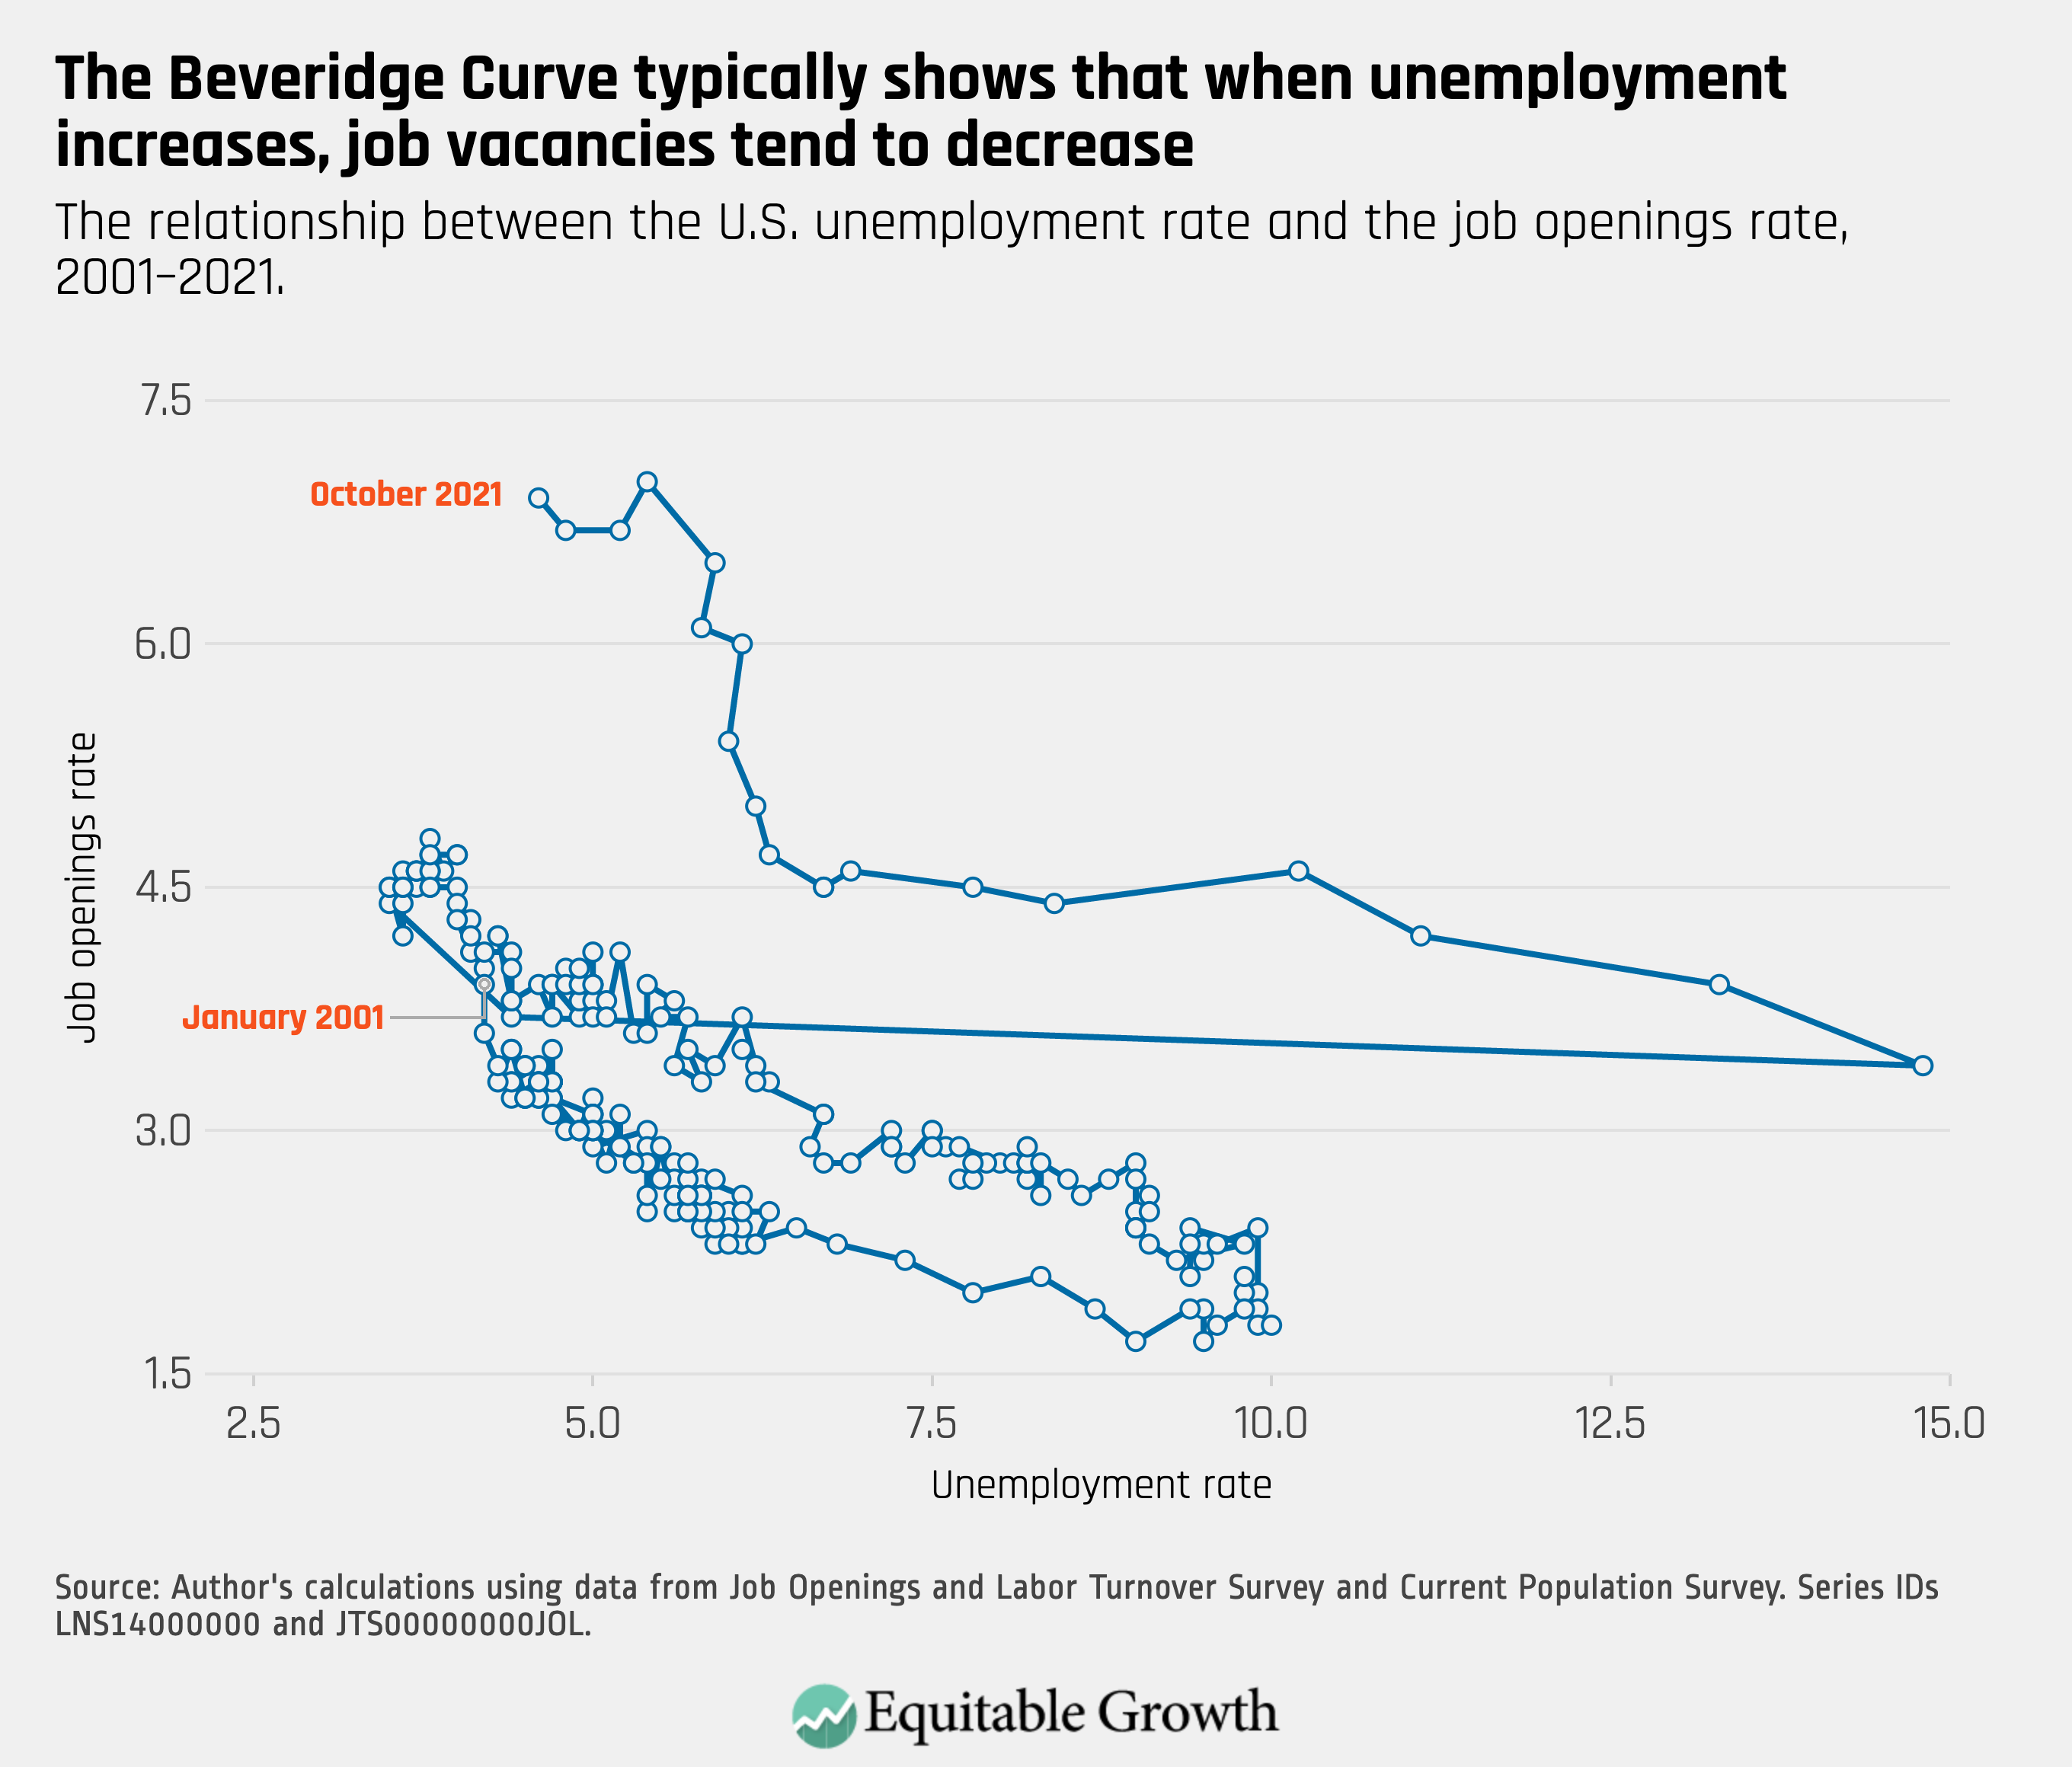
With the unemployment rate declining to 4.6 percent and the job openings rate increasing to 6.9 percent, the Beveridge Curve continues to move in atypical territory, reflecting the unique nature of the present job market.

The relationship between the U.S. unemployment rate and the job openings rate, 2001–2021
Connect with us!

Explore the Equitable Growth network of experts around the country and get answers to today's most pressing questions!

Get in Touch