JOLTS Day Graphs: November 2019 Report Edition

Every month the U.S. Bureau of Labor Statistics releases data on hiring, firing, and other labor market flows from the Job Openings and Labor Turnover Survey, better known as JOLTS. Today, the BLS released the latest data for November 2019. This report doesn’t get as much attention as the monthly Employment Situation Report, but it contains useful information about the state of the U.S. labor market. Below are a few key graphs using data from the report.

1.

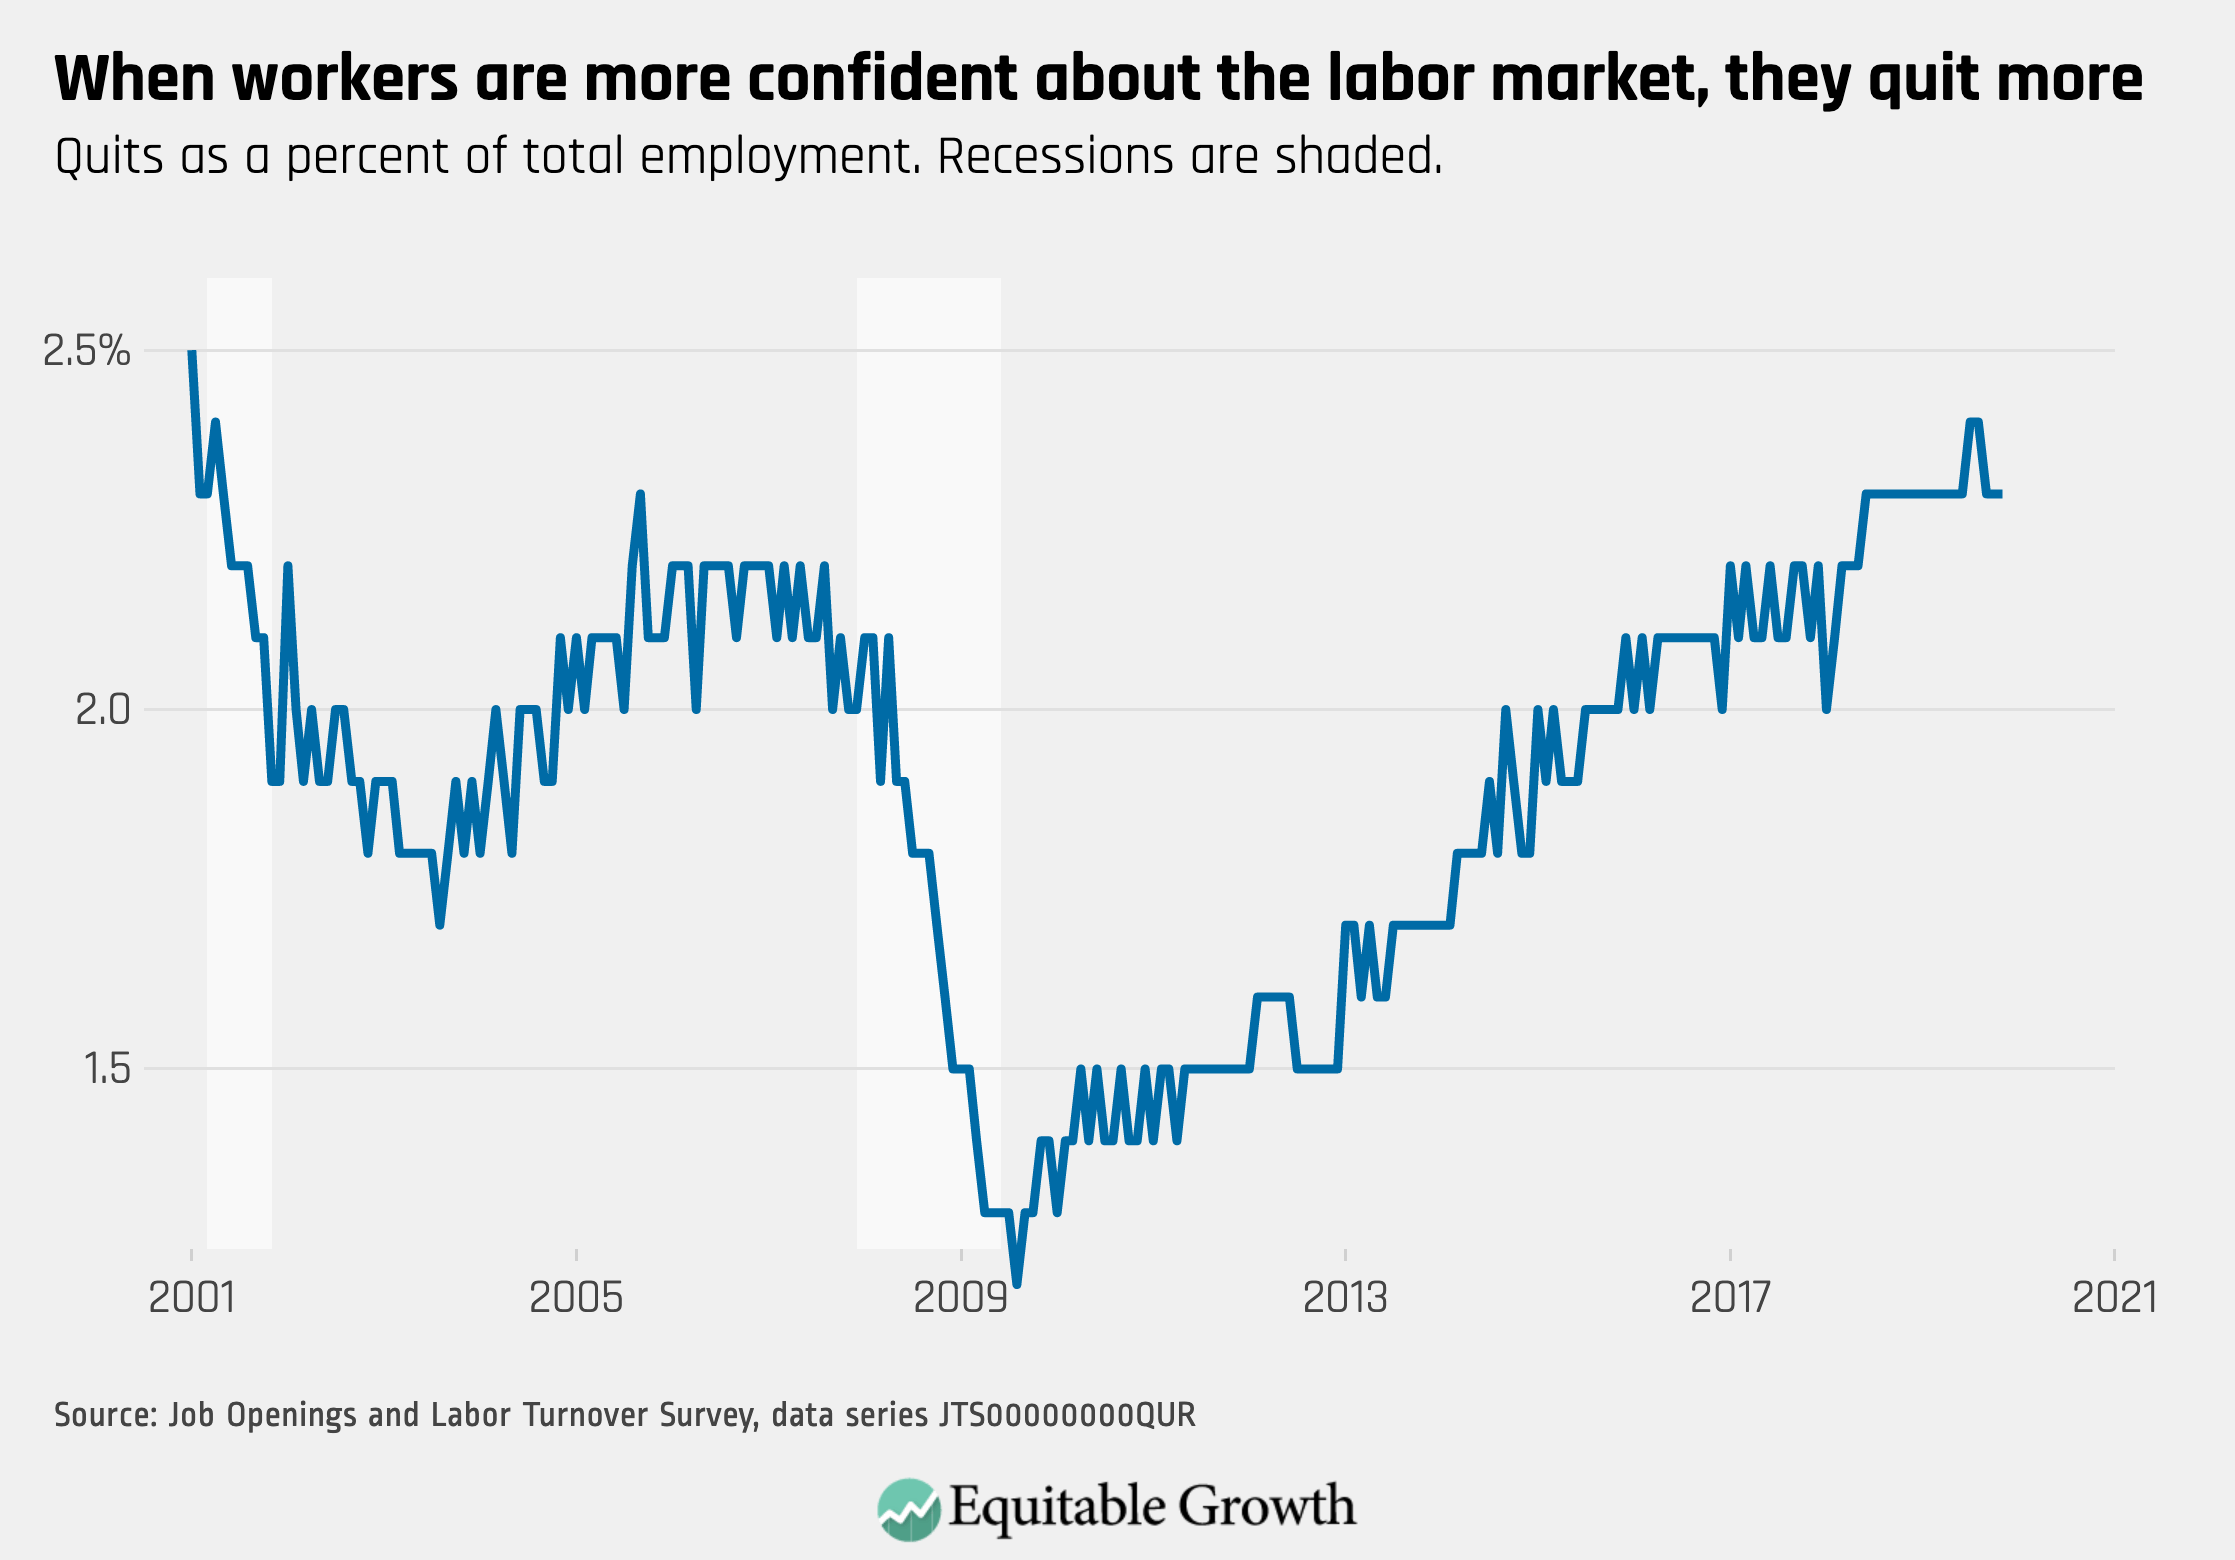
The quits rate held at 2.3% in November, maintaining a healthy rate in an expansionary labor market.

2.

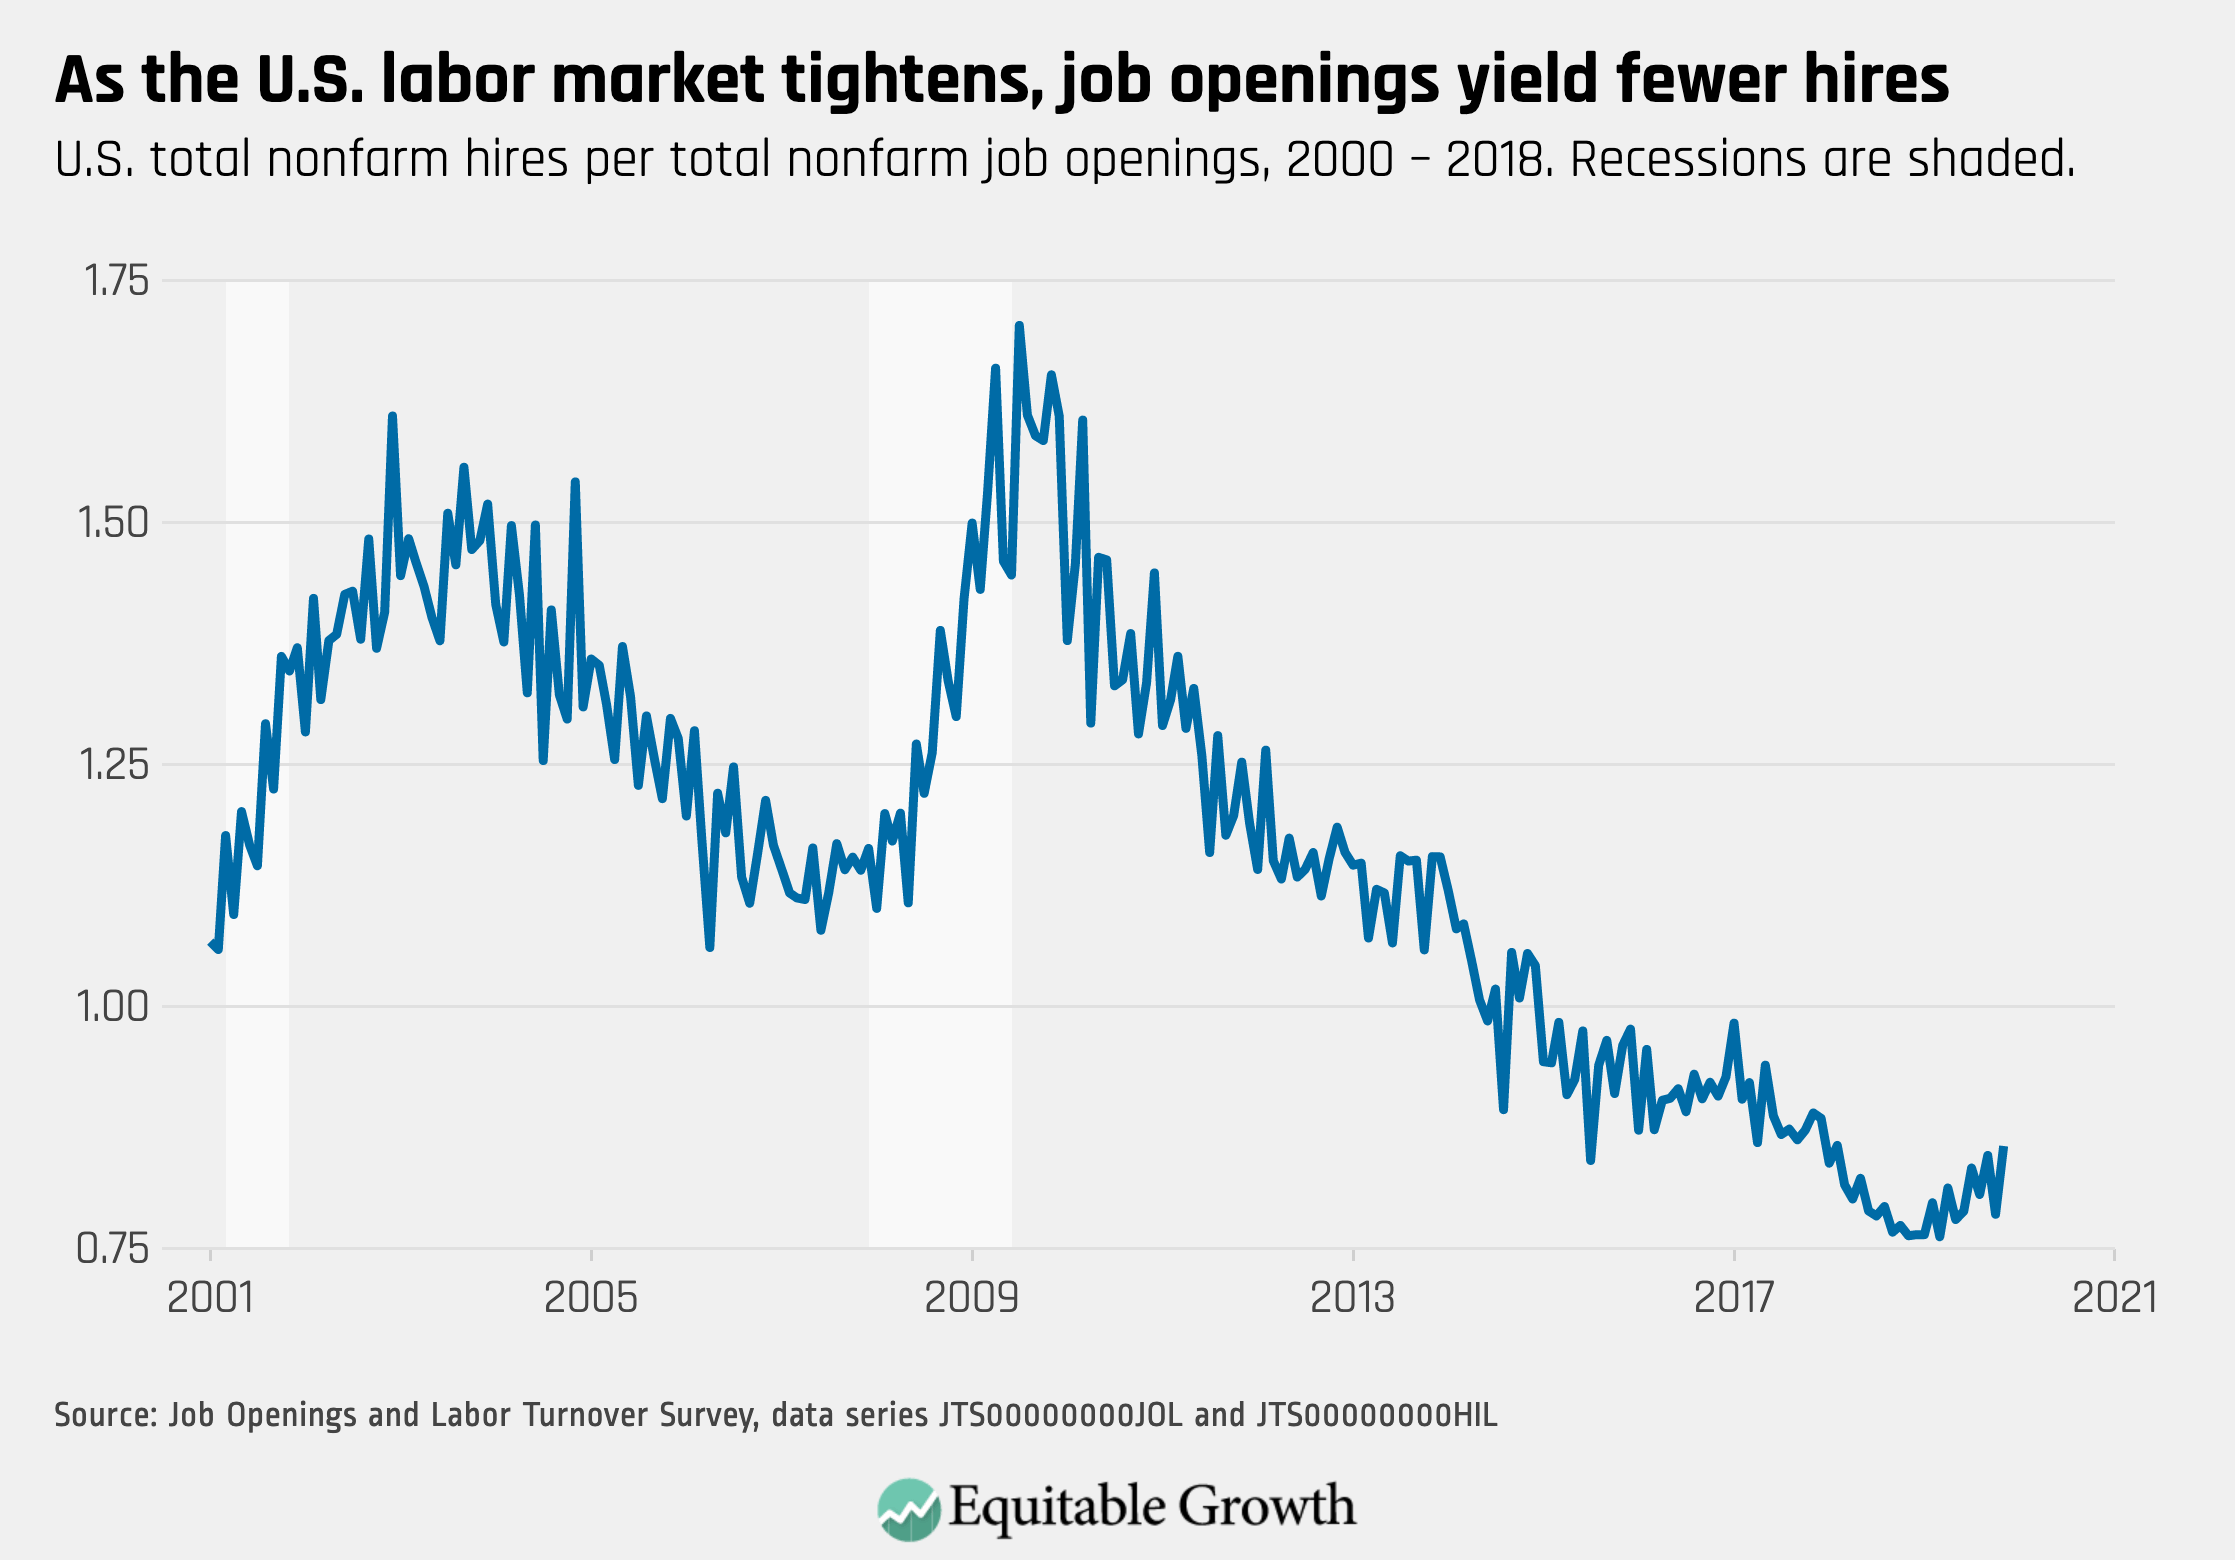
The vacancy yield increased to 0.86 in November, from 0.79 in October, as the rate of hires stayed the same while the rate of job openings declined.

3.

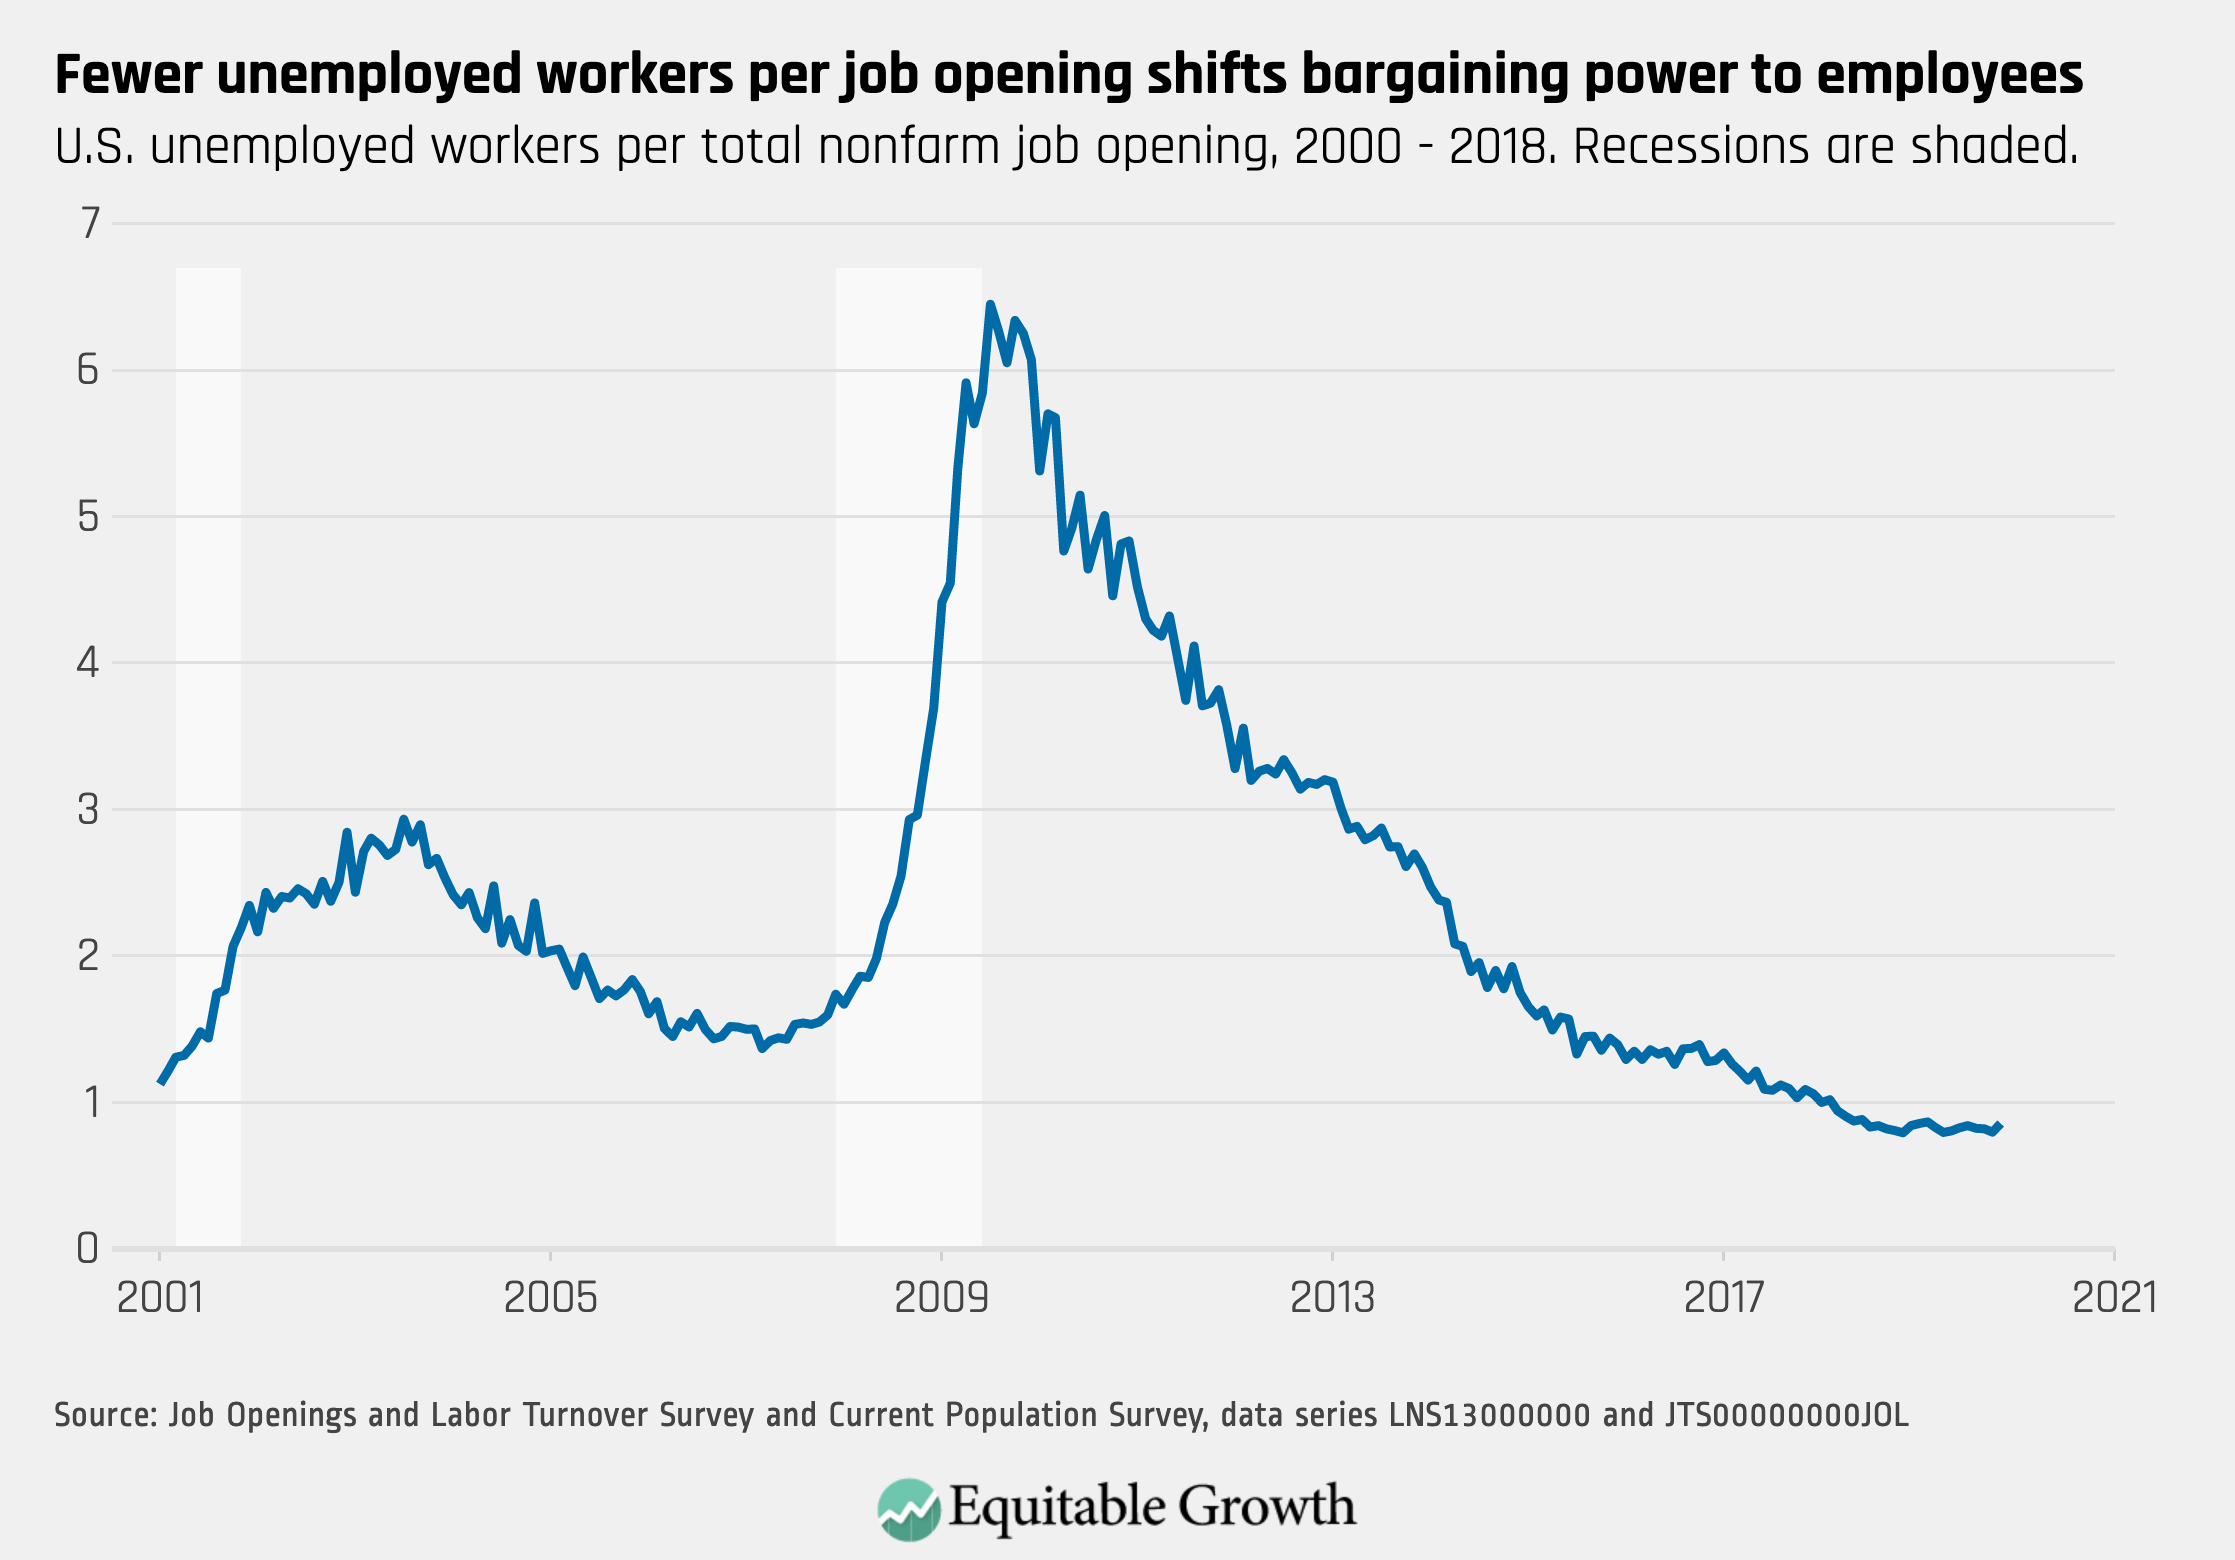
The ratio of unemployed workers to job openings increased slightly as job openings declined in November, but it remains at historically low levels under 1.0.
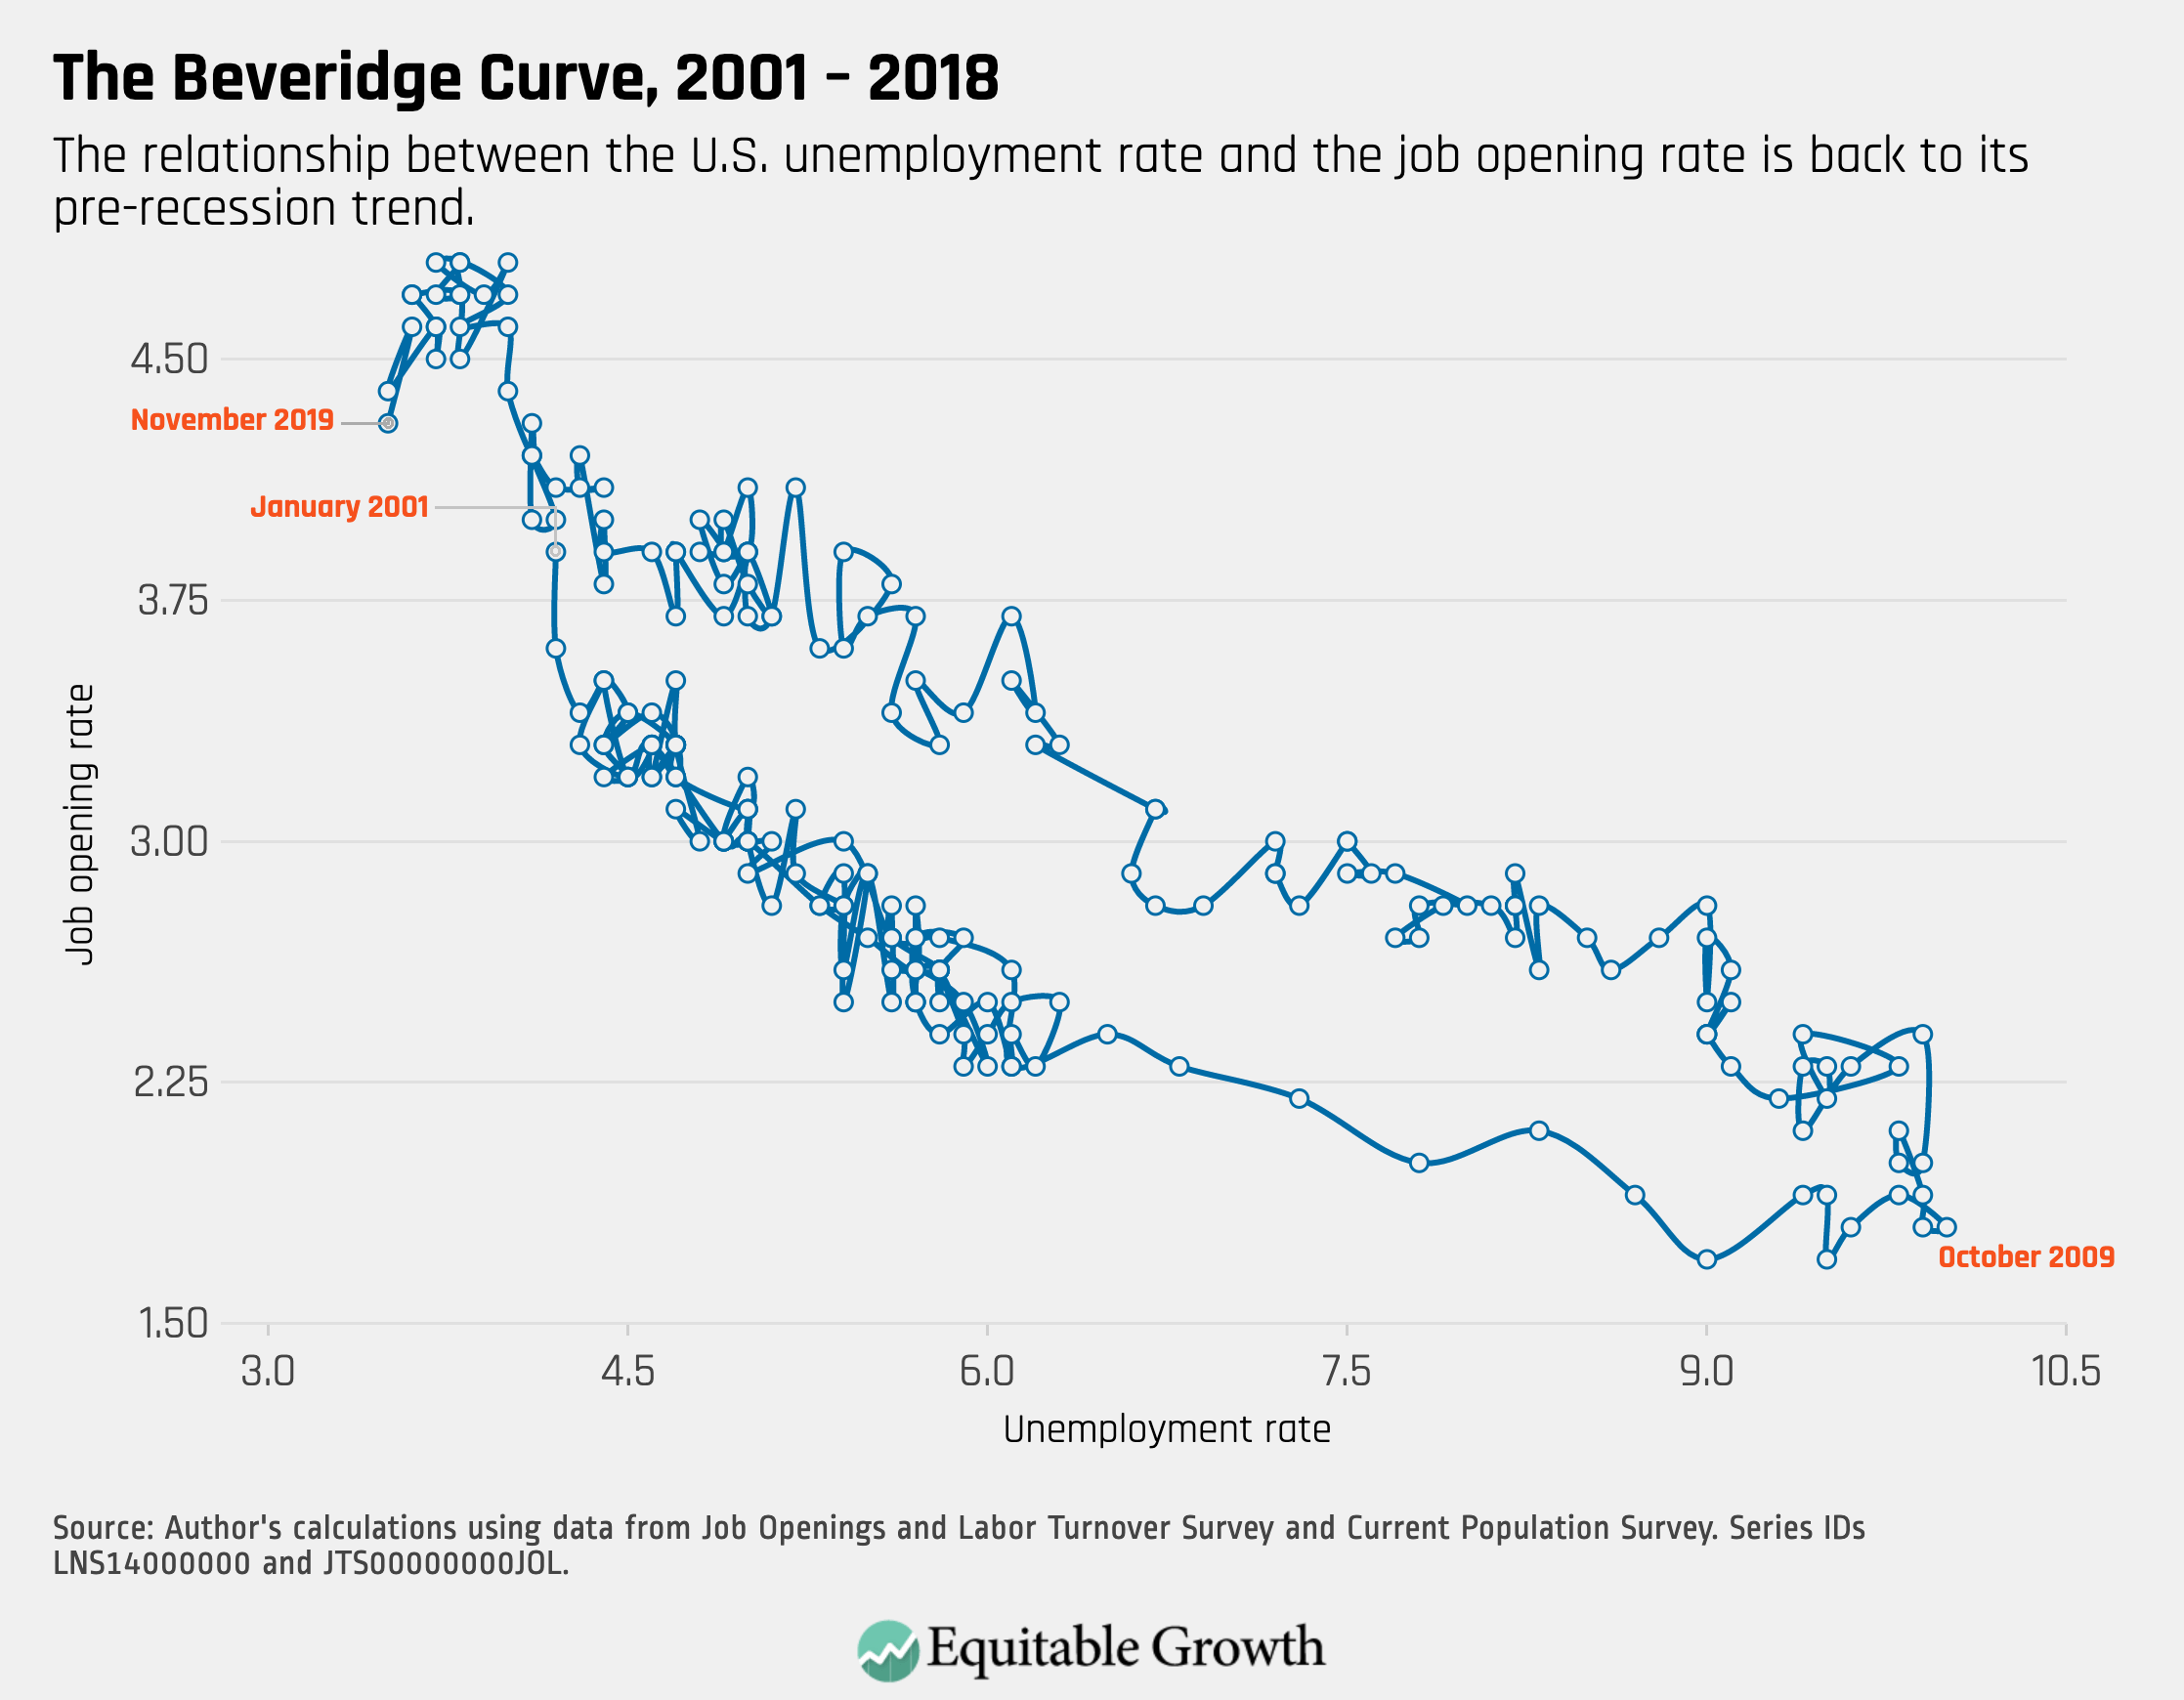
4.

The Beveridge Curve continues to reflect an expansionary labor market, above its level during the early 2000s expansion.

January 17, 2020

Topics

Job Mobility

Connect with us!

Explore the Equitable Growth network of experts around the country and get answers to today's most pressing questions!

Get in Touch