Every month the U.S. Bureau of Labor Statistics releases data on hiring, firing, and other labor market flows from the Job Openings and Labor Turnover Survey, better known as JOLTS. Today, the BLS released the latest data for May 2020. This report doesn’t get as much attention as the monthly Employment Situation Report, but it contains useful information about the state of the U.S. labor market. Below are a few key graphs using data from the report.
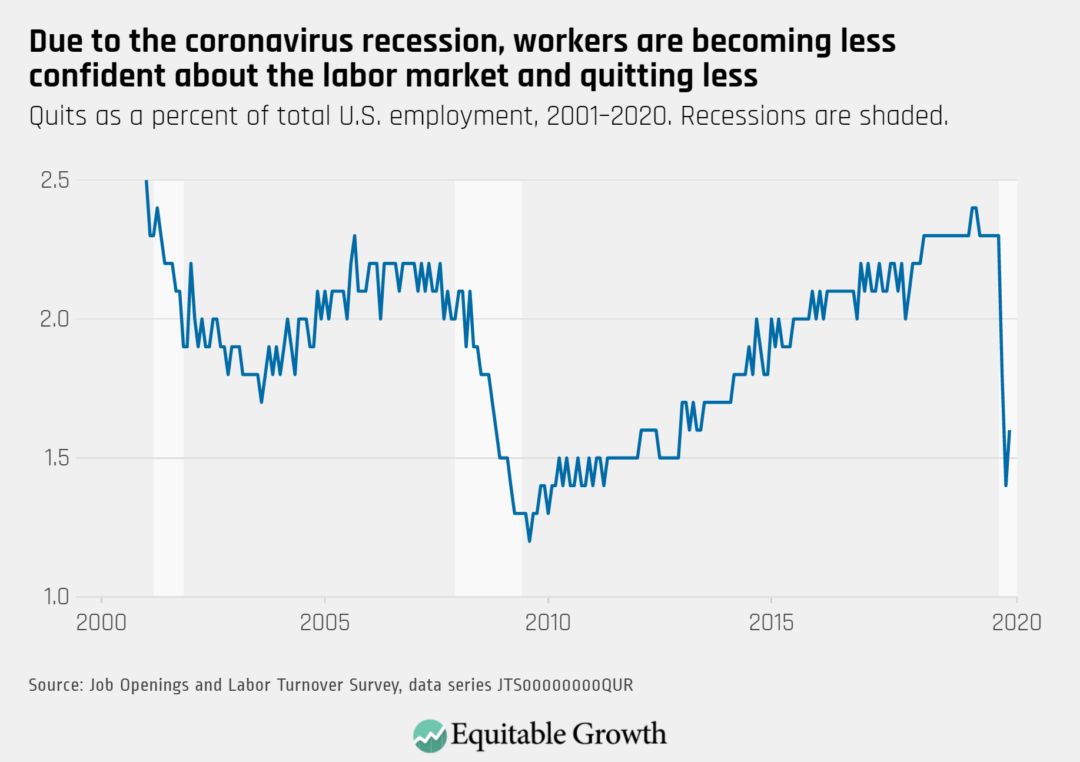
The quit rate rebounded slightly to 1.6% in May, but remains far below its high of 2.3% in February.
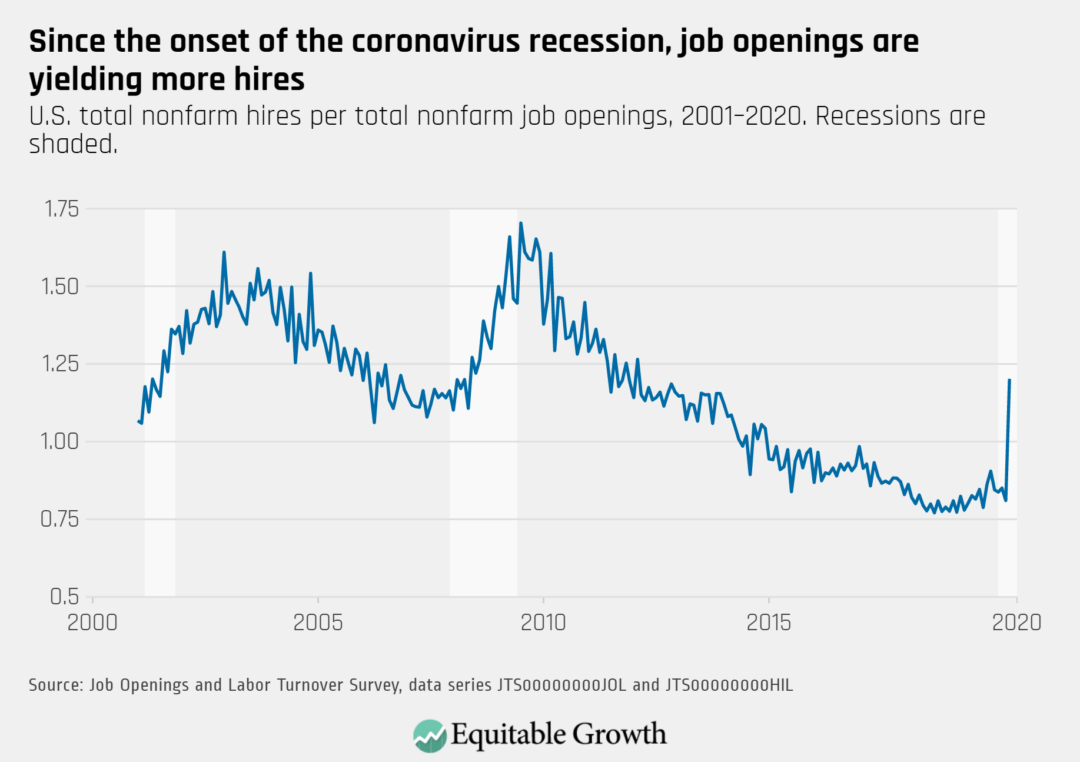
As state economies began re-opening, the vacancy yield increased, reflecting a series of 6.5 million new hires in May.
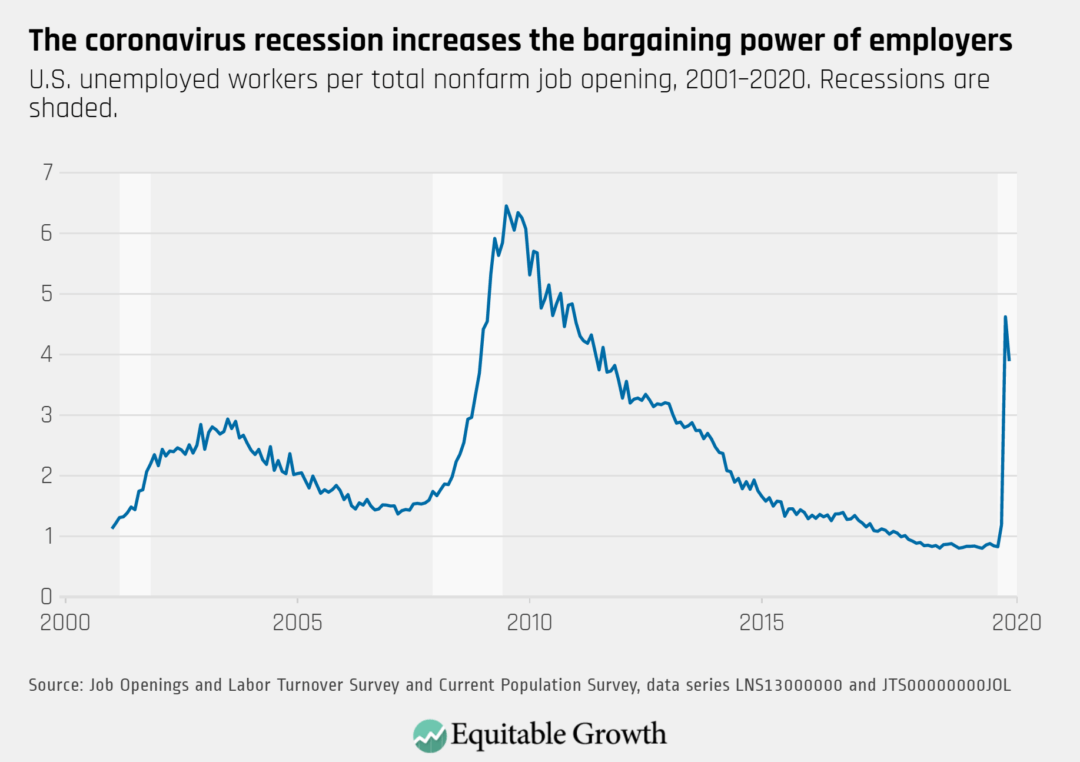
Despite an increase in job openings and a decrease in unemployment, there were still nearly four unemployed workers for every job opening in May.
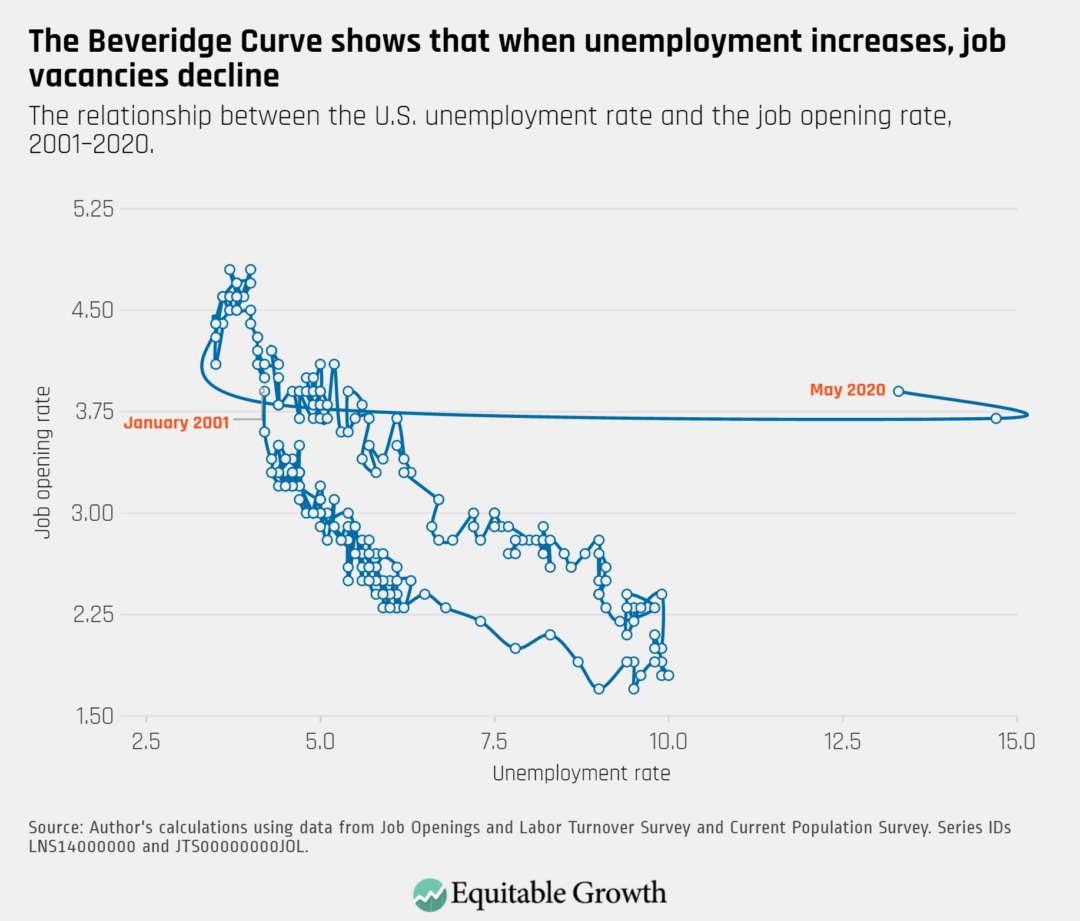
The Beveridge Curve moved slightly back toward normal cyclical territory in May, as the job opening rate changed little and the unemployment rate decreased more significantly.