JOLTS Day Graphs: March 2022 Edition
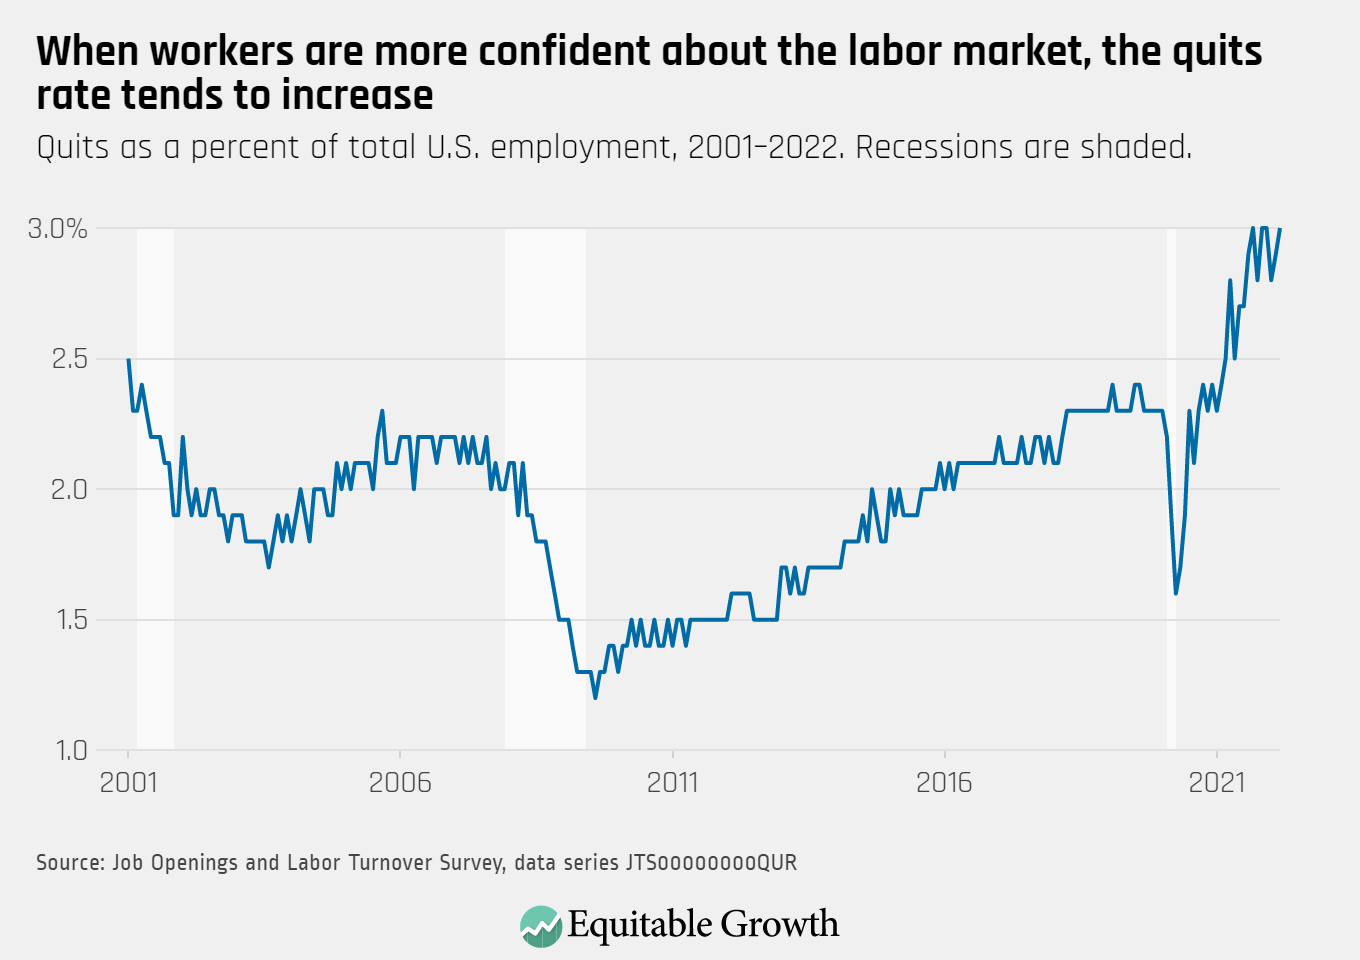
The quits rate increased slightly to 3.0 percent as 4.5 million workers quit their jobs in March, an increase of 152,000 from the previous month.
![Quits as a percent of total U.S. employment, 2001–2022. Recessions are shaded.](https://equitablegrowth.org/wp-content/uploads/2022/05/When-workers-are-more-confident-about-the-labor-market-the-quits-rate-tends-to-increase-1080x762.png)
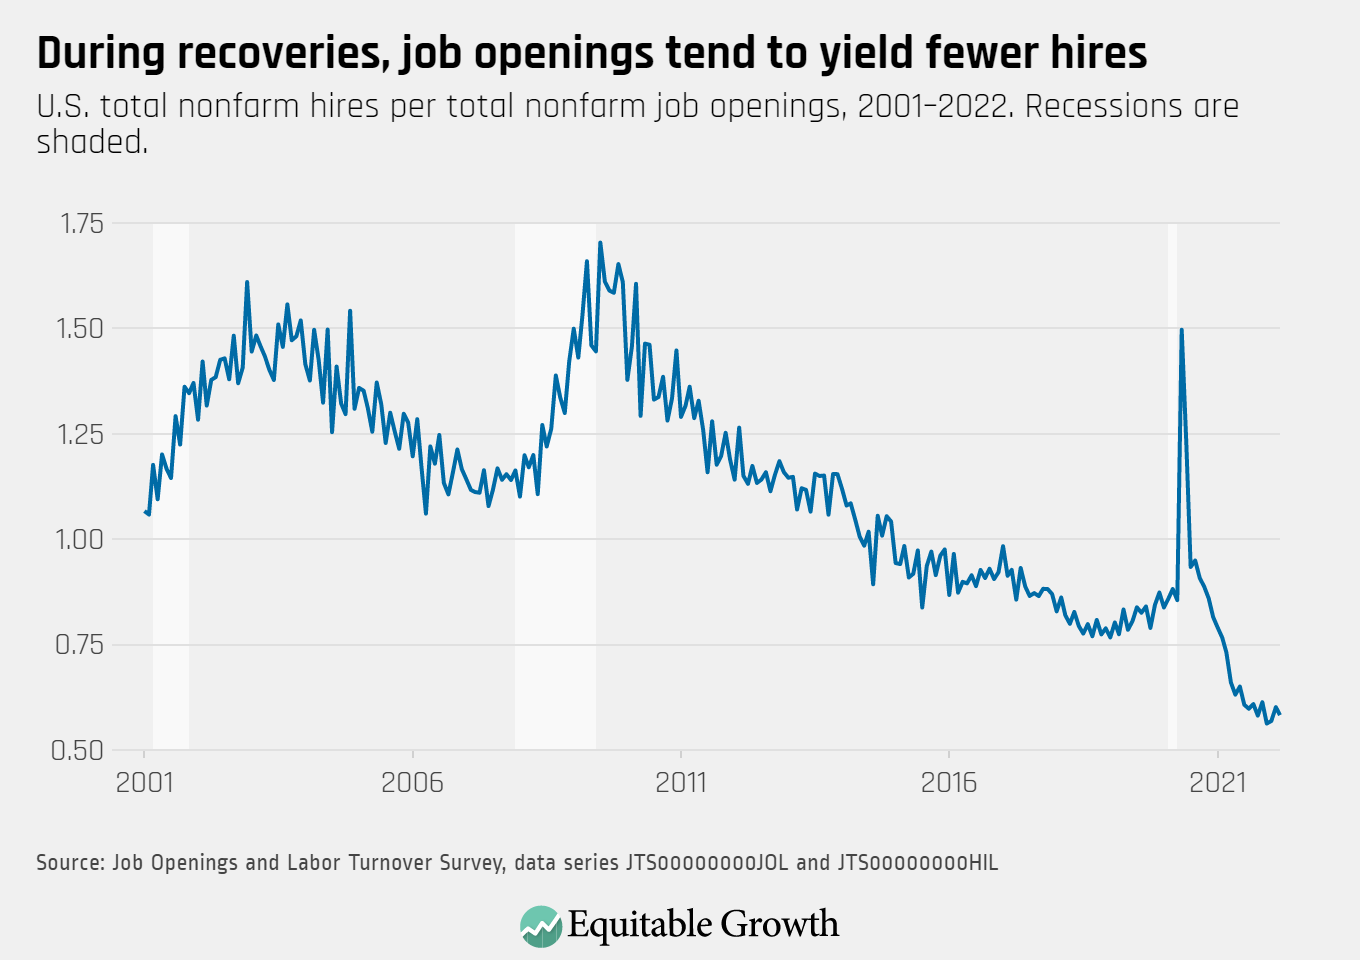
With the number of job openings reaching a series high of 11.5 million and hires at 6.7 million, the vacancy yield decreased to 0.58 in March.
![U.S. total nonfarm hires per total nonfarm job openings, 2001–2022. Recessions are shaded.](https://equitablegrowth.org/wp-content/uploads/2022/05/During-recoveries-job-openings-tend-to-yield-fewer-hires-1080x762.png)
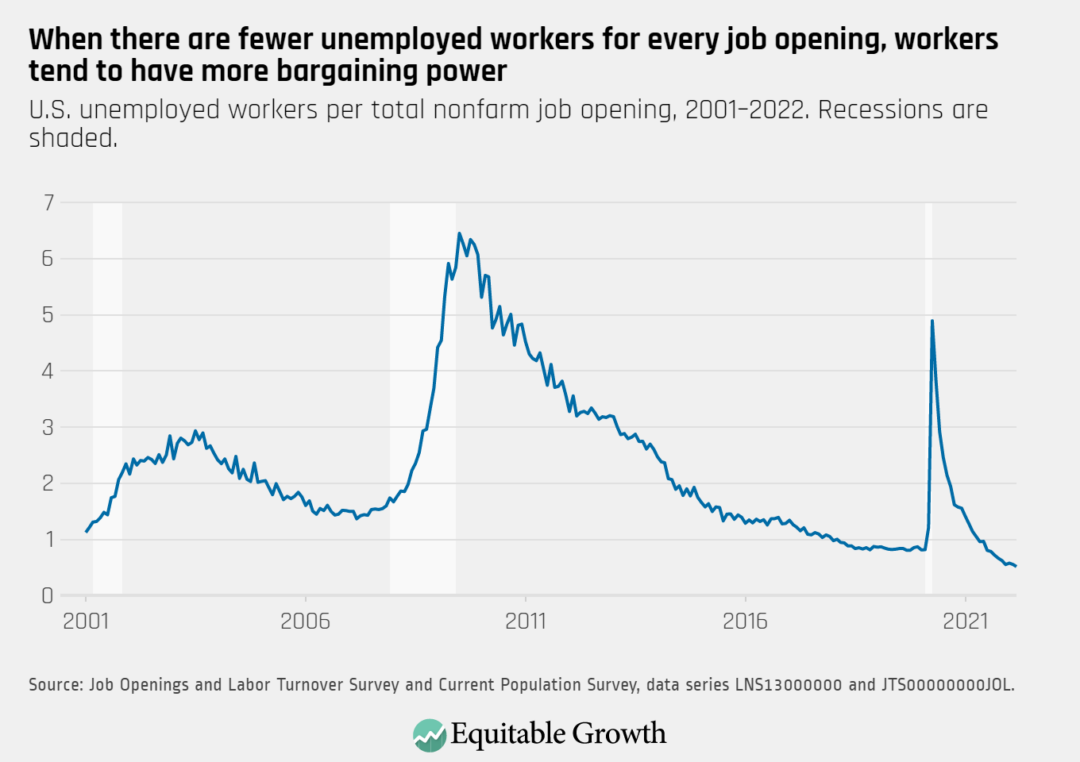
The ratio of unemployed-worker-per-job-opening declined from 0.55 unemployed workers per job opening in February to 0.52 in March.
![U.S. unemployed workers per total nonfarm job opening, 2001–2022. Recessions are shaded.](https://equitablegrowth.org/wp-content/uploads/2022/05/When-there-are-fewer-unemployed-workers-for-every-job-opening-workers-tend-to-have-more-bargaining-power-1080x762.png)
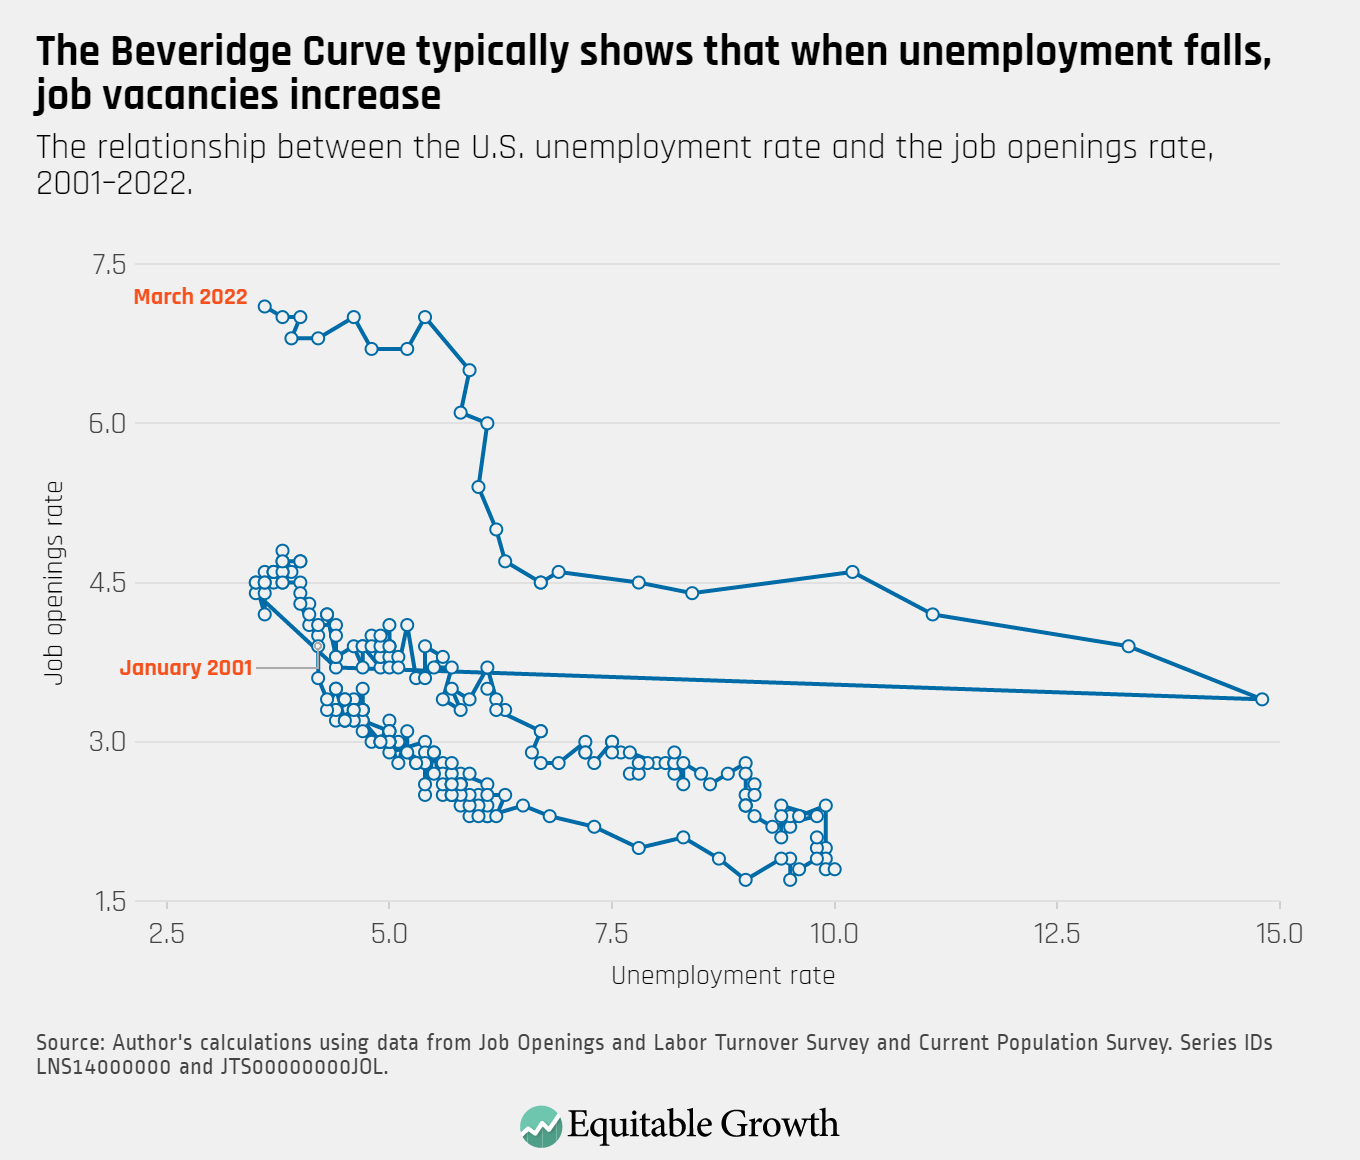
The Beveridge Curve continues to be in an atypical range in March compared to previous business cycles, as the unemployment rate declined and job openings increased.
![The relationship between the U.S. unemployment rate and the job openings rate, 2001–2022.](https://equitablegrowth.org/wp-content/uploads/2022/05/The-Beveridge-Curve-typically-shows-that-when-unemployment-falls-job-vacancies-increase-1080x921.png)