JOLTS Day Graphs: March 2021 Edition

Every month the U.S. Bureau of Labor Statistics releases data on hiring, firing, and other labor market flows from the Job Openings and Labor Turnover Survey, better known as JOLTS. Today, the BLS released the latest data for March 2021. This report doesn’t get as much attention as the monthly Employment Situation Report, but it contains useful information about the state of the U.S. labor market. Below are a few key graphs using data from the report.

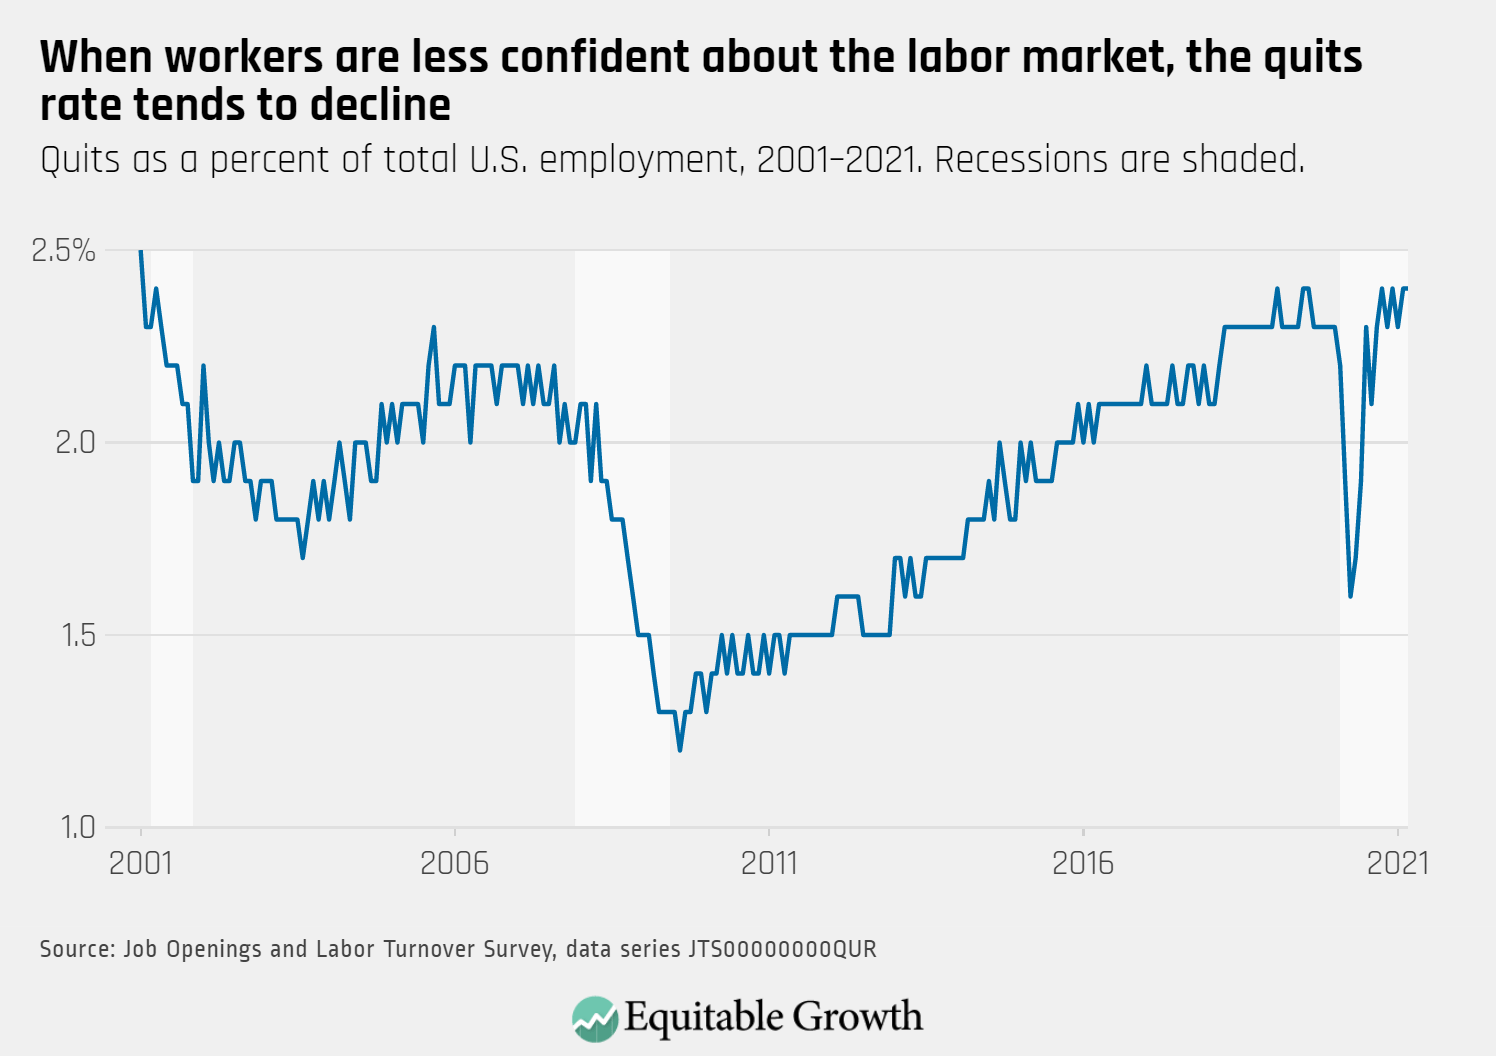
The quits rate remained unchanged at 2.4 percent in March, even as the job openings rate increased to 5.3 percent.

Quits as a percent of total U.S. employment, 2001-2021. Recessions are shaded.

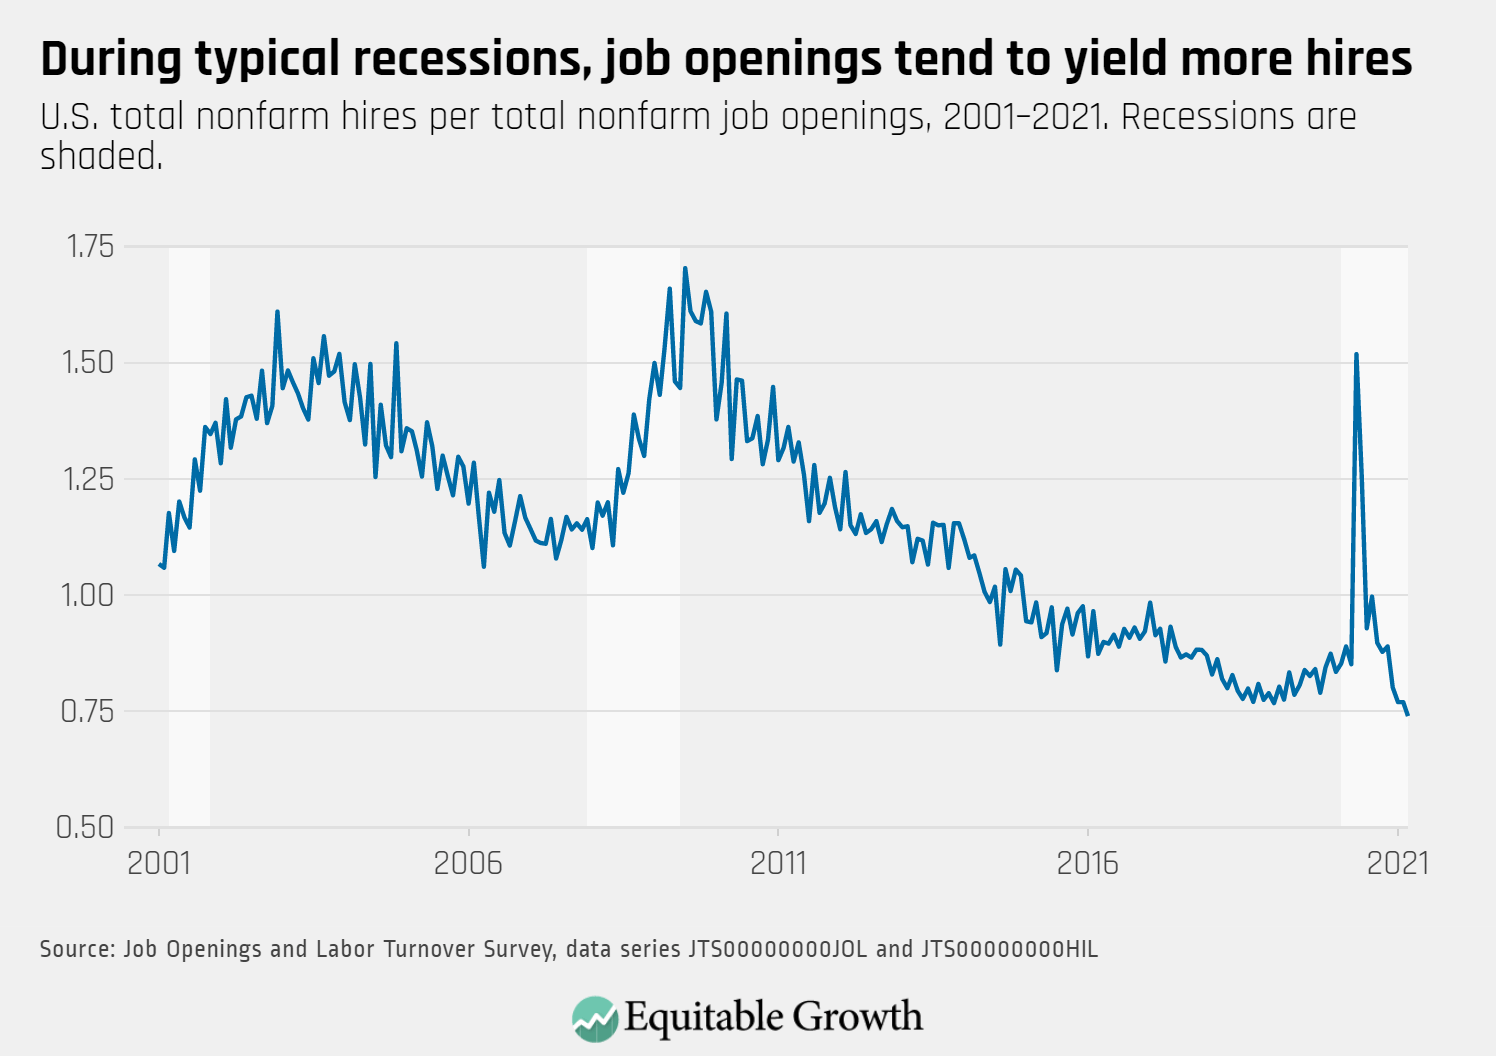
Job openings reached a series high, yet hires were little changed as the vacancy yield declined in March.

U.S. total nonfarm hires per total nonfarm job openings, 2001-2021. Recessions are shaded.

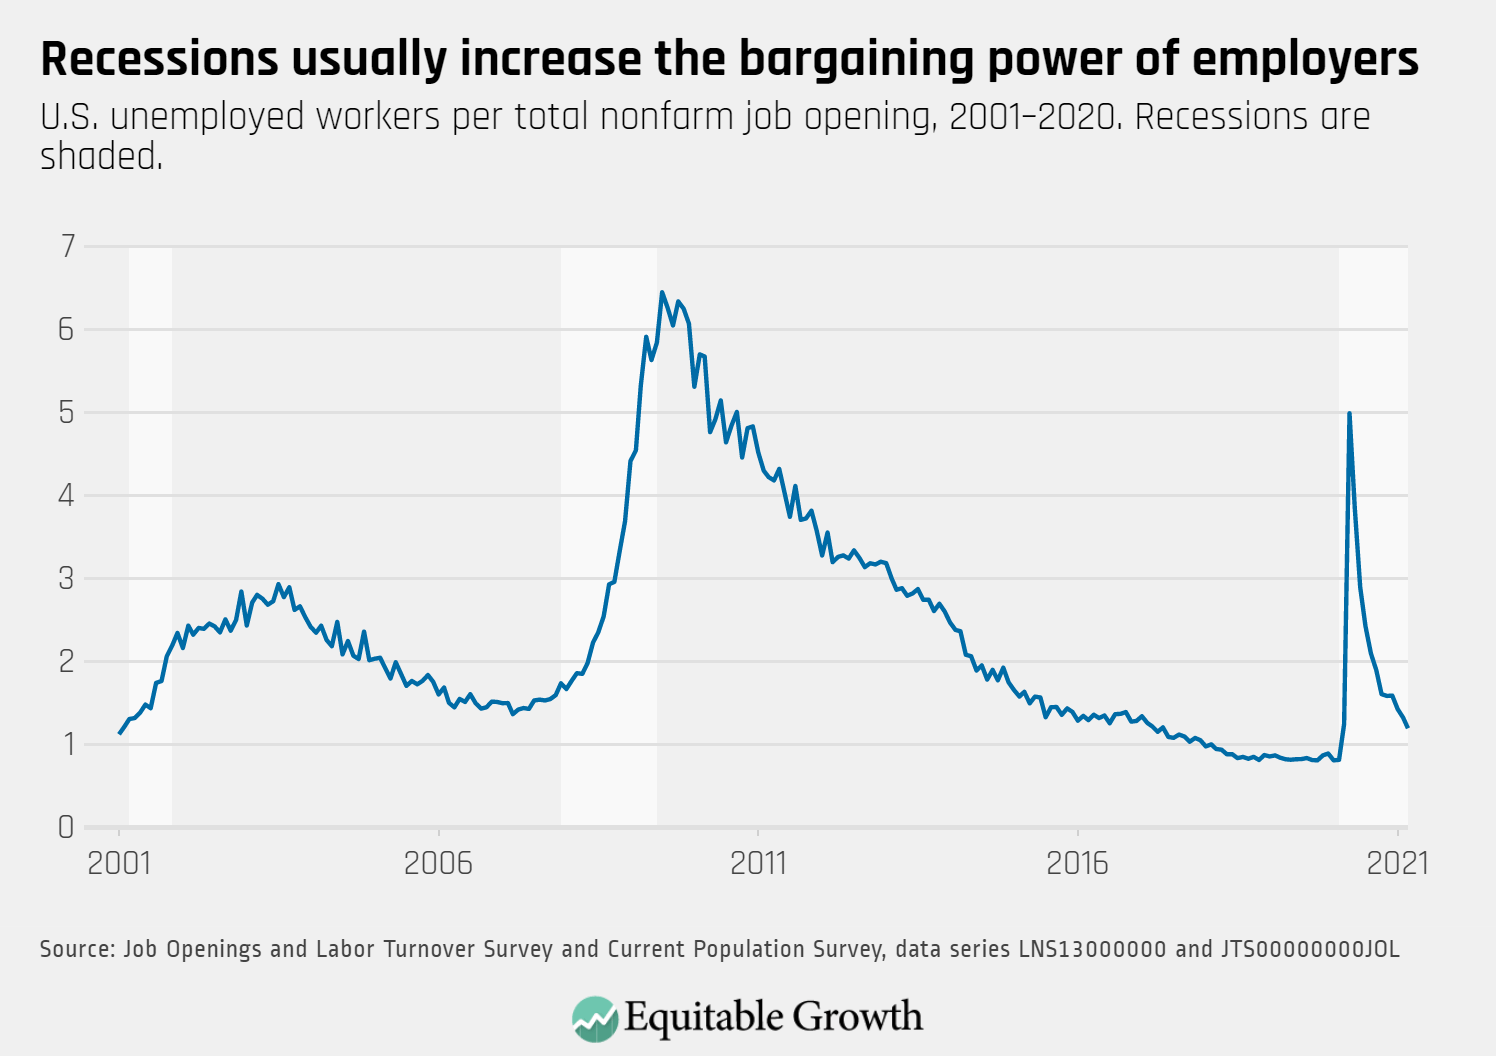
There were 1.2 unemployed workers for every job opening in March as unemployment decreased.

U.S. unemployed workers per total nonfarm job opening, 2001-2020. Recessions are shaded.

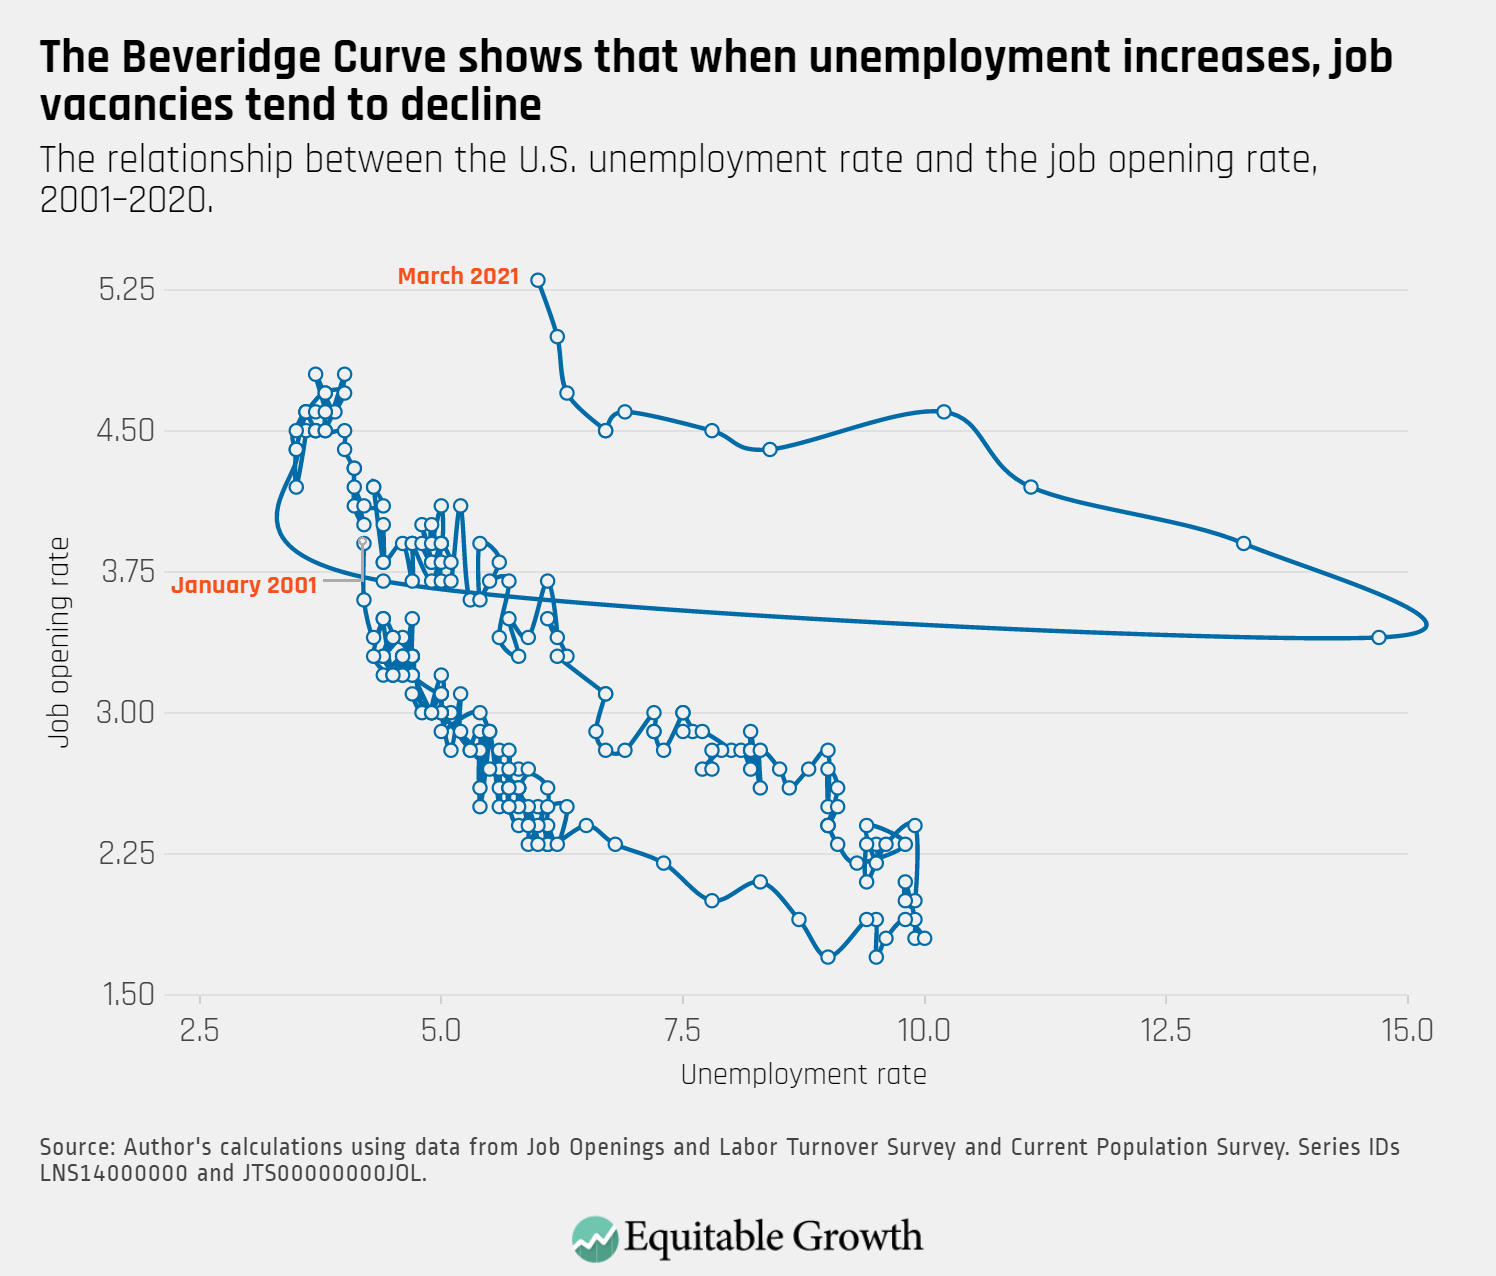
With a slight decrease in the unemployment rate and the job openings rate reaching a series high, the Beveridge Curve continues to move in atypical territory, reflecting the unique nature of this downturn.

The relationship between the U.S. unemployment rate and the job opening rate, 2001-2020.
Connect with us!

Explore the Equitable Growth network of experts around the country and get answers to today's most pressing questions!

Get in Touch