JOLTS Day Graphs: March 2020 Report Edition
Every month the U.S. Bureau of Labor Statistics releases data on hiring, firing, and other labor market flows from the Job Openings and Labor Turnover Survey, better known as JOLTS. Today, the BLS released the latest data for March 2020. This report doesn’t get as much attention as the monthly Employment Situation Report, but it contains useful information about the state of the U.S. labor market. Below are a few key graphs using data from the report.
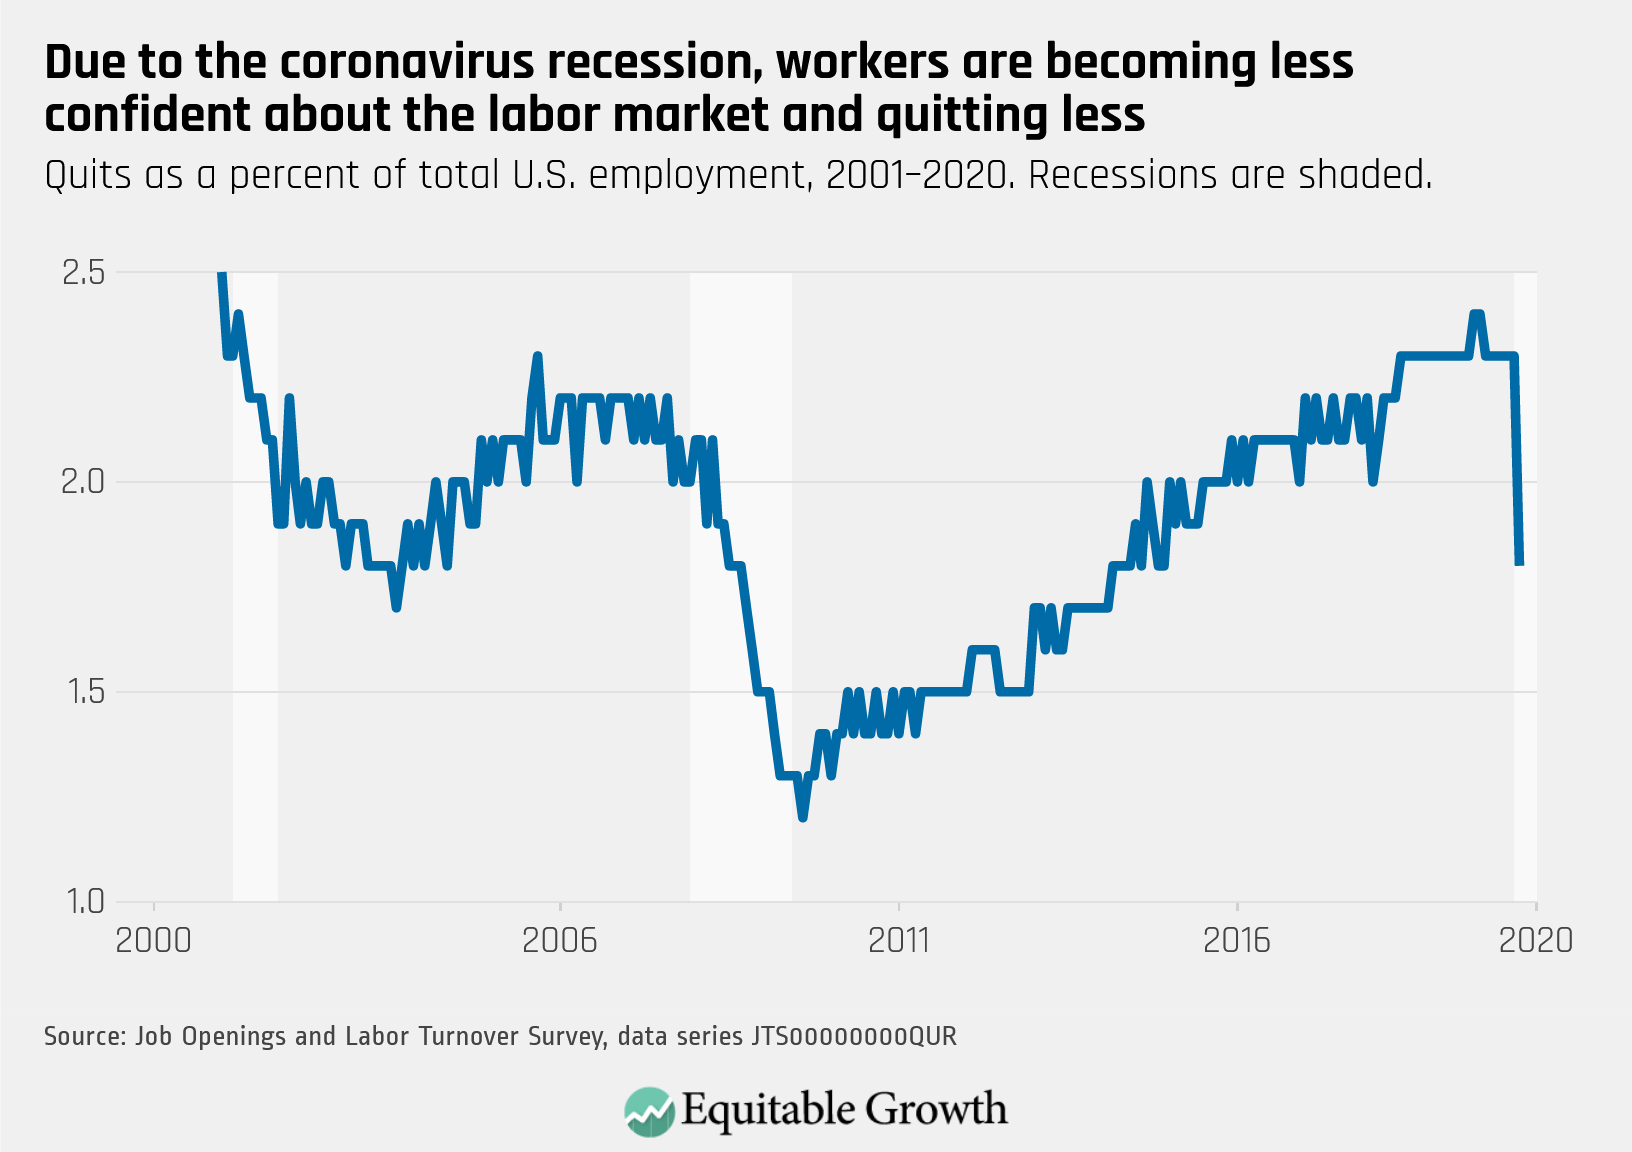
1.
The quits rate decreased sharply from 2.3% in February to 1.8% in March, as workers’ confidence about job prospects declined amid the public health crisis and requisite state shutdowns.
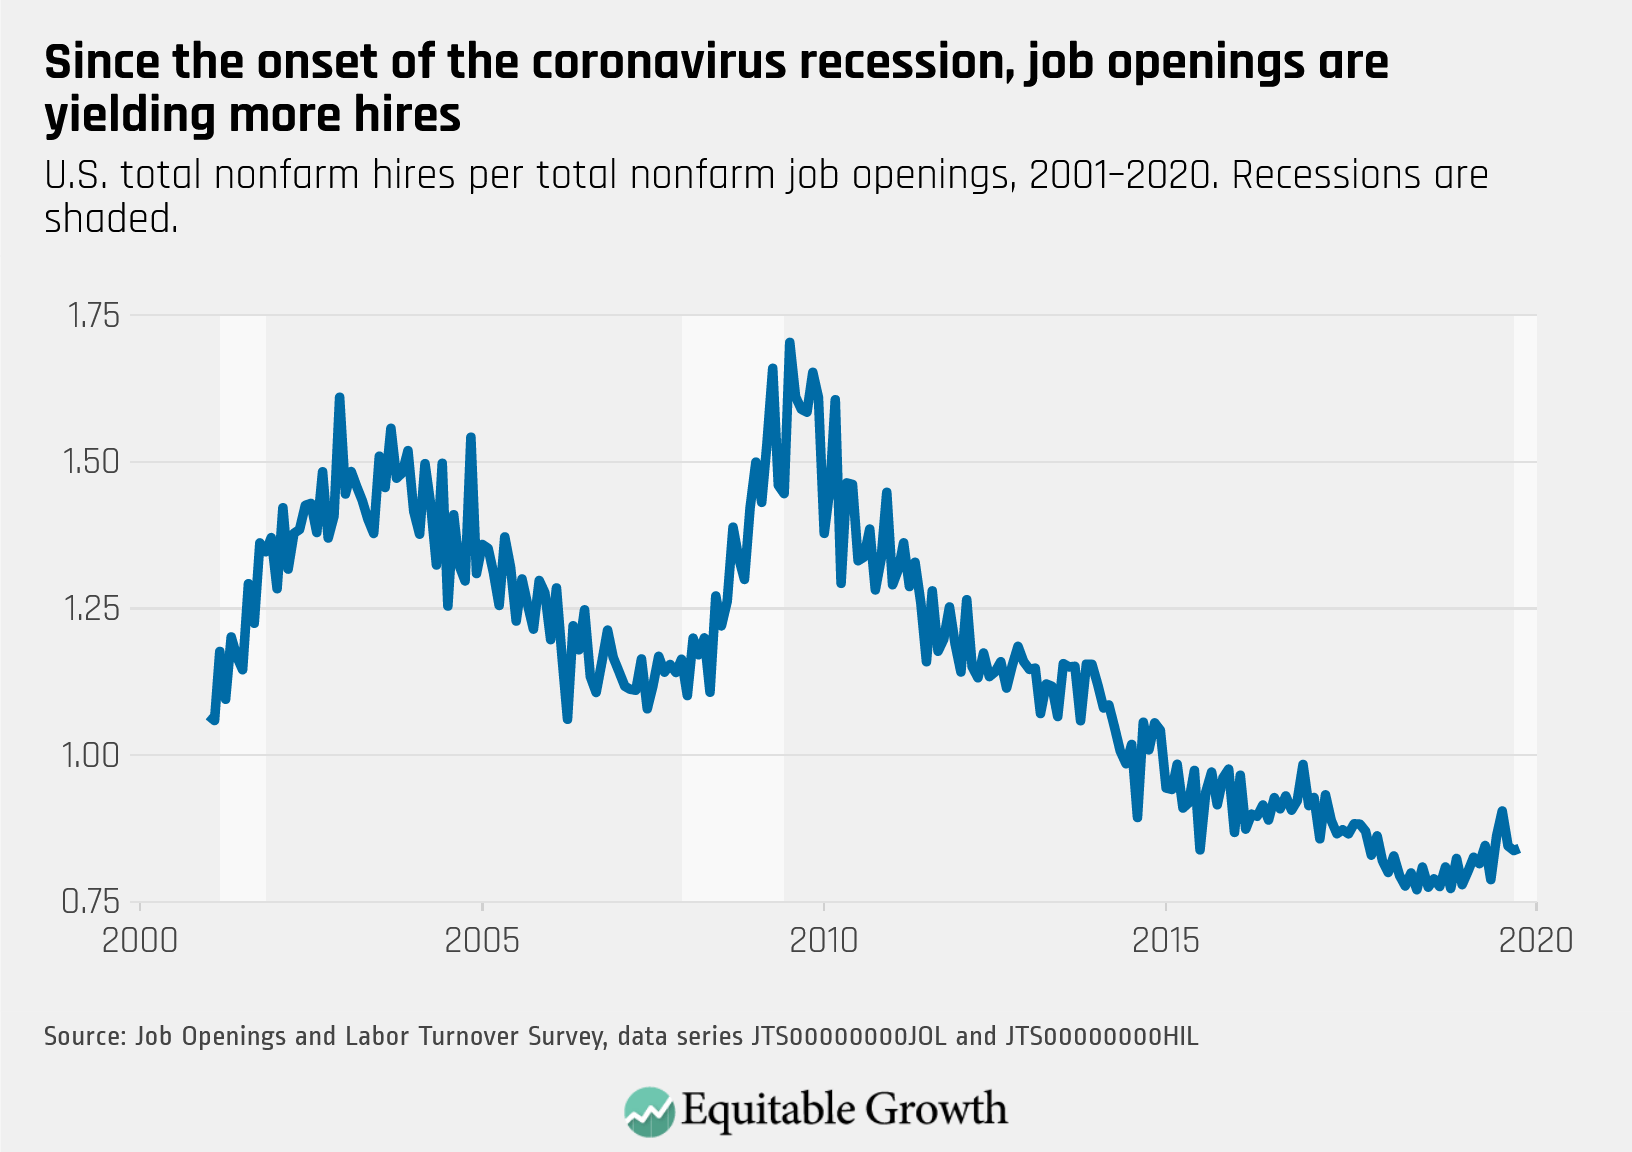
2.
While both the rates of job openings and hires decreased in March, openings did more so, leading to a slight increase in the vacancy yield.
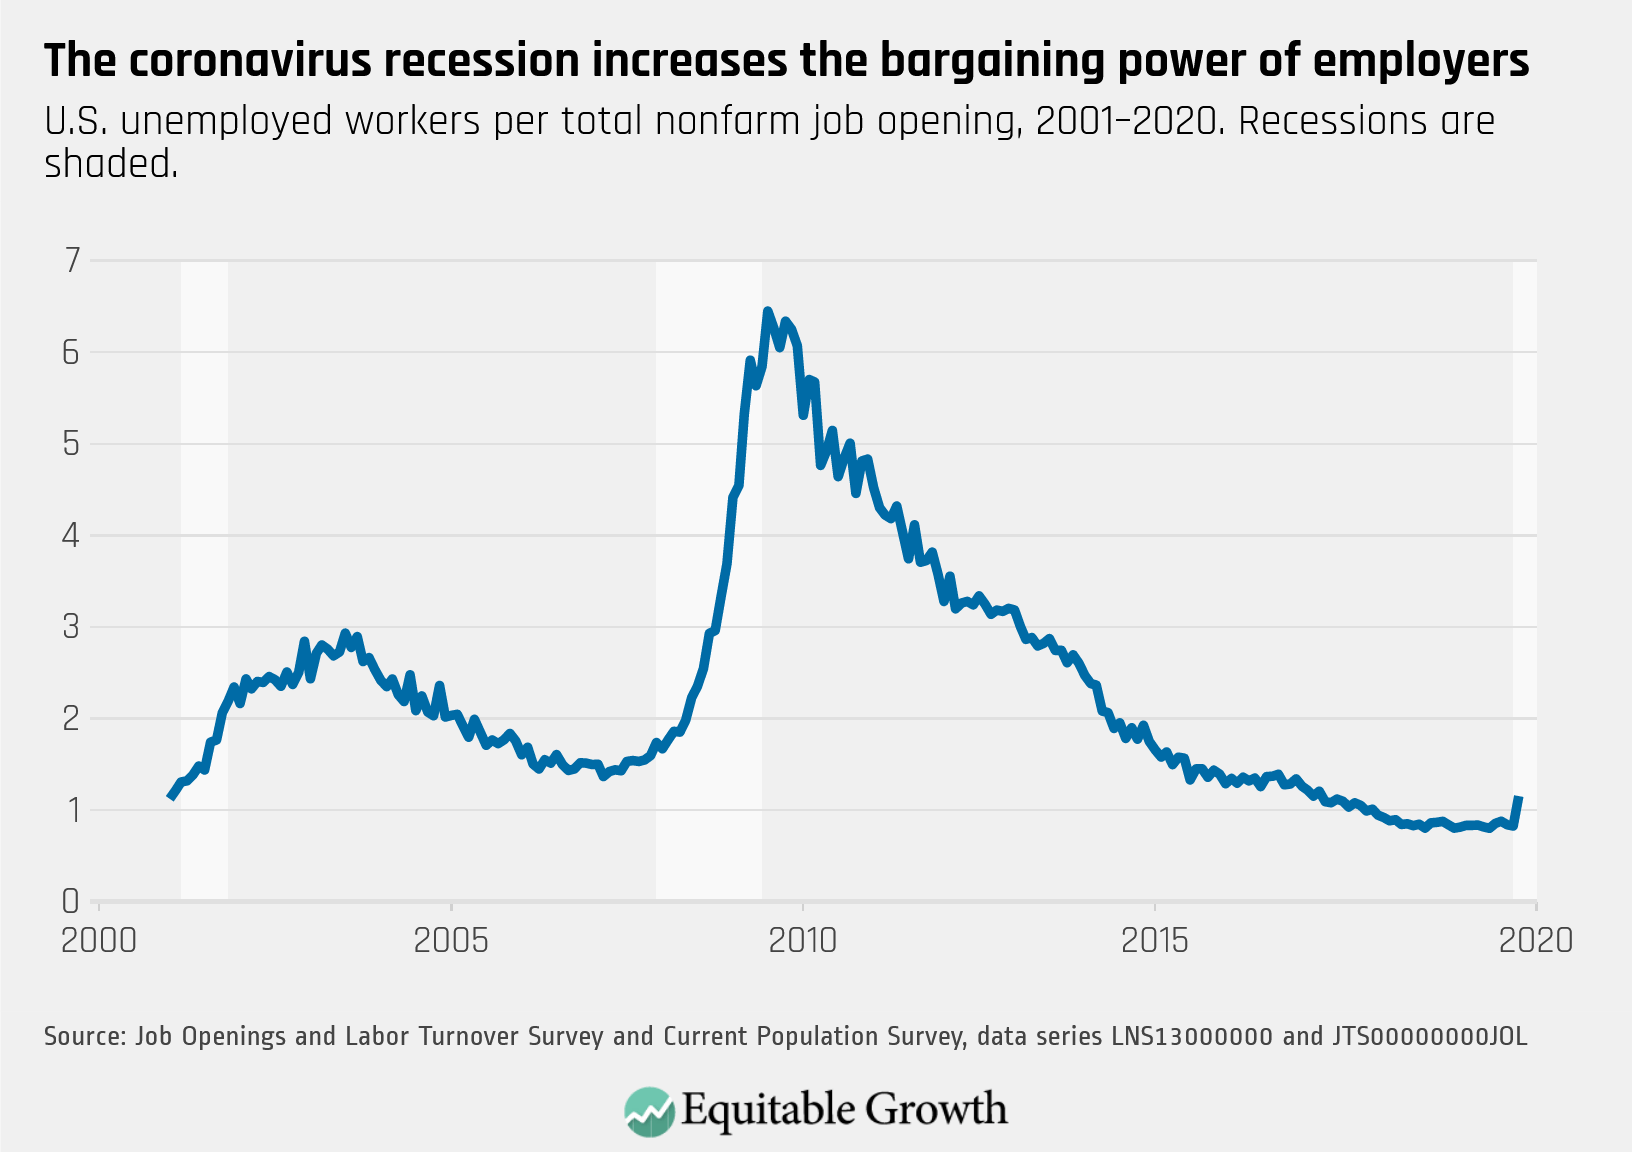
3.
As the unemployment rate began to increase in March, the ratio of unemployed-worker-per-job-opening rose above 1.0 for the first time since December 2017.
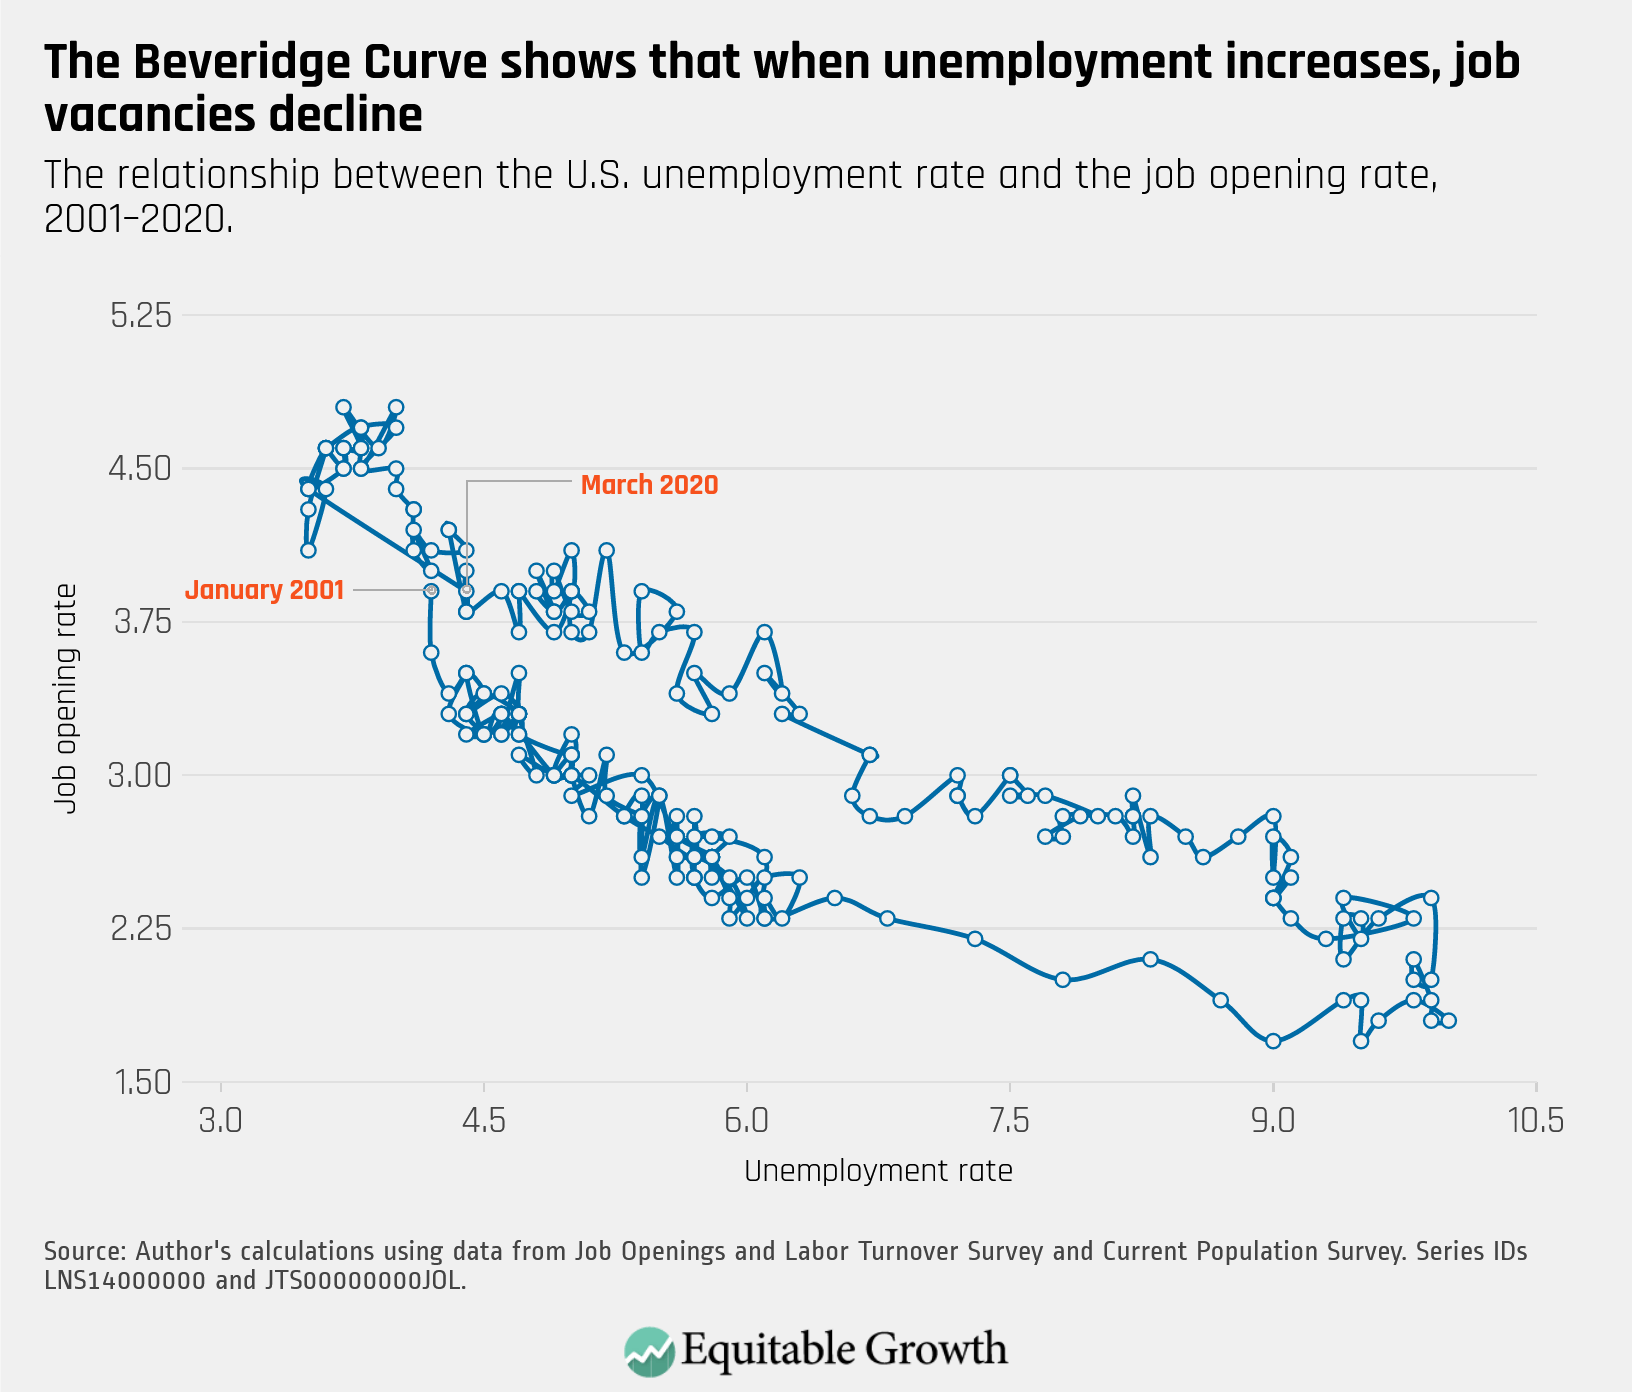
4.
The Beveridge curve dove down rightward in March as the unemployment rate increased and job opening rate decreased, suggesting the labor market downturn in the early coronavirus recession.