JOLTS Day Graphs: June 2017 Report Edition
Every month the U.S. Bureau of Labor Statistics releases data on hiring, firing, and other labor market flows from the Job Openings and Labor Turnover Survey, better known as JOLTS. Today, the BLS released the latest data for June 2017. This report doesn’t get as much attention as the monthly Employment Situation Report, but it contains useful information about the state of the U.S. labor market. Below are a few key graphs using data from the report.
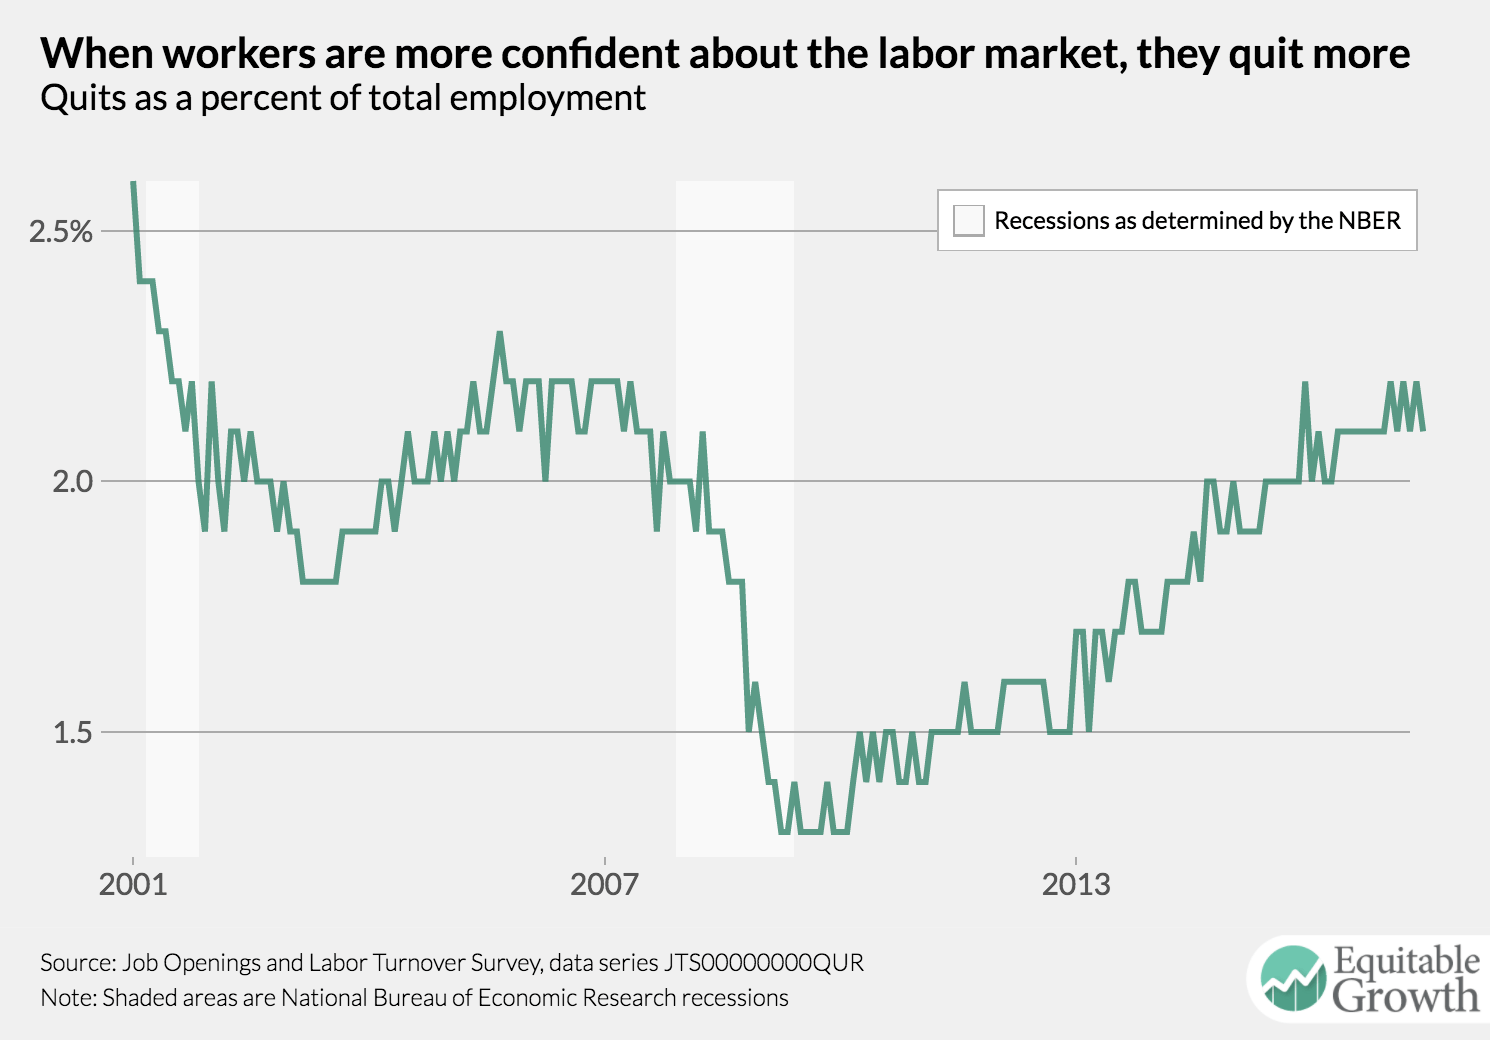
The quits rate continues to hover in the same range as it has for months, declining slightly to 2.1 percent in June. Don’t expect wage growth to accelerate much until quits start to rise.
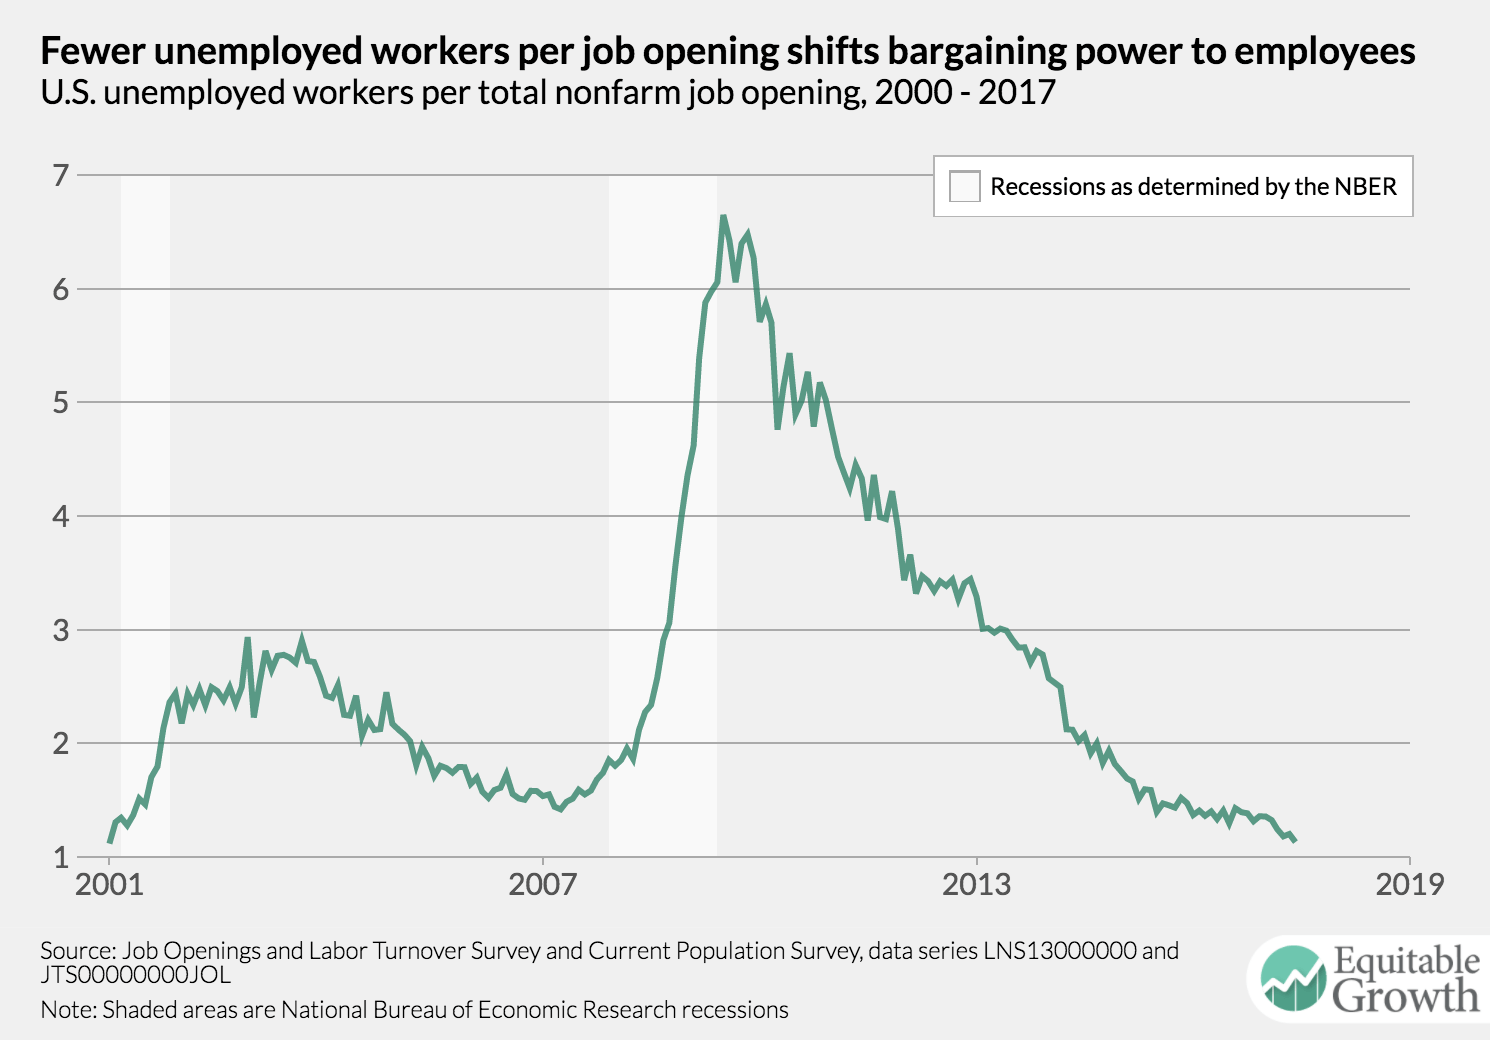
The number of unemployed workers per job opening dropped to its second lowest recorded level to 1.13.
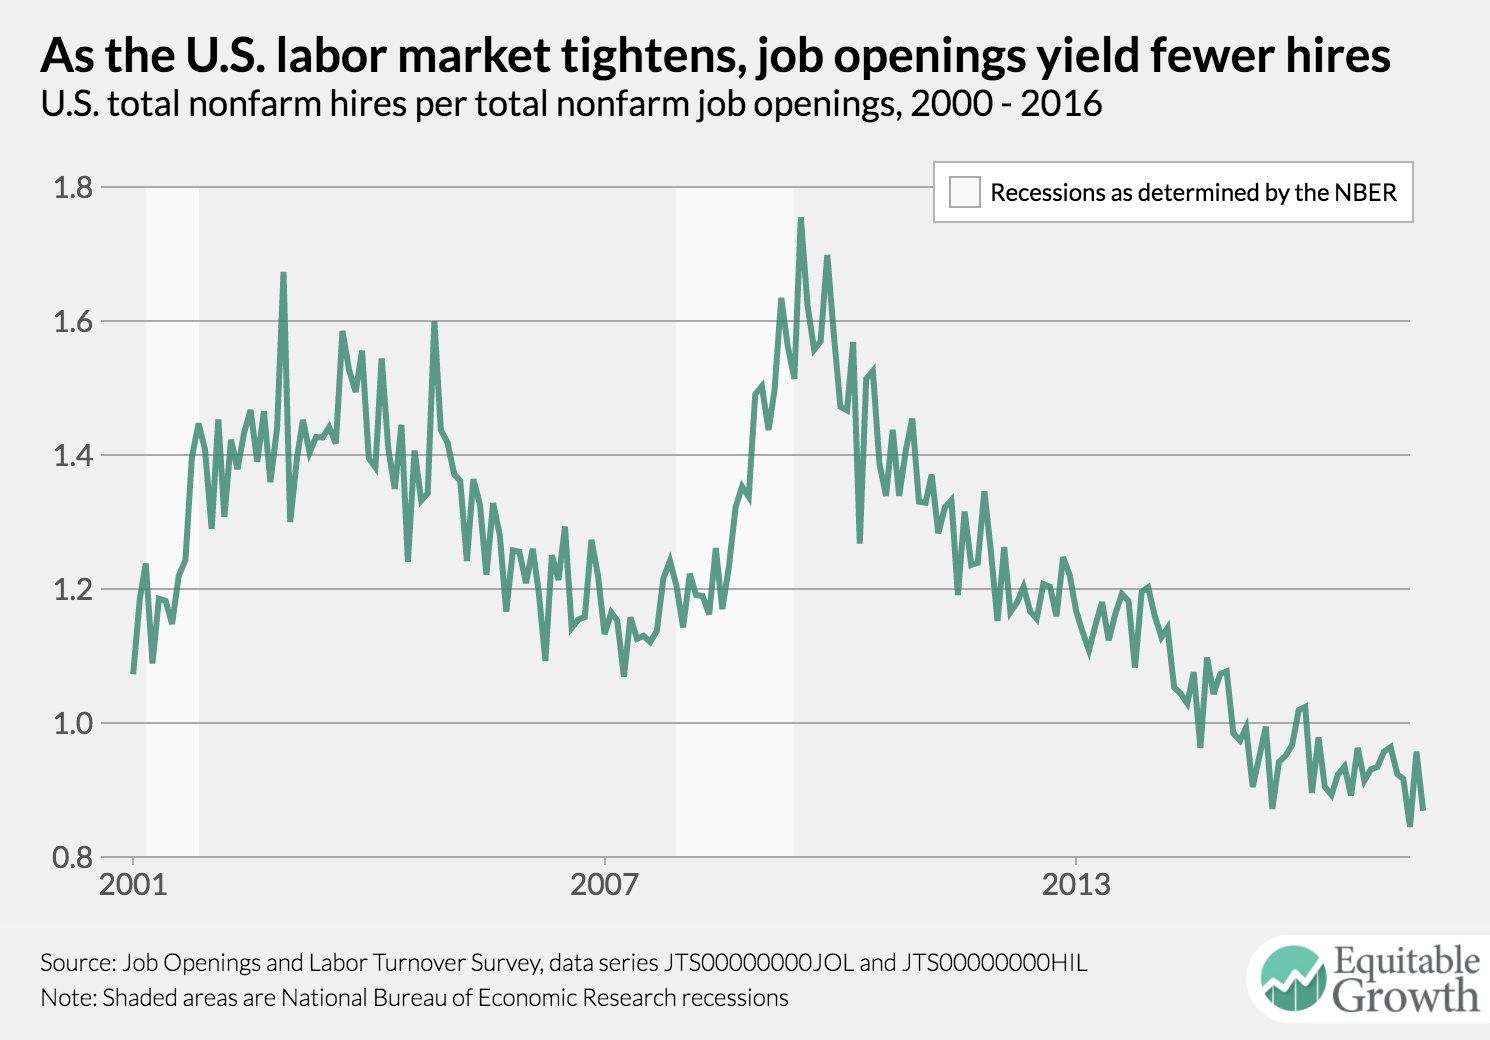
The vacancy yield, the number of hires per job opening, declined in June as it continues to hit levels far below pre-recession levels.
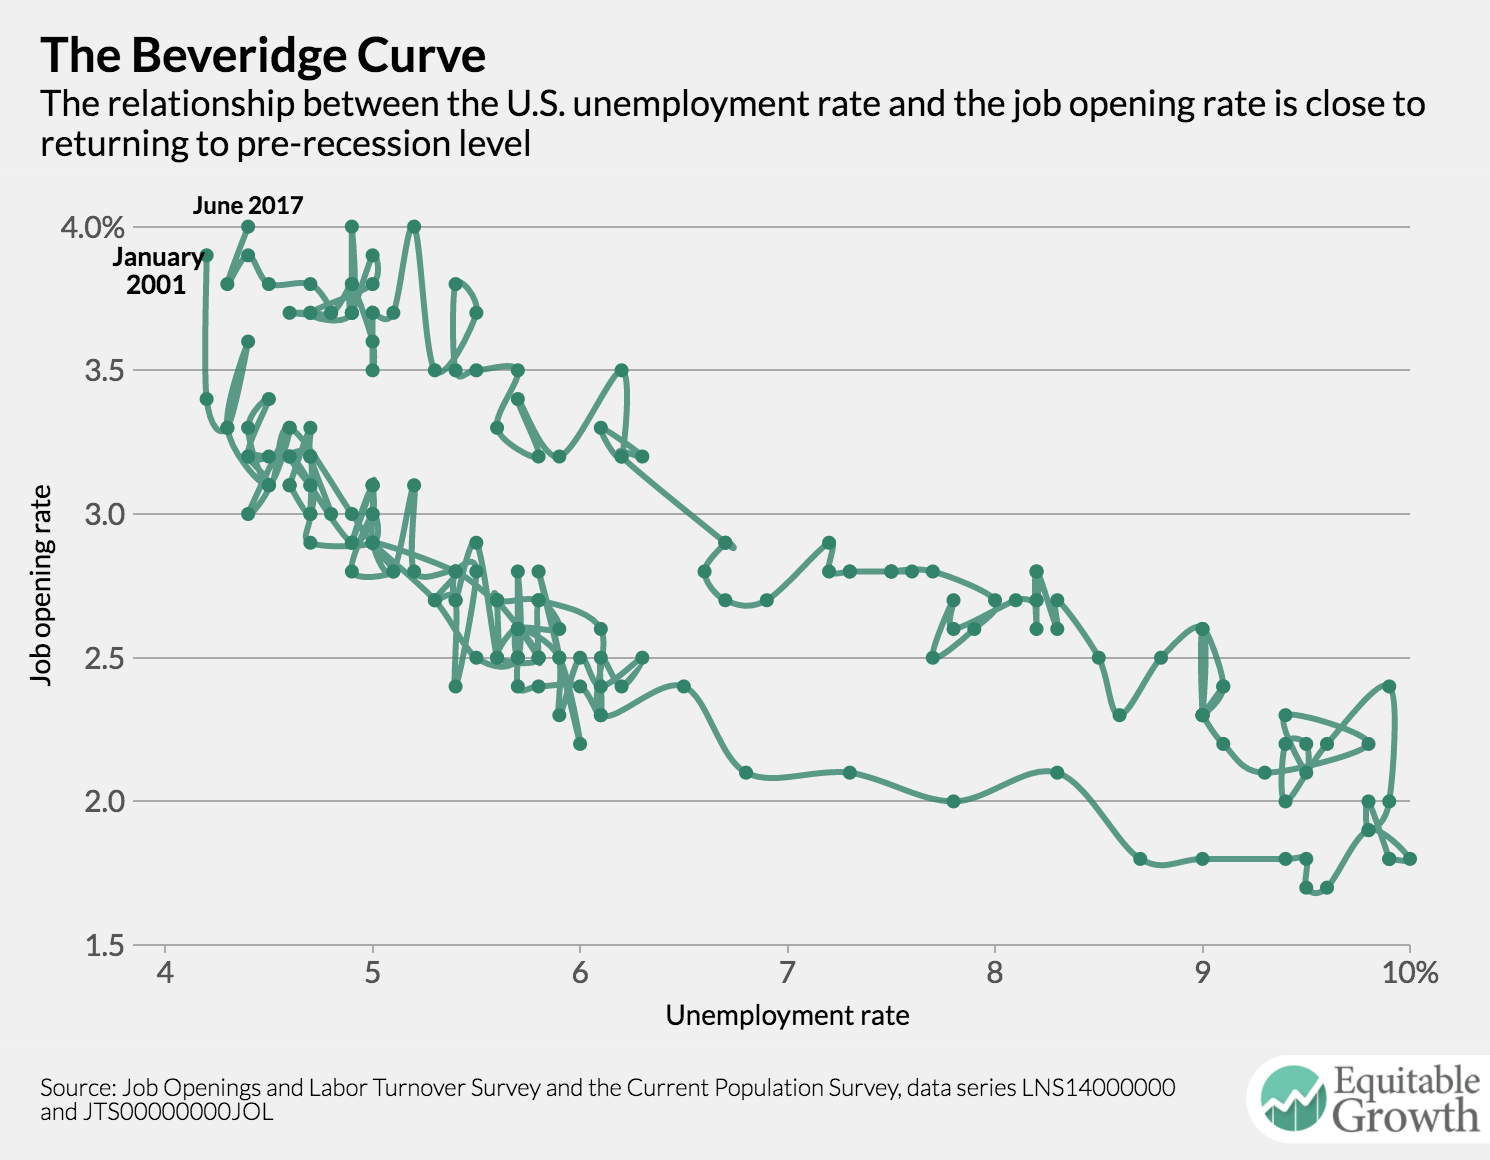
The Beveridge Curve has not quite shifted back to its pre-recession relationship, but it appears likely to do so relatively soon.