JOLTS Day Graphs: July 2022 Edition
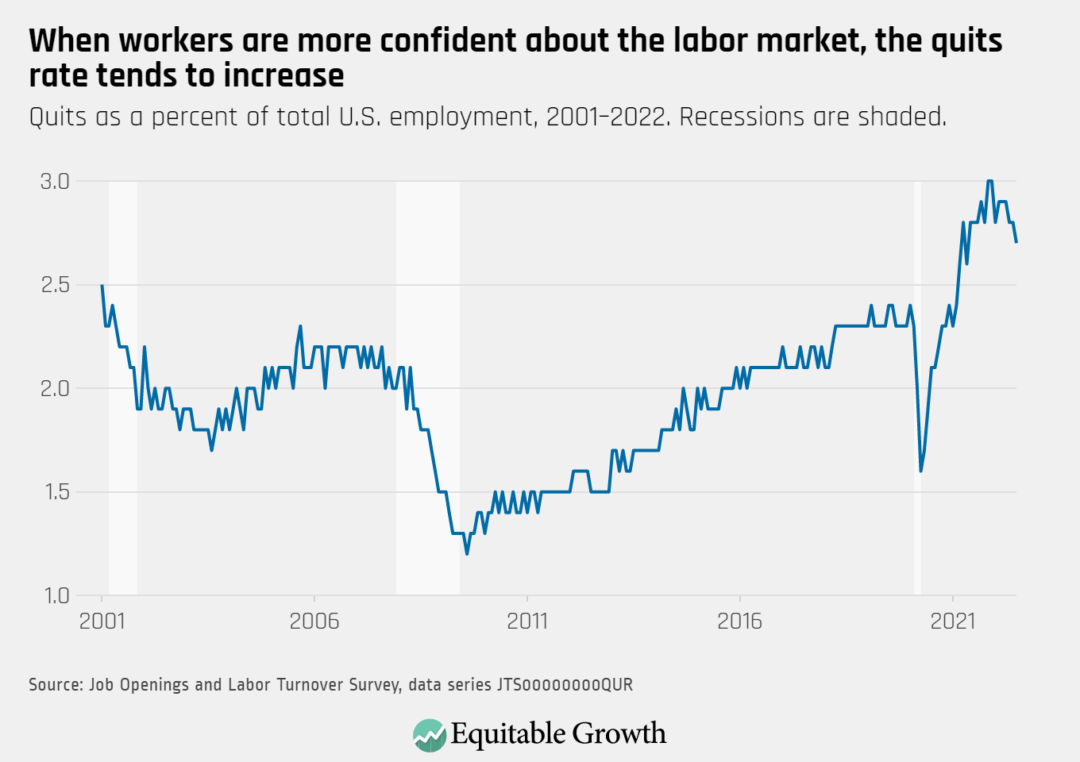
The quits rate decreased slightly from 2.8 percent to 2.7 percent, but remains above historical norms for economic expansions.
![Quits as a percent of total U.S. employment, 2001–2022. Recessions are shaded.](https://equitablegrowth.org/wp-content/uploads/2022/08/When-workers-are-more-confident-about-the-labor-market-the-quits-rate-tends-to-increase-1-1080x762.png)
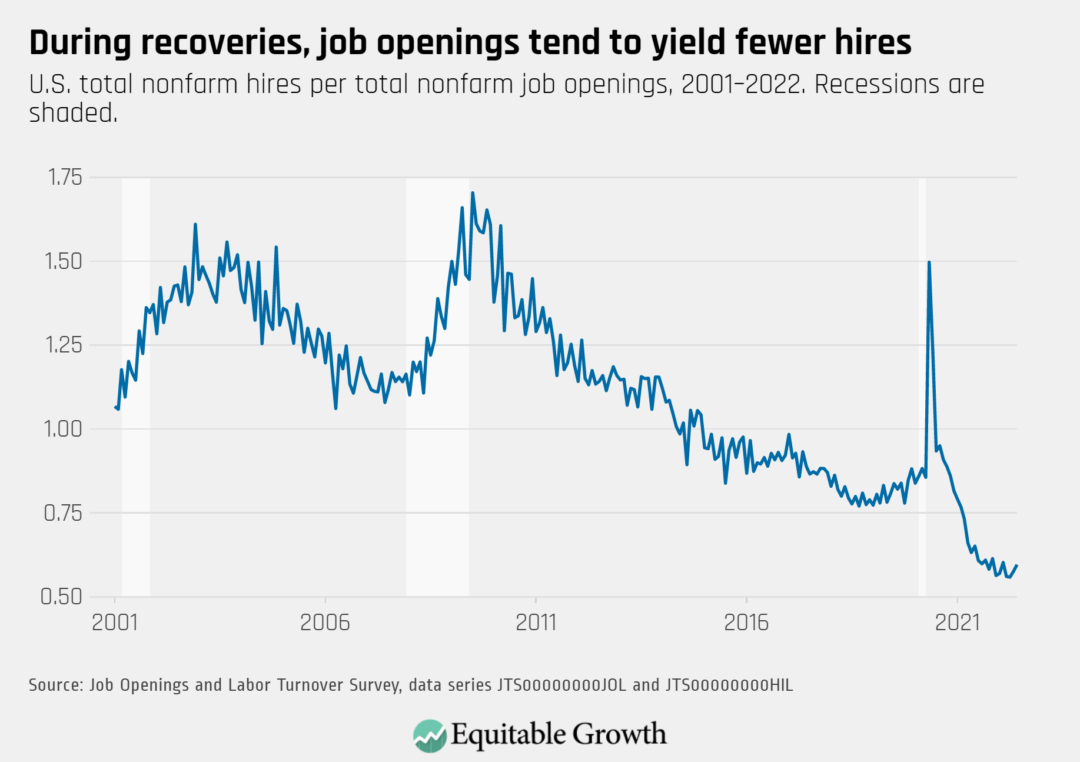
The vacancy yield has plateaued in recent months at low levels of hires per job opening, with each indicator holding steady in July.
![U.S. total nonfarm hires per total nonfarm job openings, 2001–2022. Recessions are shaded.](https://equitablegrowth.org/wp-content/uploads/2022/08/During-recoveries-job-openings-tend-to-yield-fewer-hires-1080x762.png)
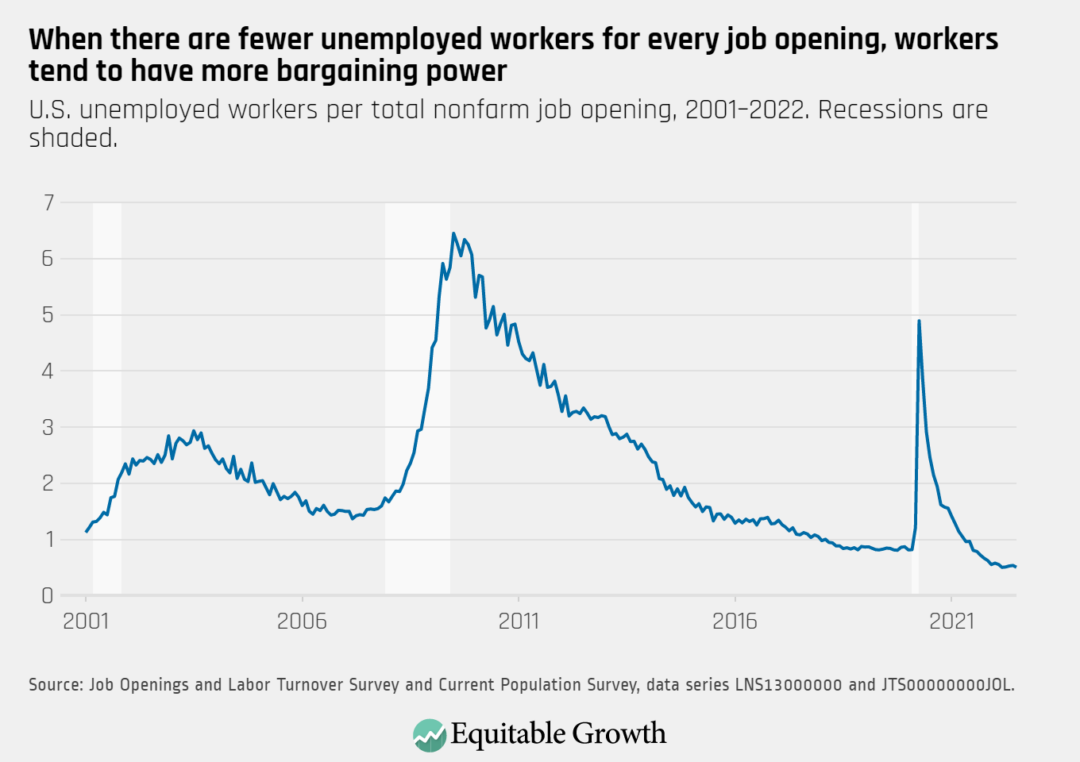
The ratio of unemployed workers per job opening remains well below 1-to-1, decreasing from 0.53 in June 2022 to 0.50 in July 2022.
![U.S. unemployed workers per total nonfarm job opening, 2001–2022. Recessions are shaded.](https://equitablegrowth.org/wp-content/uploads/2022/08/When-there-are-fewer-unemployed-workers-for-every-job-opening-workers-tend-to-have-more-bargaining-power-1-1080x762.png)
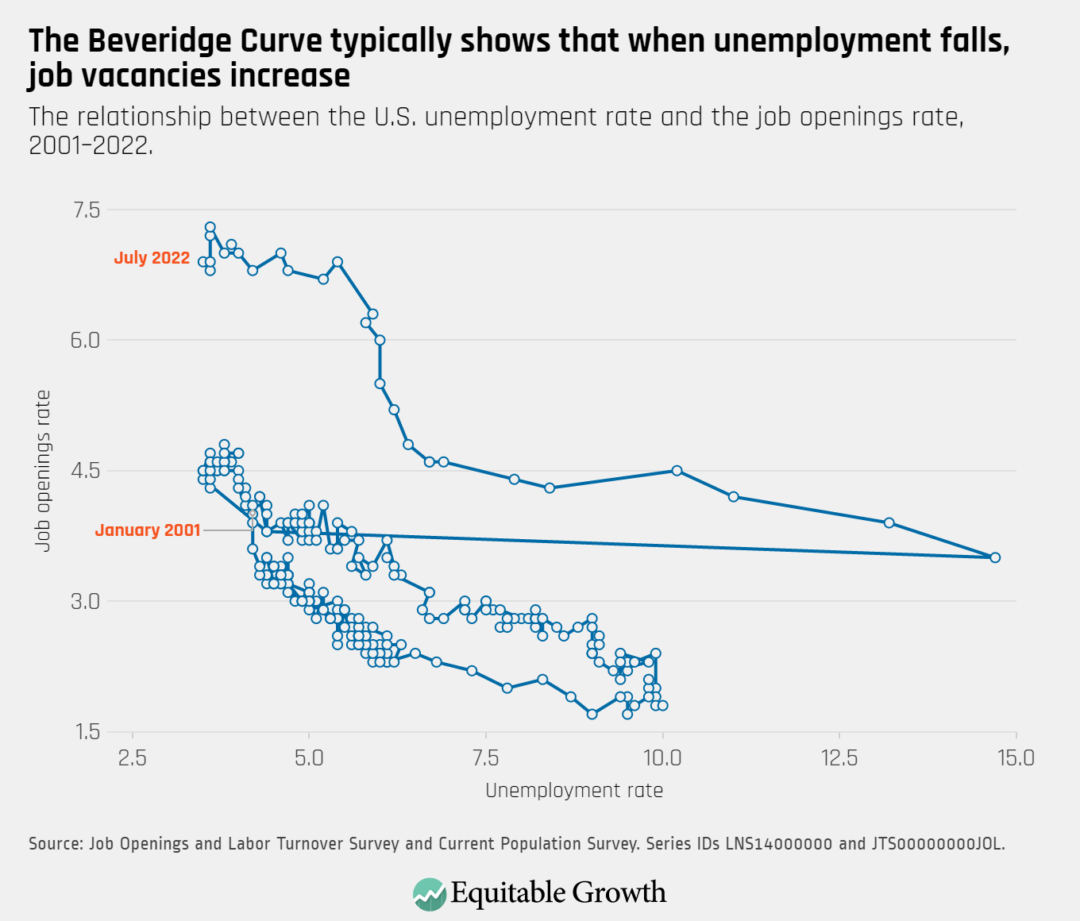
The Beveridge Curve reflects the higher-than-typical job openings rate of 6.9 percent, compared to the low unemployment rate of 3.5 percent.
![The relationship between the U.S. unemployment rate and the job openings rate, 2001–2022.](https://equitablegrowth.org/wp-content/uploads/2022/08/The-Beveridge-Curve-typically-shows-that-when-unemployment-falls-job-vacancies-increase-1-1080x921.png)
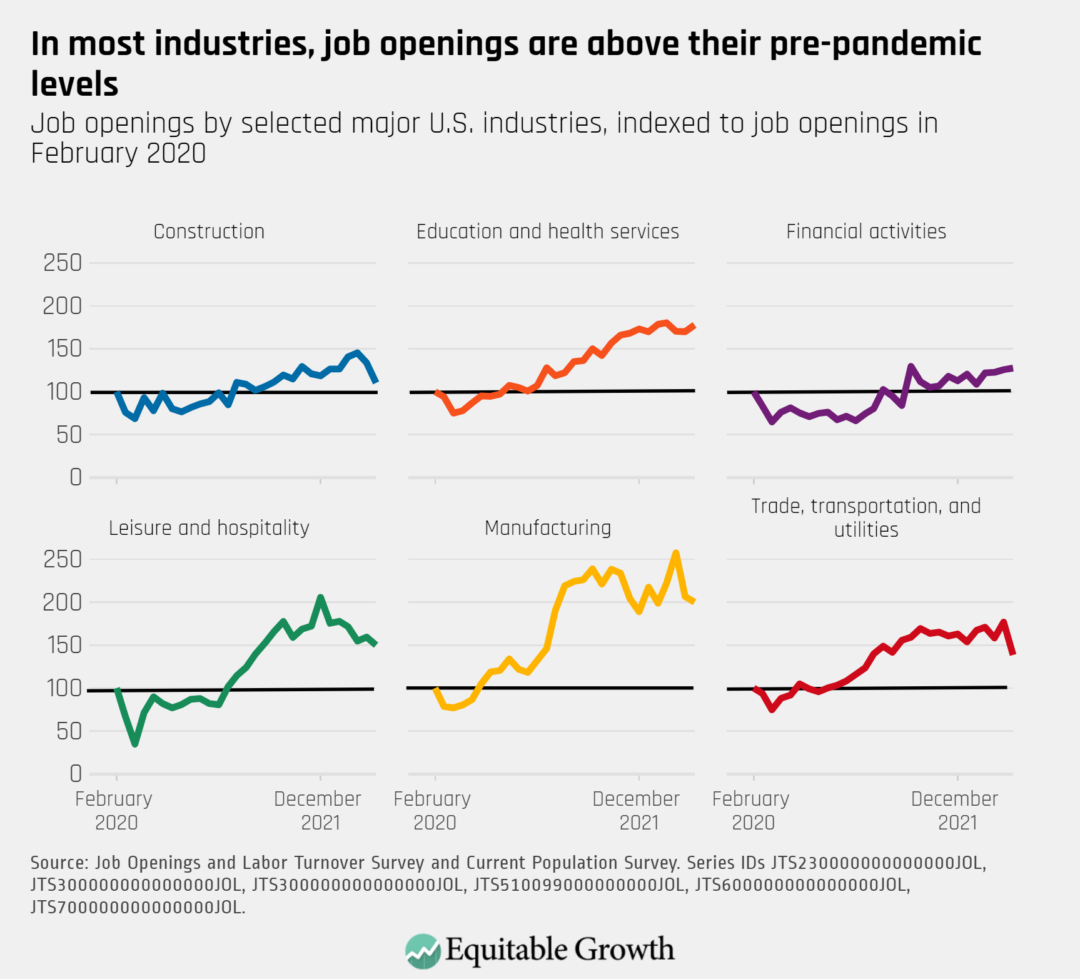
Quits are particularly elevated, compared to their pre-pandemic levels, in manufacturing and construction, among other industries.
![Job openings by selected major U.S. industries, indexed to job openings in February 2020](https://equitablegrowth.org/wp-content/uploads/2022/08/In-most-industries-job-openings-are-above-their-pre-pandemic-levels-1080x979.png)