Every month the U.S. Bureau of Labor Statistics releases data on hiring, firing, and other labor market flows from the Job Openings and Labor Turnover Survey, better known as JOLTS. Today, the BLS released the latest data for July 2020. This report doesn’t get as much attention as the monthly Employment Situation Report, but it contains useful information about the state of the U.S. labor market. Below are a few key graphs using data from the report.
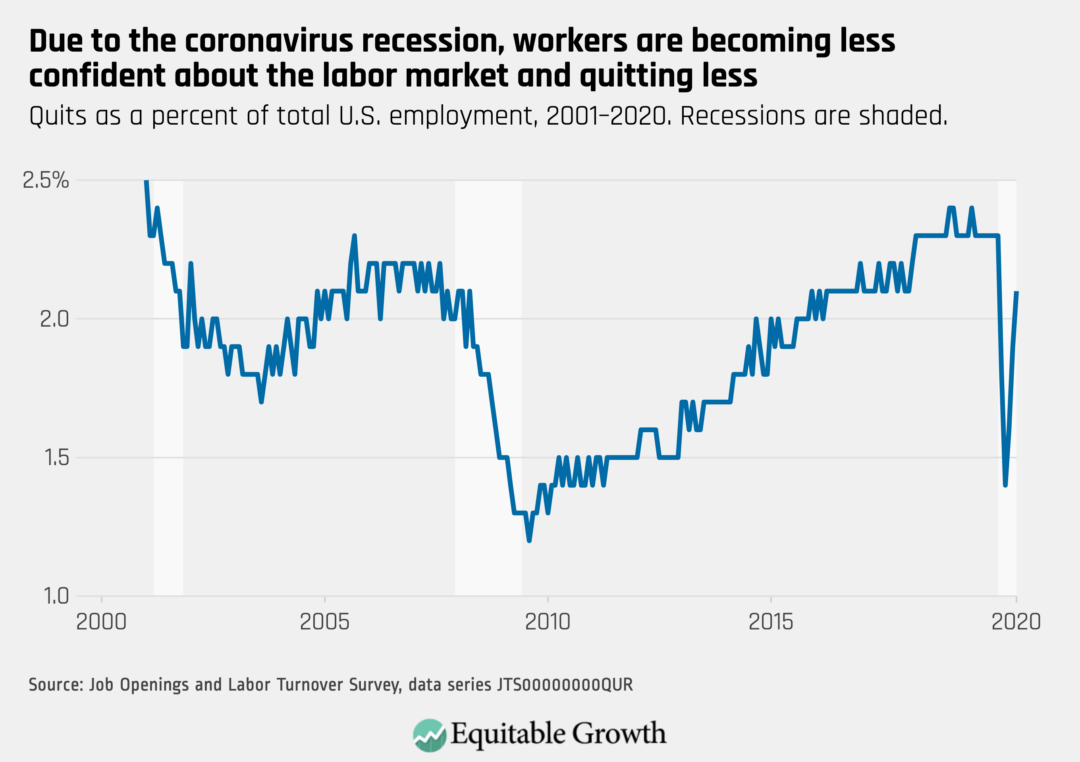
The quits rate continued to increase in July as the economy began to recover from early shutdowns, rising to 2.1% after falling to a low of 1.4% in April.
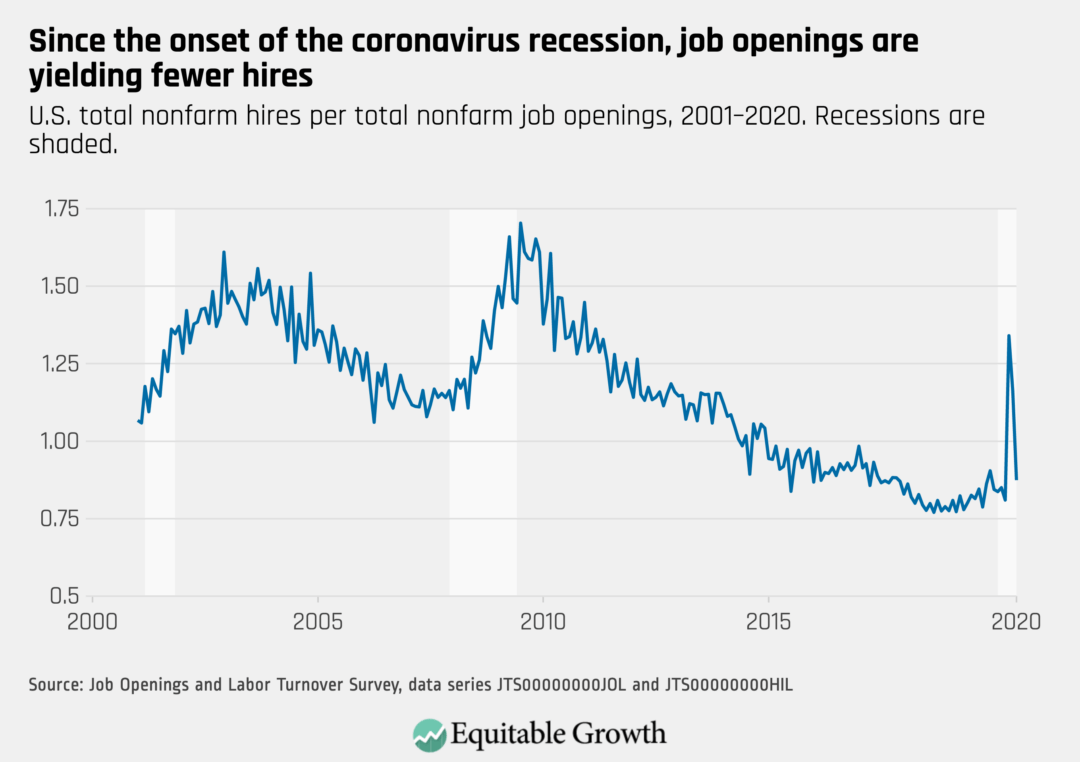
There was less than one hire per job opening in July as openings increased to 6.6 million and hires fell to 5.8 million, a decrease of over 1 million hires compared to the prior month.
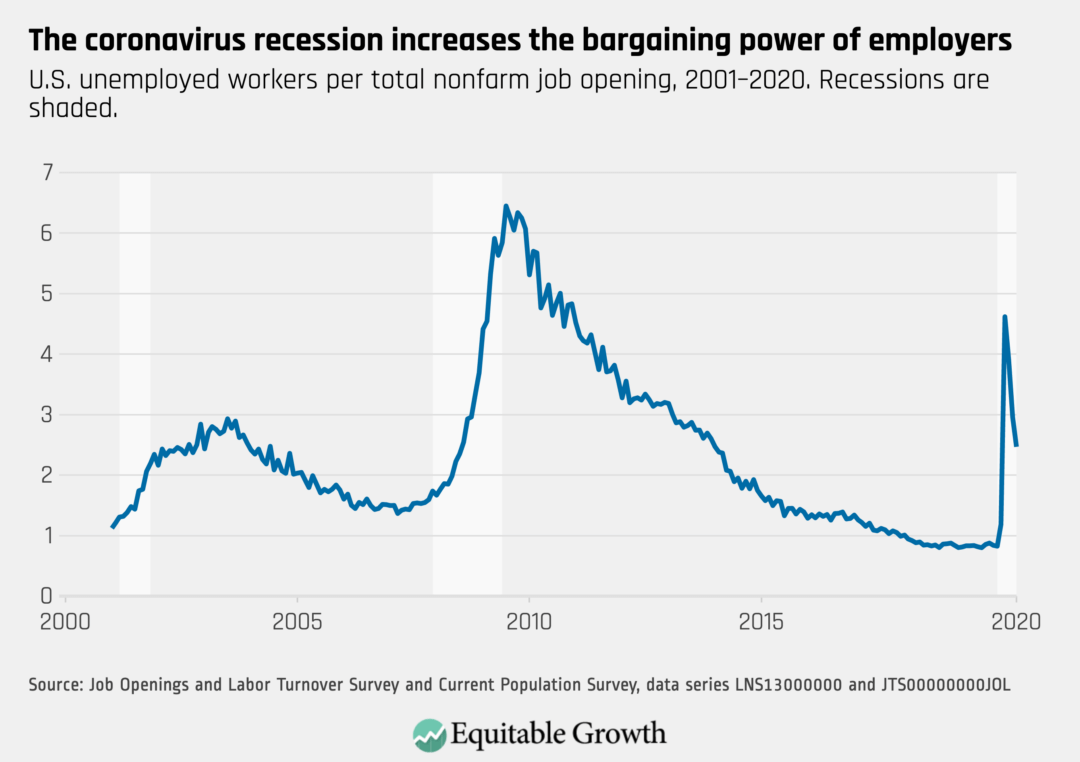
The job openings rate increased to 4.5% in July, but there were still more than two unemployed workers per opening and the unemployment rate was 10.2%.
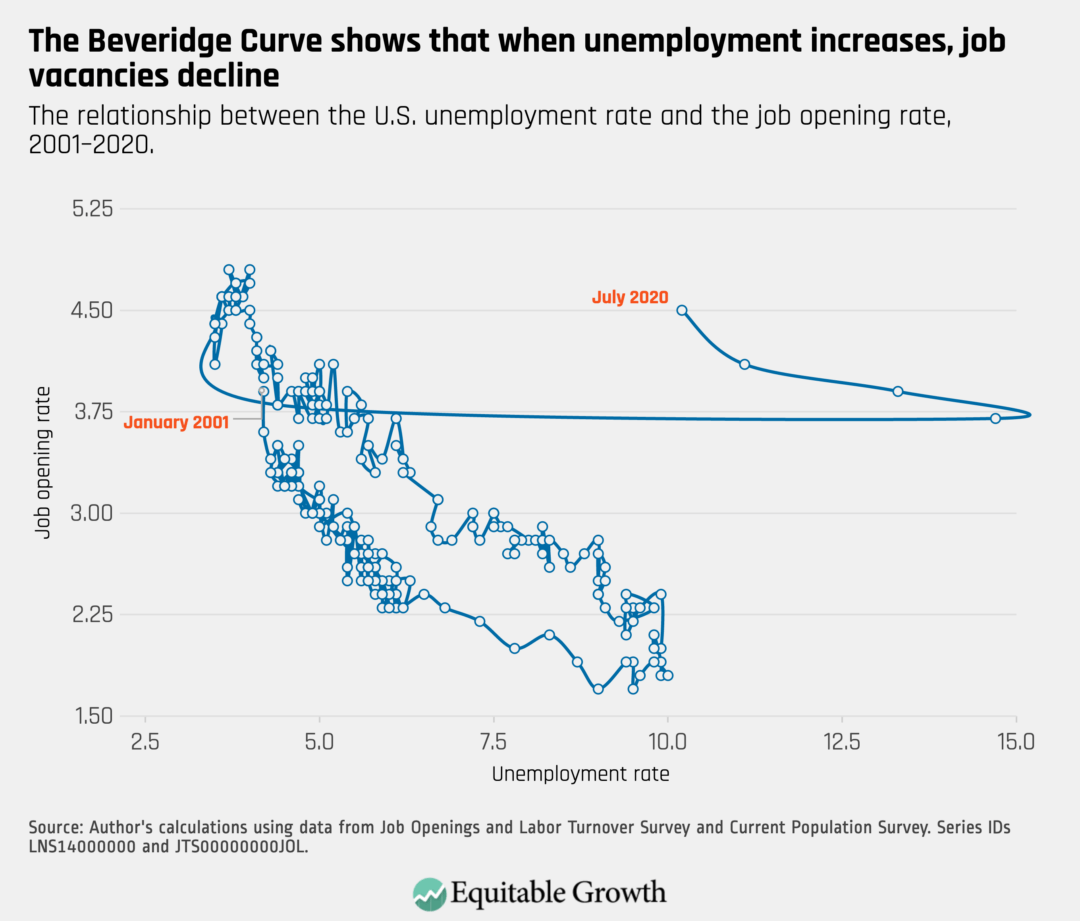
The Beveridge Curve reflects the unique circumstances of the coronavirus recession, with an elevated openings rate alongside high unemployment.