JOLTS Day Graphs: January 2020 Report Edition
1.
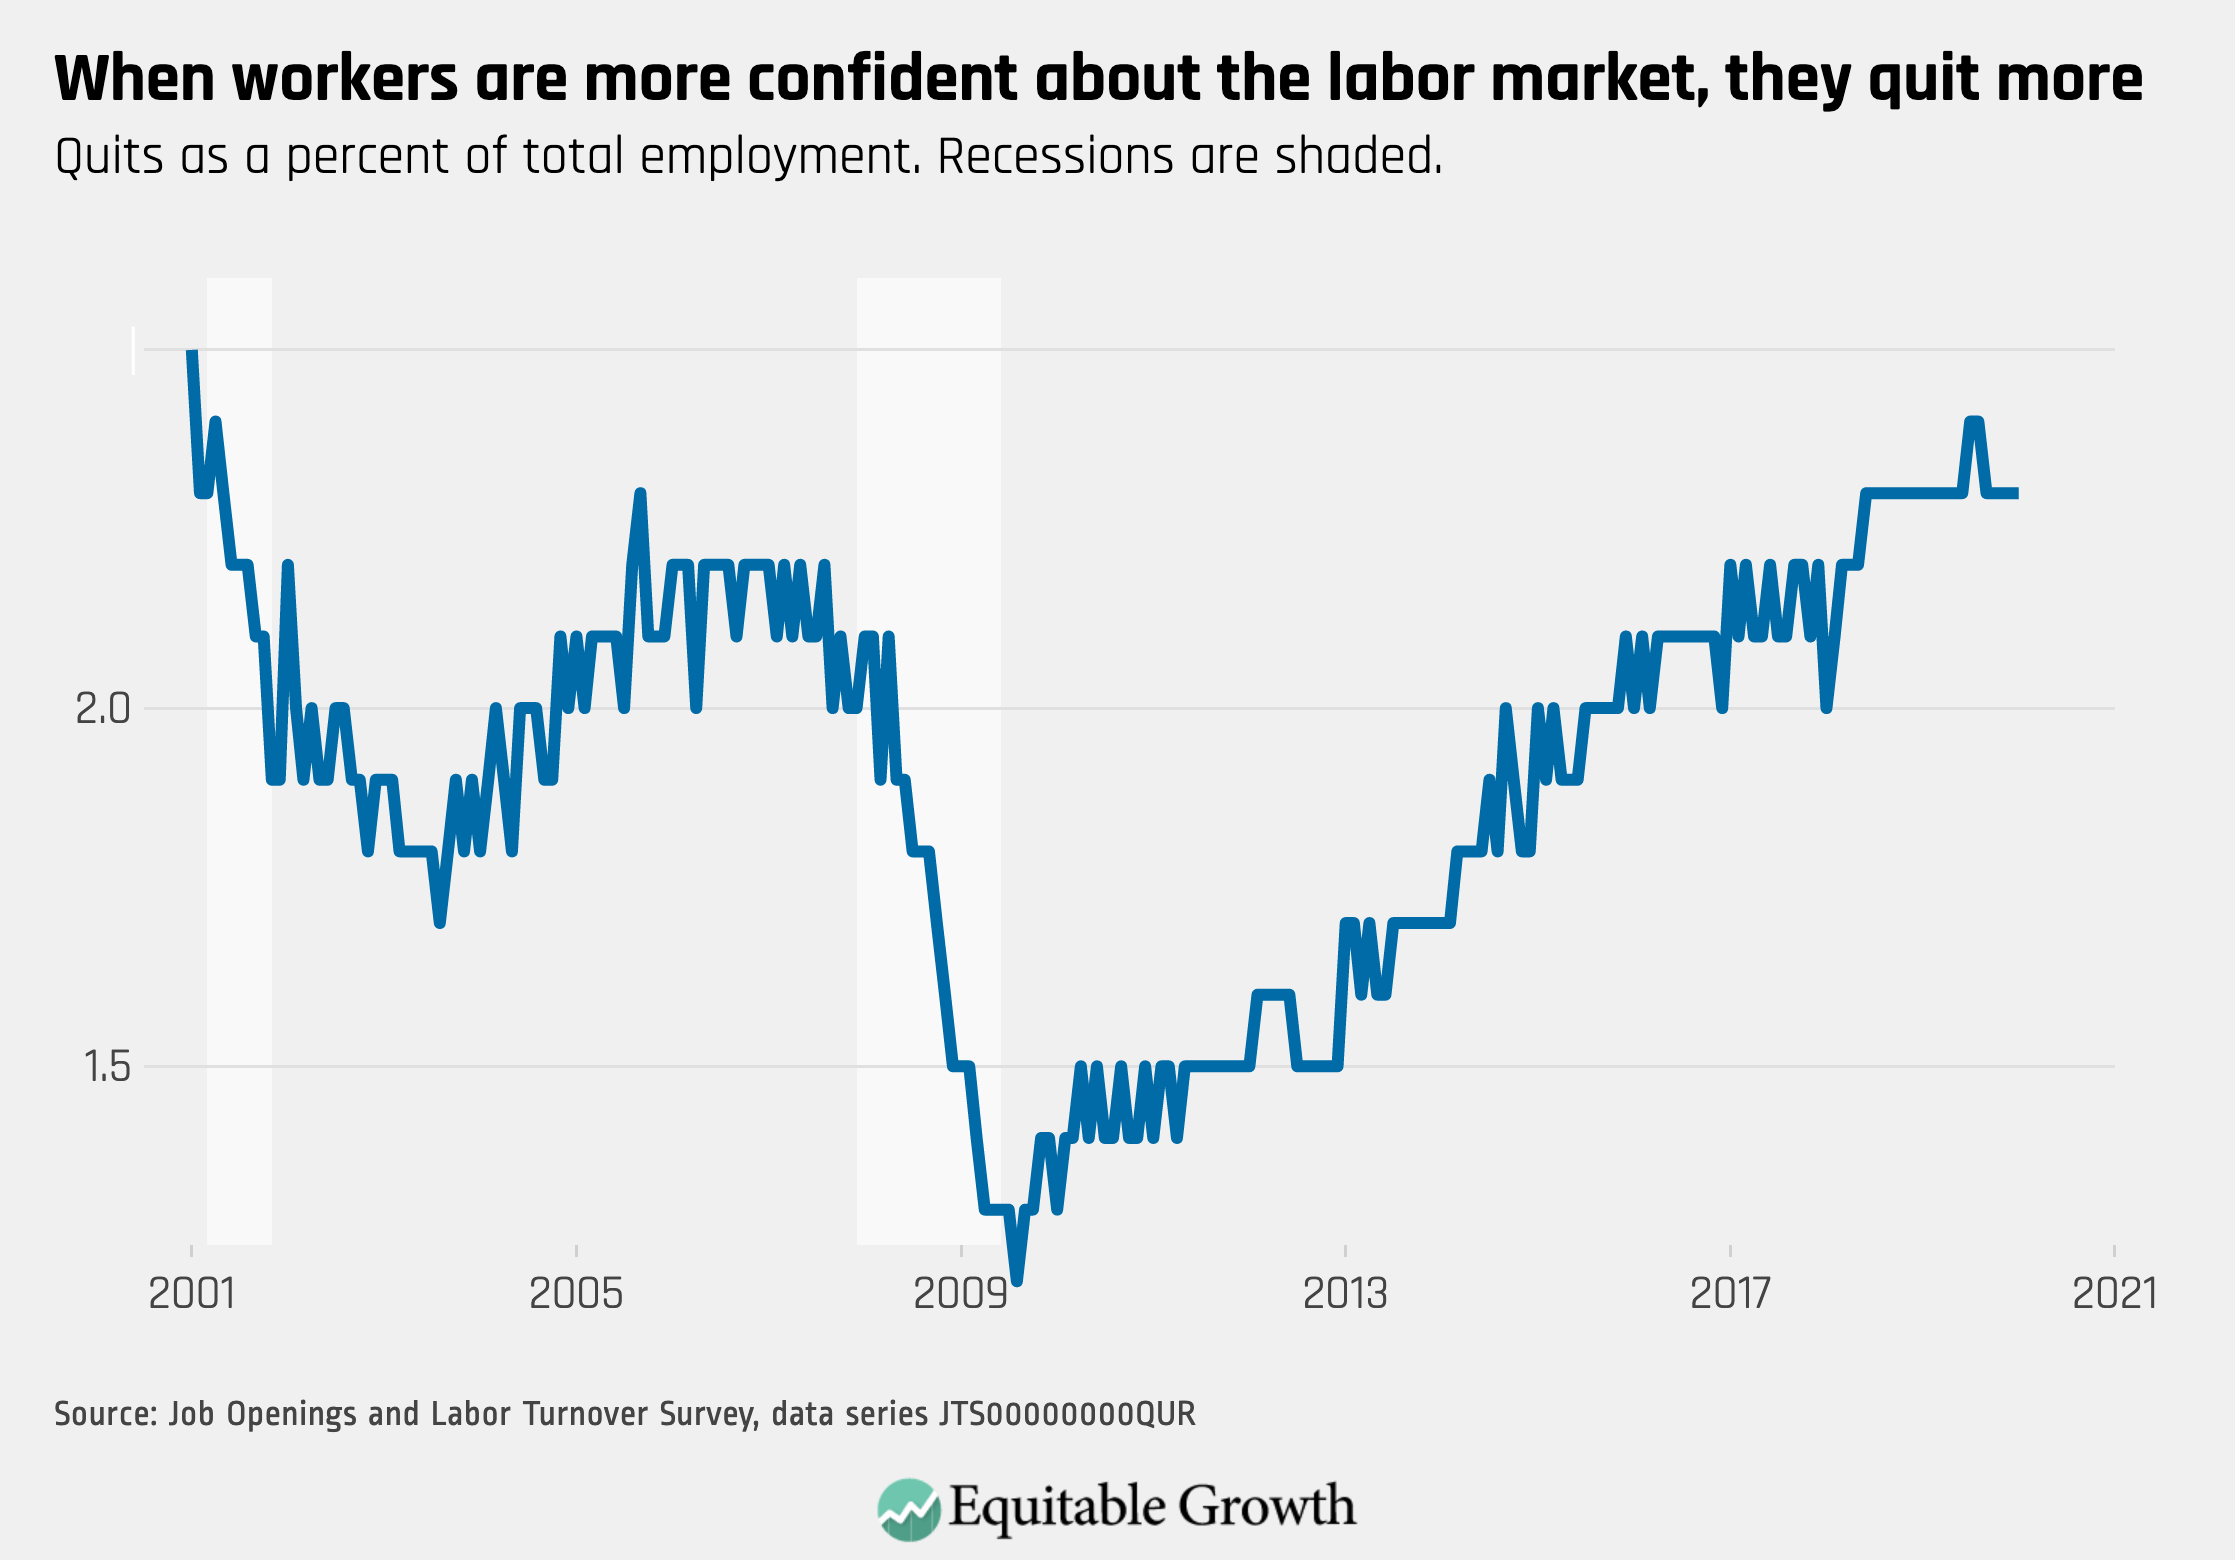
The quits rate held steady at a healthy rate of 2.3% in January, reflecting confidence in the labor market before a major public health and economic crisis.
2.
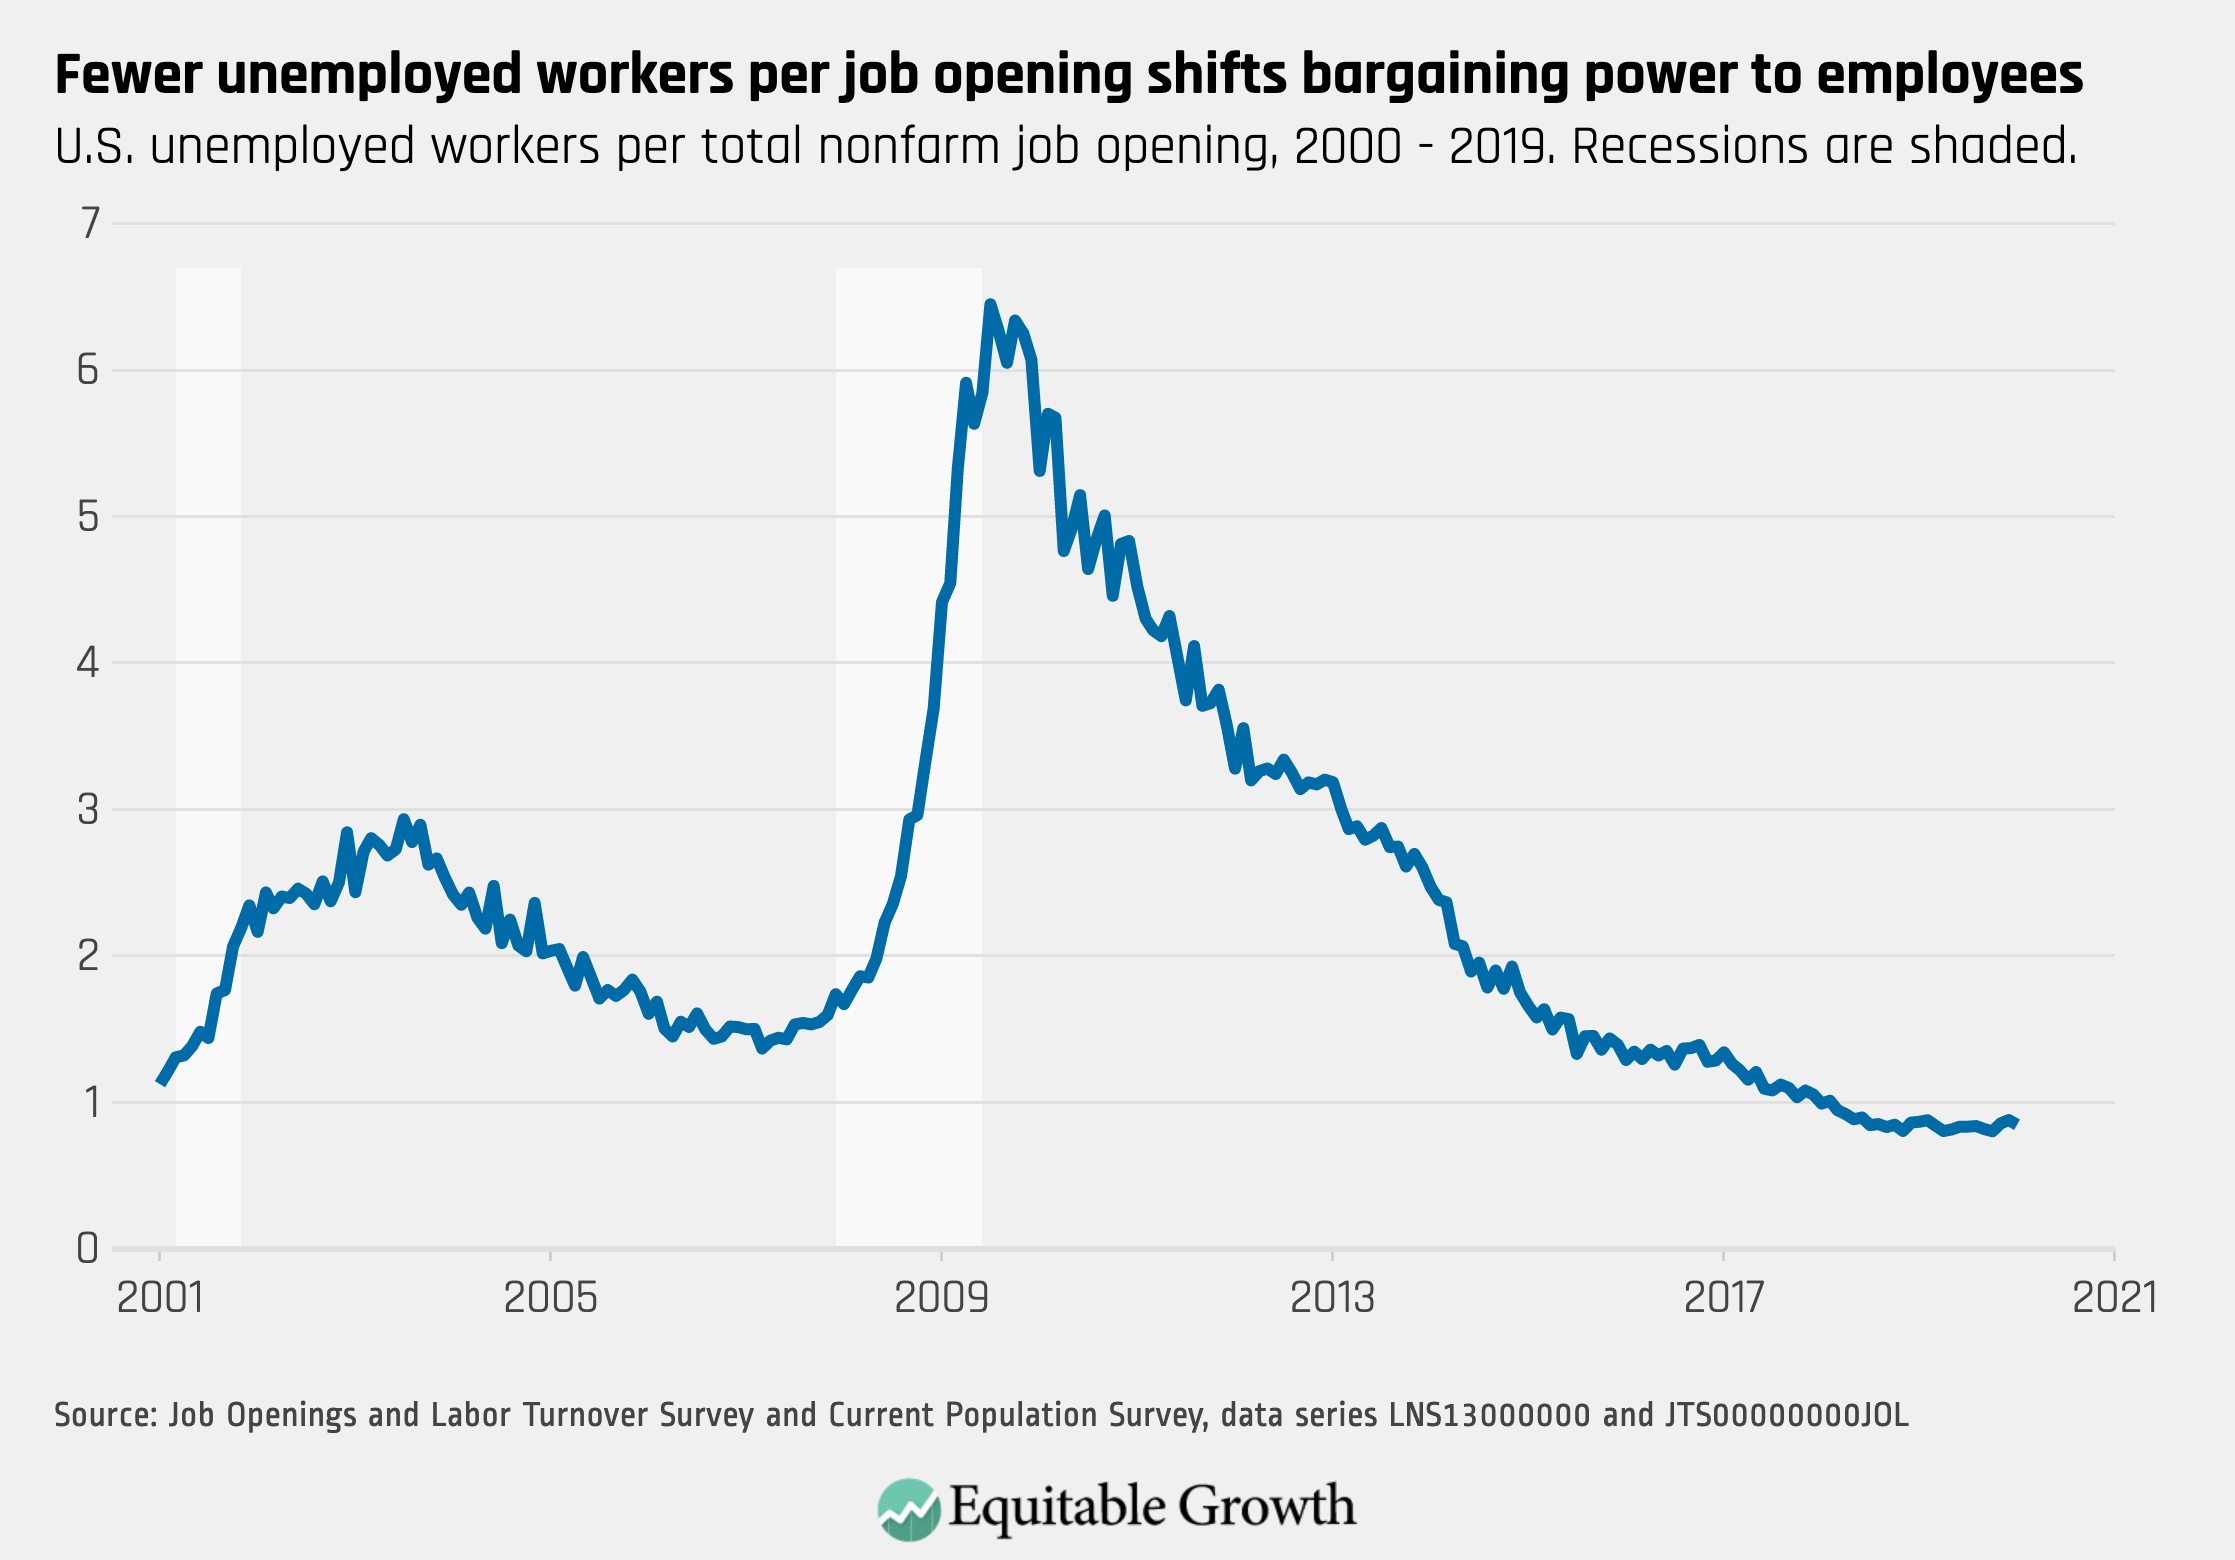
As jobs openings increased to 7.0 million in January, there continued to be less than one unemployed worker per opening before an expected slowdown of job postings.
3.
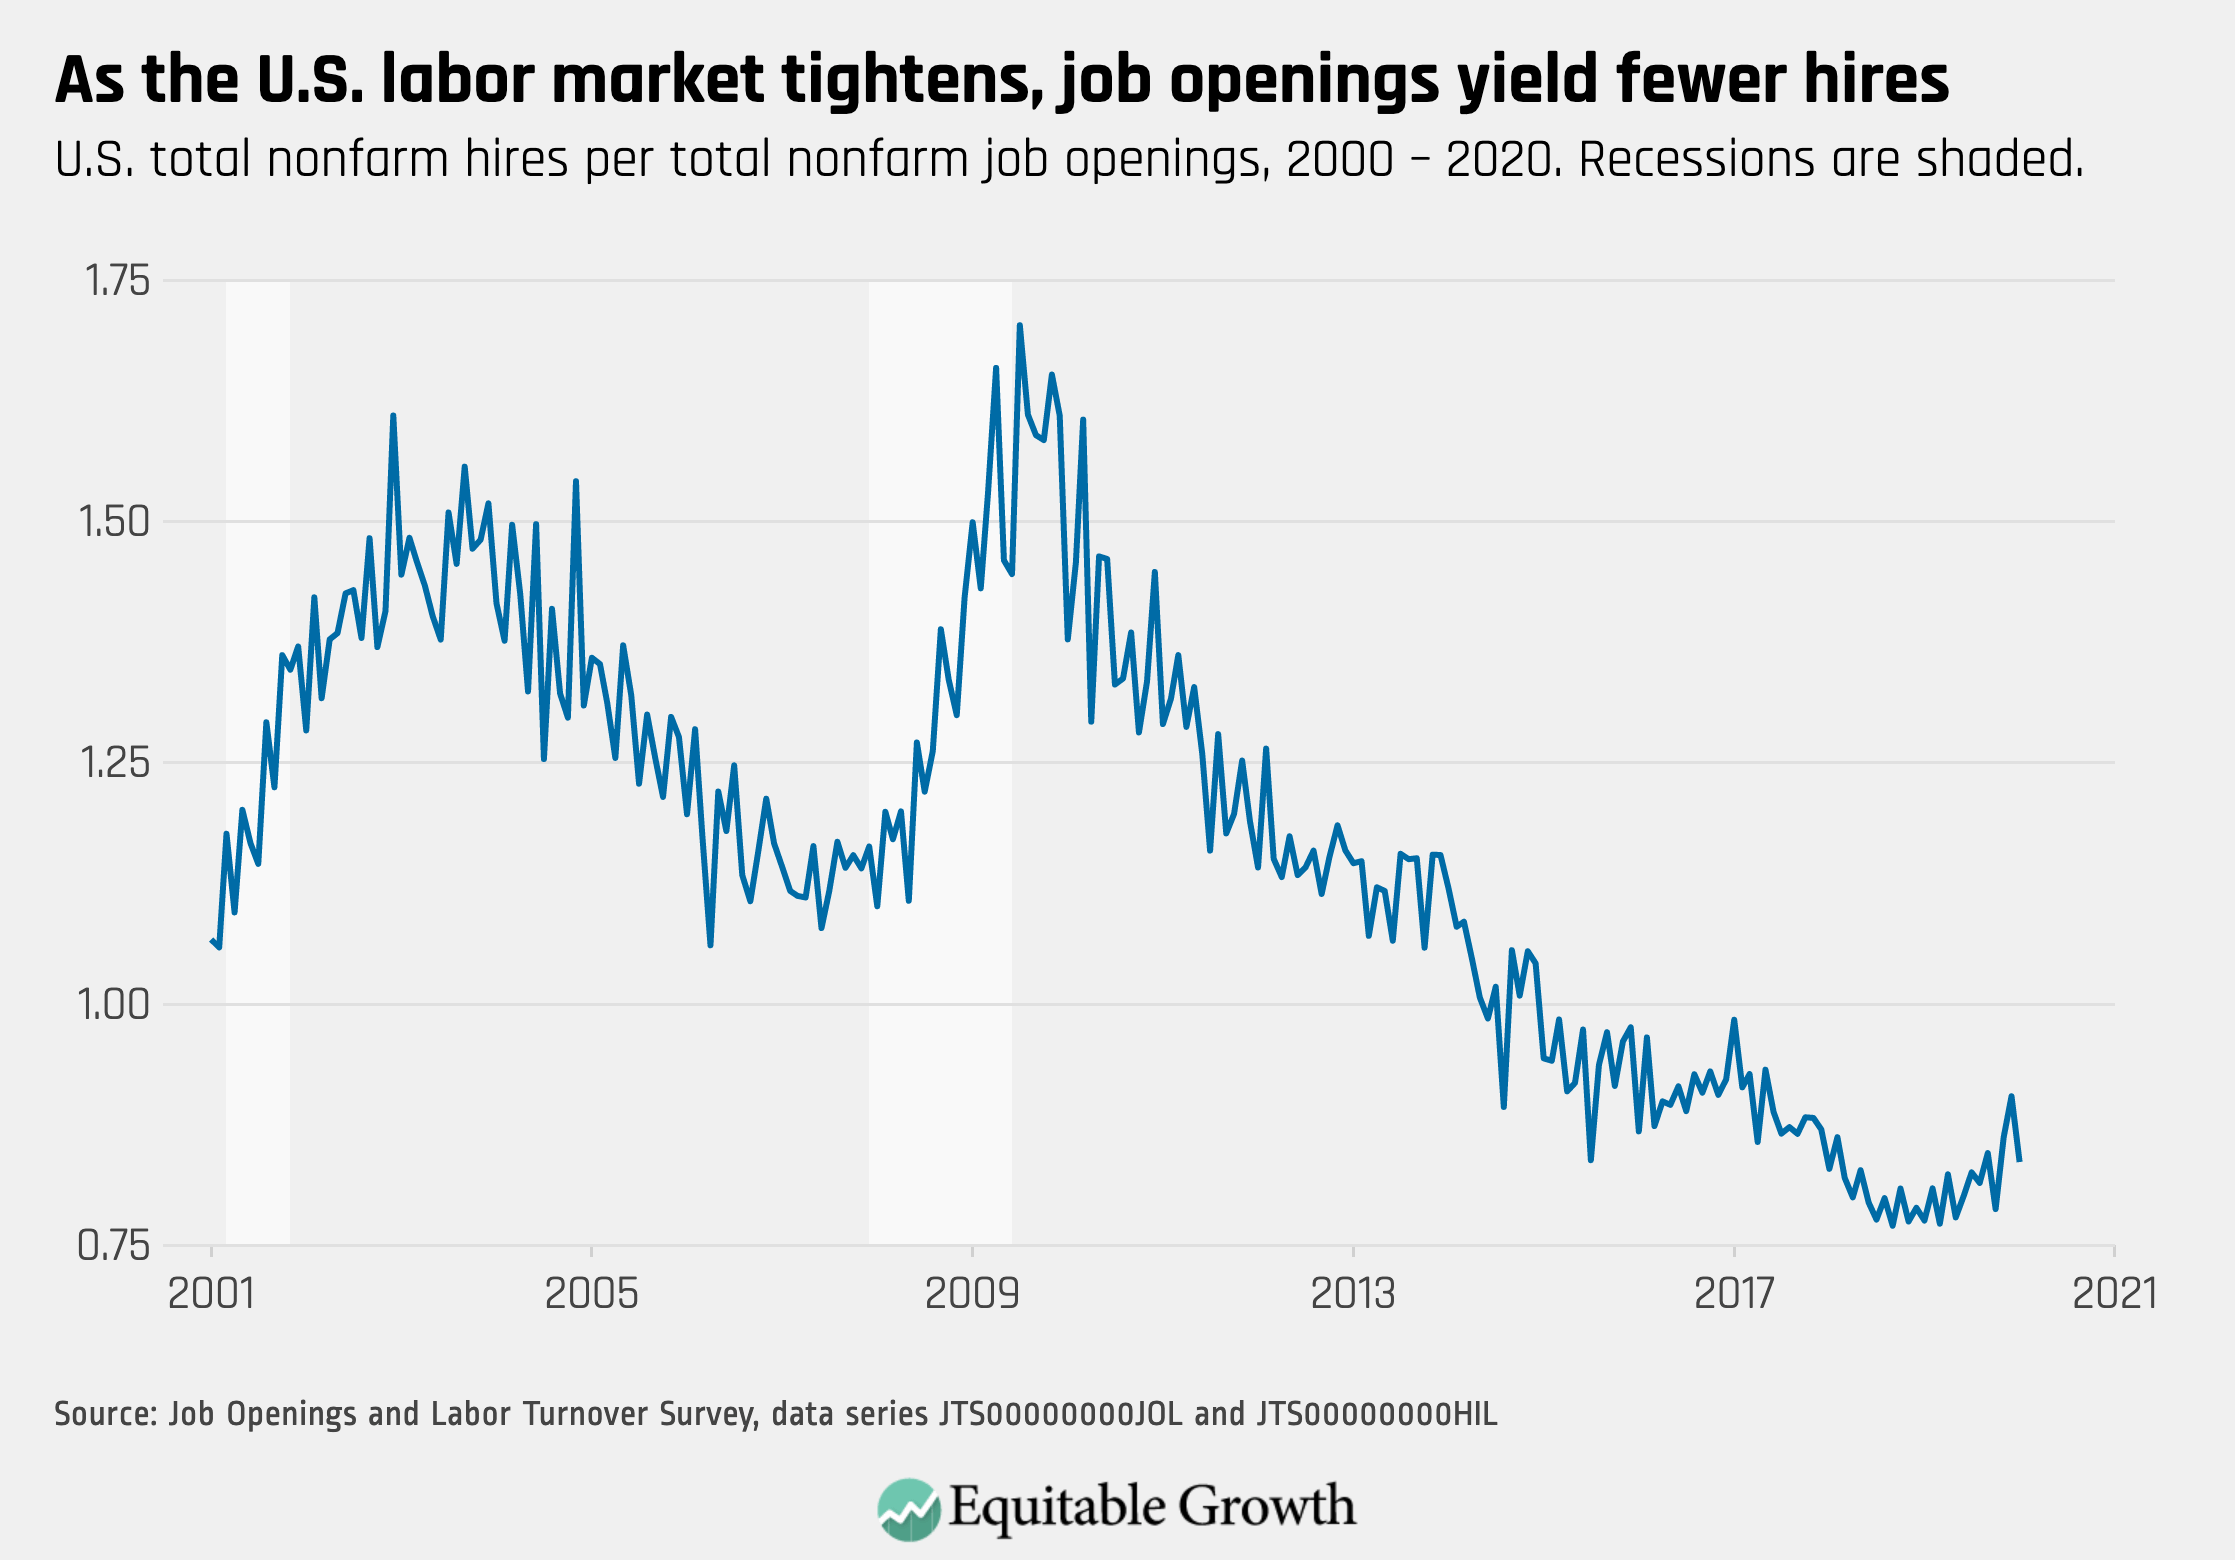
As the number of job openings increased in January, the vacancy yield decreased with fewer hires per available opening.
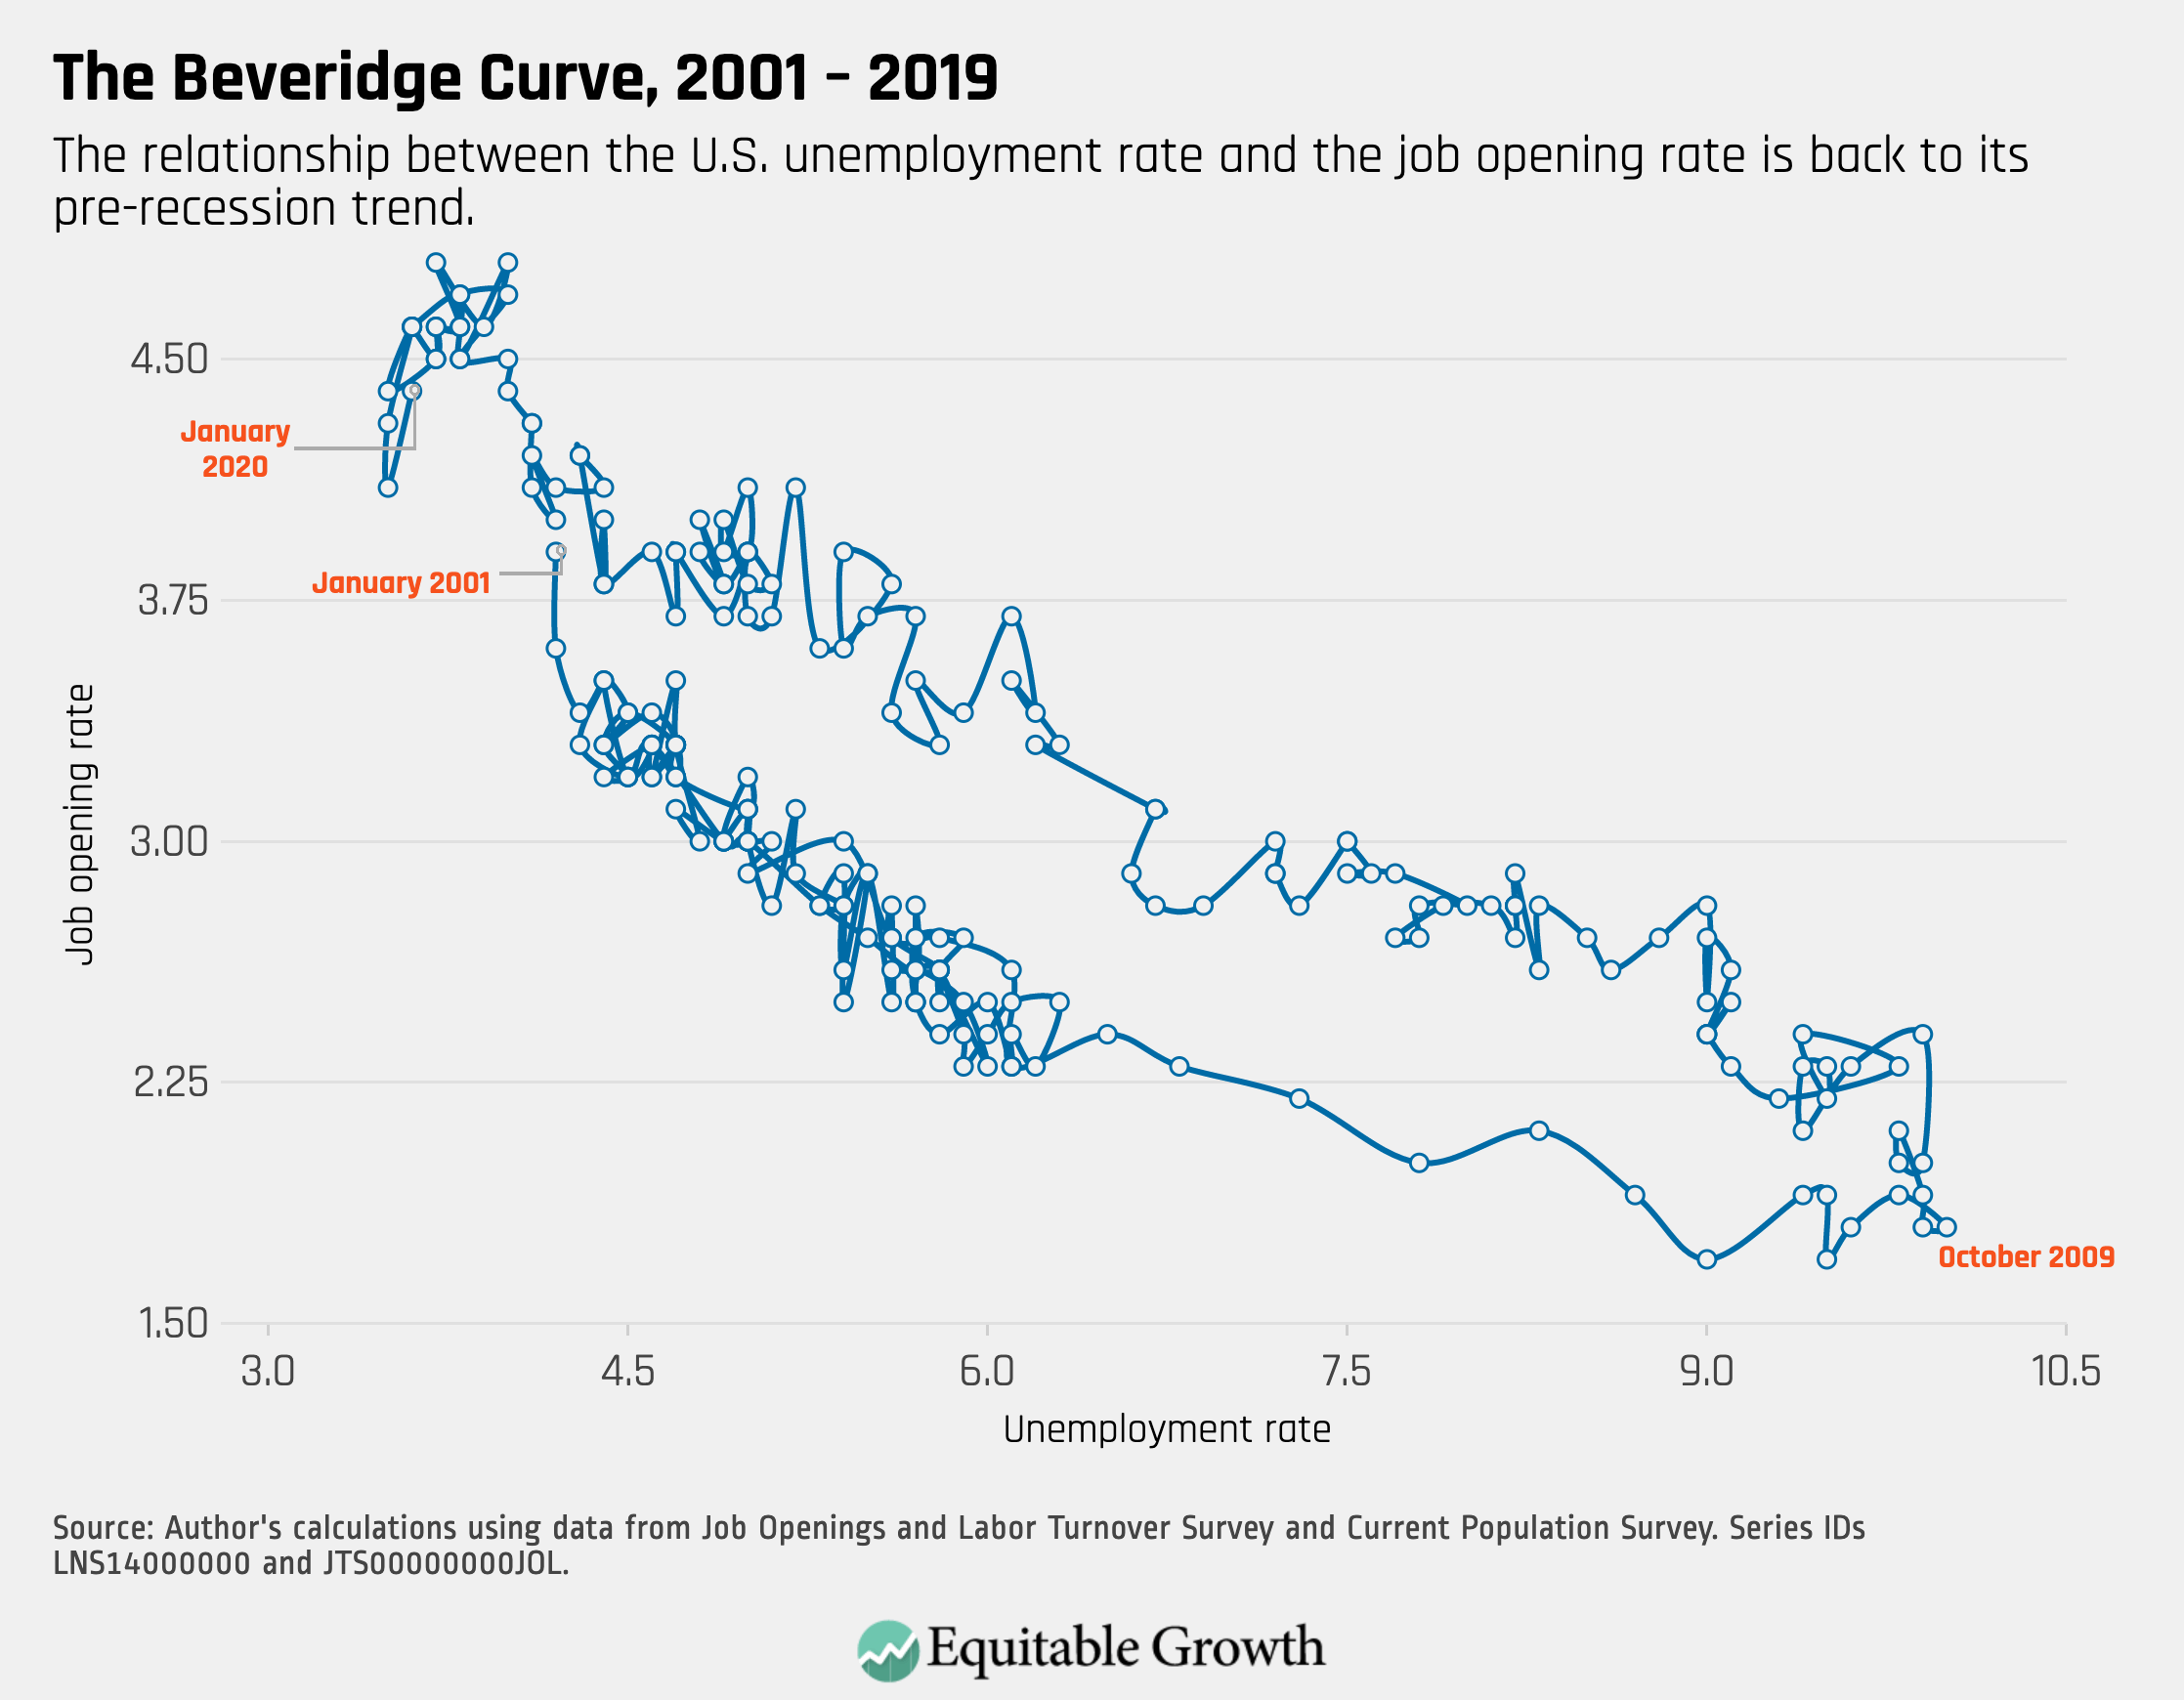
4.
The Beveridge Curve moved upward in January, reflecting a baseline healthy labor market before any potential economic slowdown as a result of the public health crisis associated with COVID-19.