JOLTS Day Graphs: February 2023 Edition
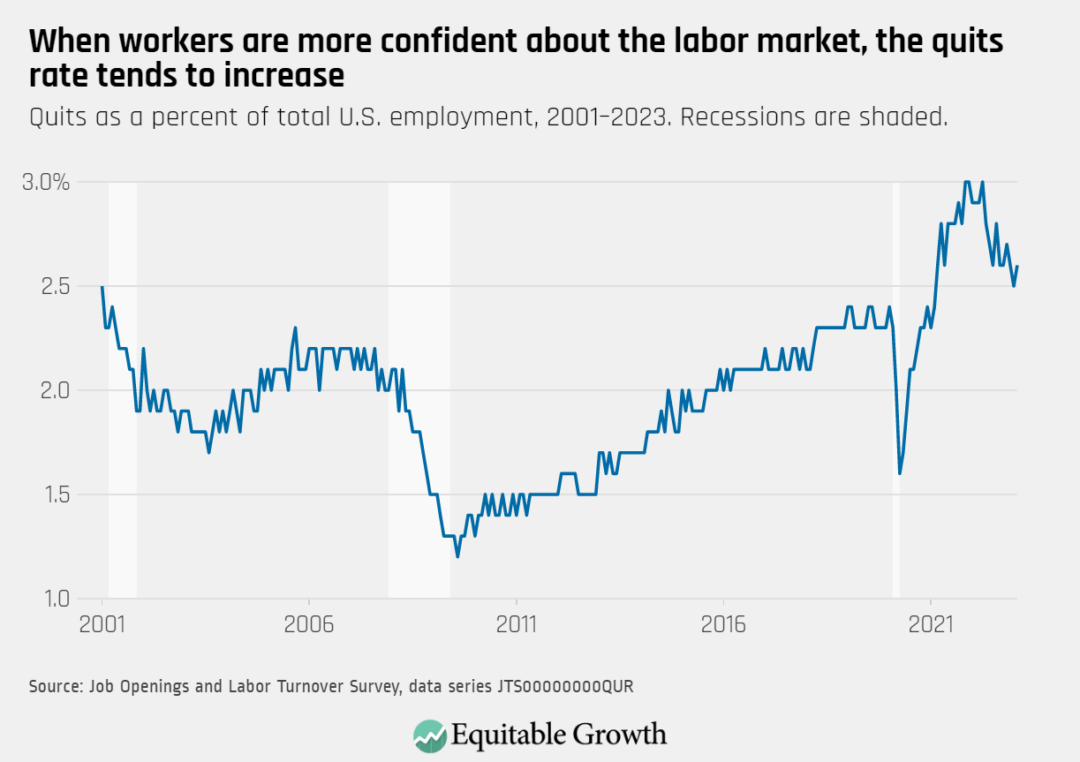
The quits rate rose slightly in February to 2.6 percent as 4.0 million workers quit their jobs, an increase of 146,000 since January.
![Quits as a percent of total U.S. employment, 2001–2023. Recessions are shaded.](https://equitablegrowth.org/wp-content/uploads/2023/04/When-workers-are-more-confident-about-the-labor-market-the-quits-rate-tends-to-increase-1080x762.png)
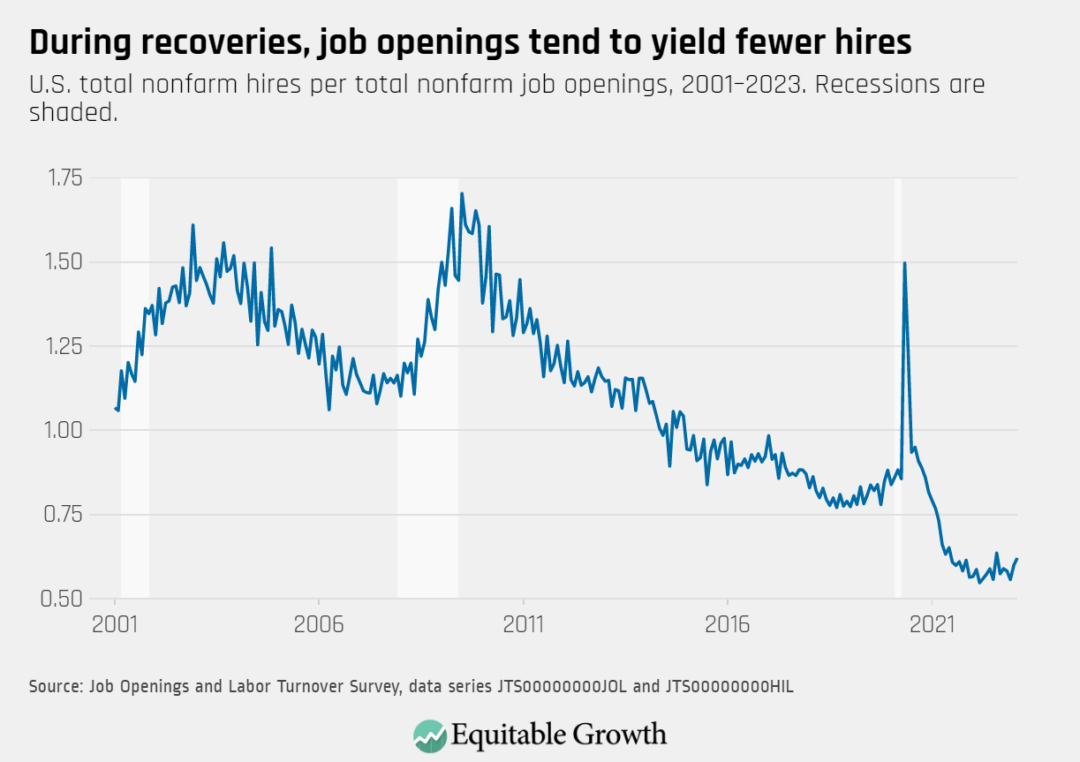
As job openings declined to 9.9 million and hires remained near 6.2 million, the vacancy yield increased to 0.62 in February from 0.60 in January.
![U.S. total nonfarm hires per total nonfarm job openings, 2001–2023. Recessions are shaded.](https://equitablegrowth.org/wp-content/uploads/2023/04/During-recoveries-job-openings-tend-to-yield-fewer-hires-1080x762.png)
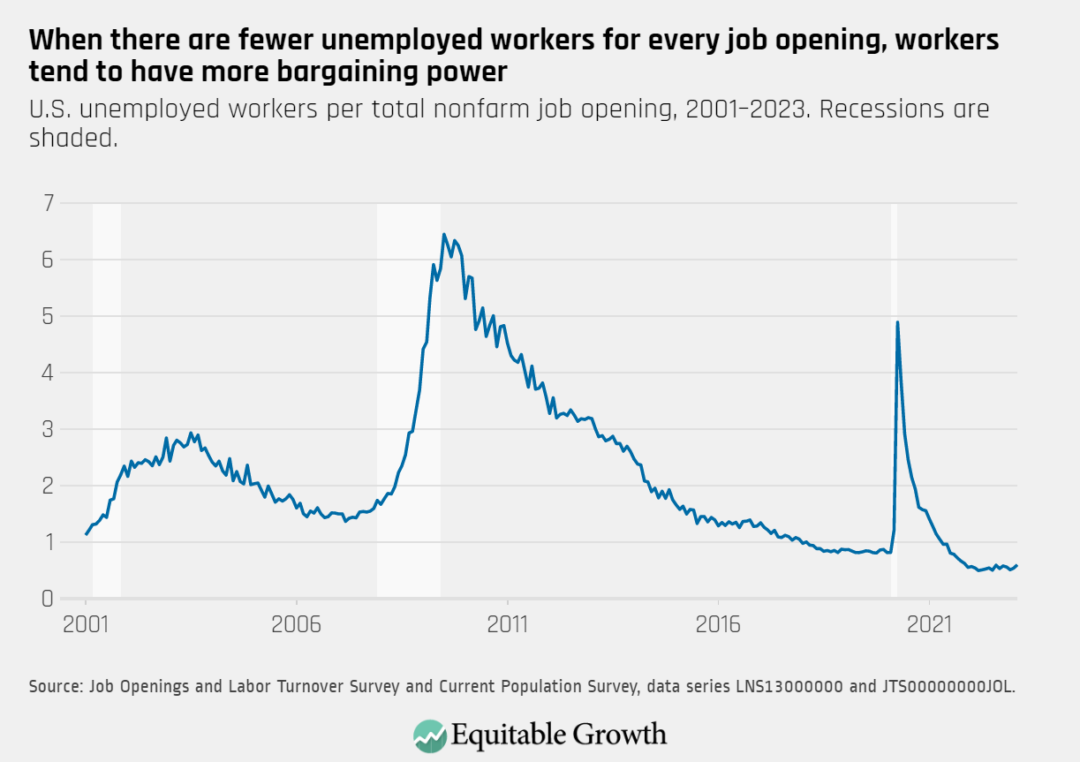
The ratio of unemployed workers to job openings rose to almost 0.60 in February from just under 0.54 in January.
![Job Openings and Labor Turnover Survey and Current Population Survey, data series LNS13000000 and JTS00000000JOL.](https://equitablegrowth.org/wp-content/uploads/2023/04/When-there-are-fewer-unemployed-workers-for-every-job-opening-workers-tend-to-have-more-bargaining-power-1080x762.png)
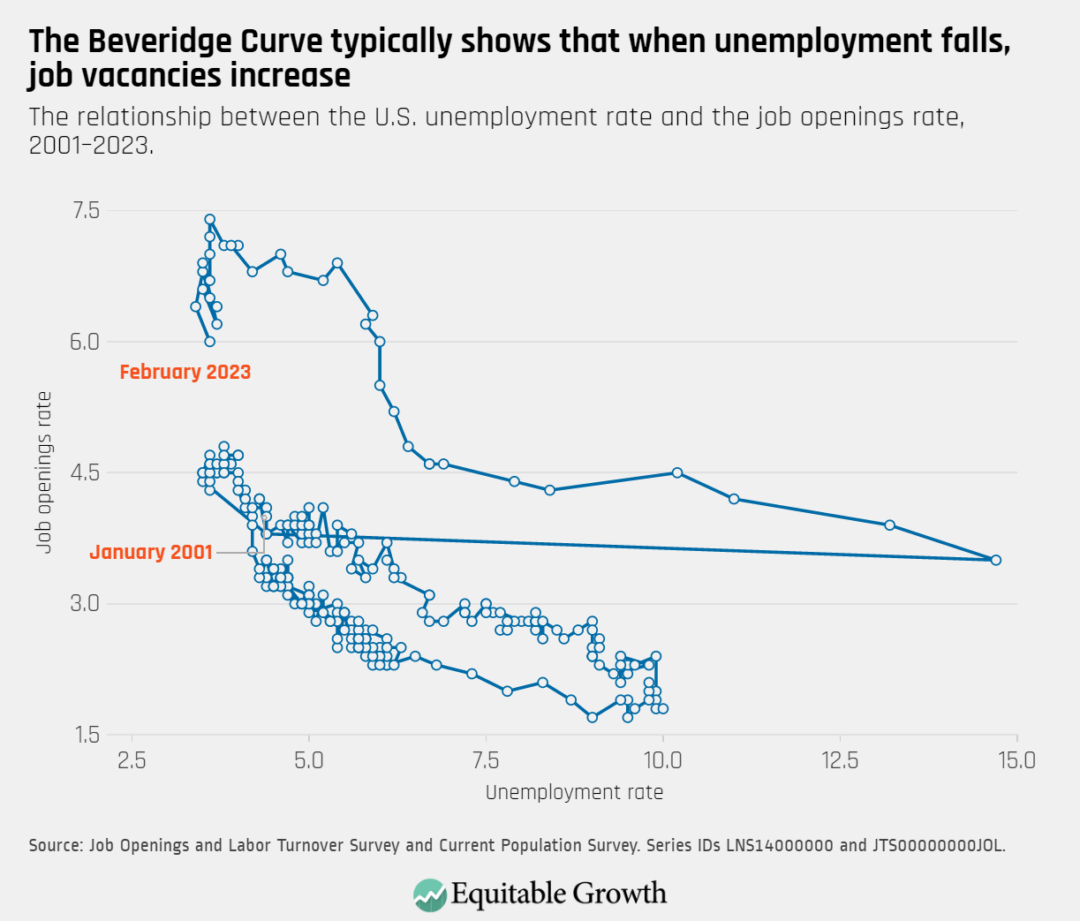
The Beveridge Curve moved downward and to the right in February, as the unemployment rate ticked up to 3.6 percent and the rate of job openings fell to 6.0 percent.
![The relationship between the U.S. unemployment rate and the job openings rate, 2001–2023.](https://equitablegrowth.org/wp-content/uploads/2023/04/The-Beveridge-Curve-typically-shows-that-when-unemployment-falls-job-vacancies-increase-1080x921.png)
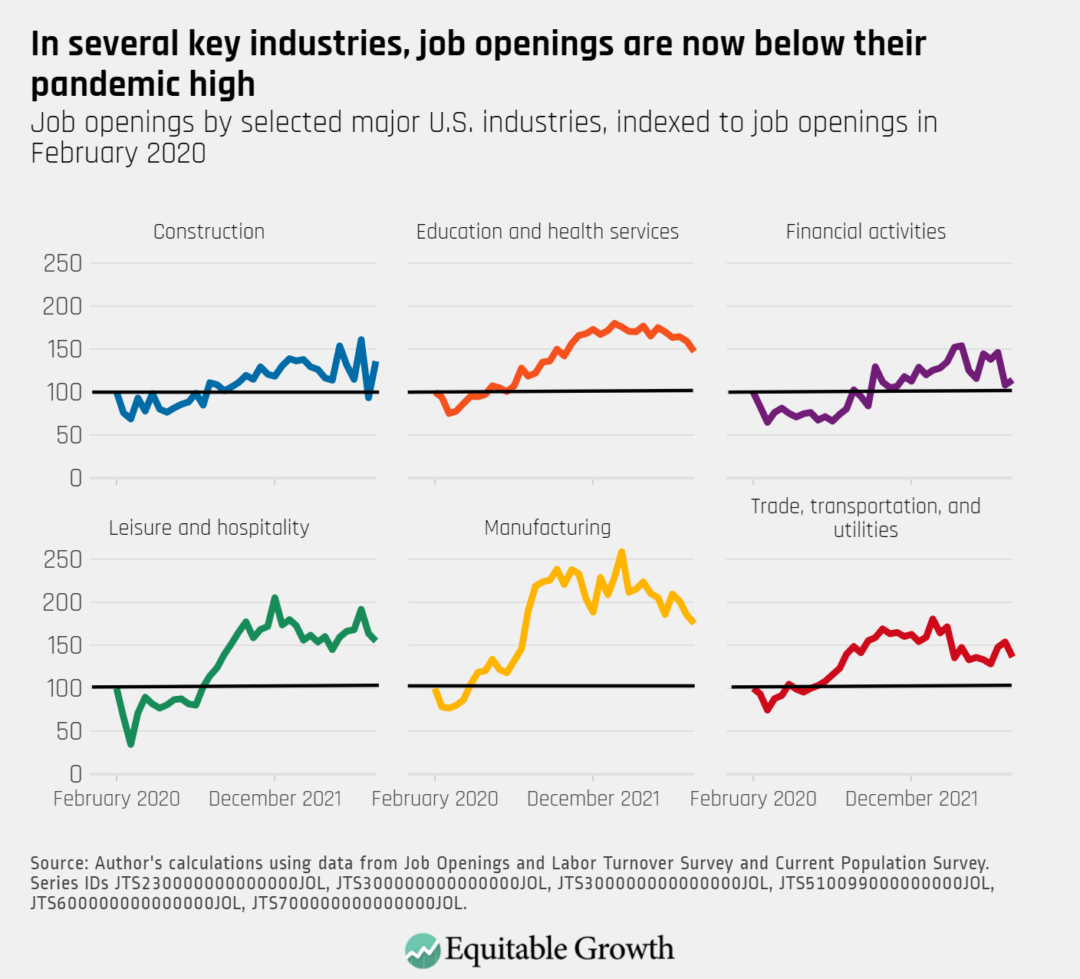
The overall number of reported job openings decreased by 632,000 in February. Openings fell in industries such as education & health services, leisure & hospitality, and manufacturing, but rose in construction.
![Job openings by selected major U.S. industries, indexed to job openings in February 2020](https://equitablegrowth.org/wp-content/uploads/2023/04/Job-openings-are-below-their-pandemic-high-across-some-key-industries-1080x979.png)