JOLTS Day Graphs: February 2019 Report Edition
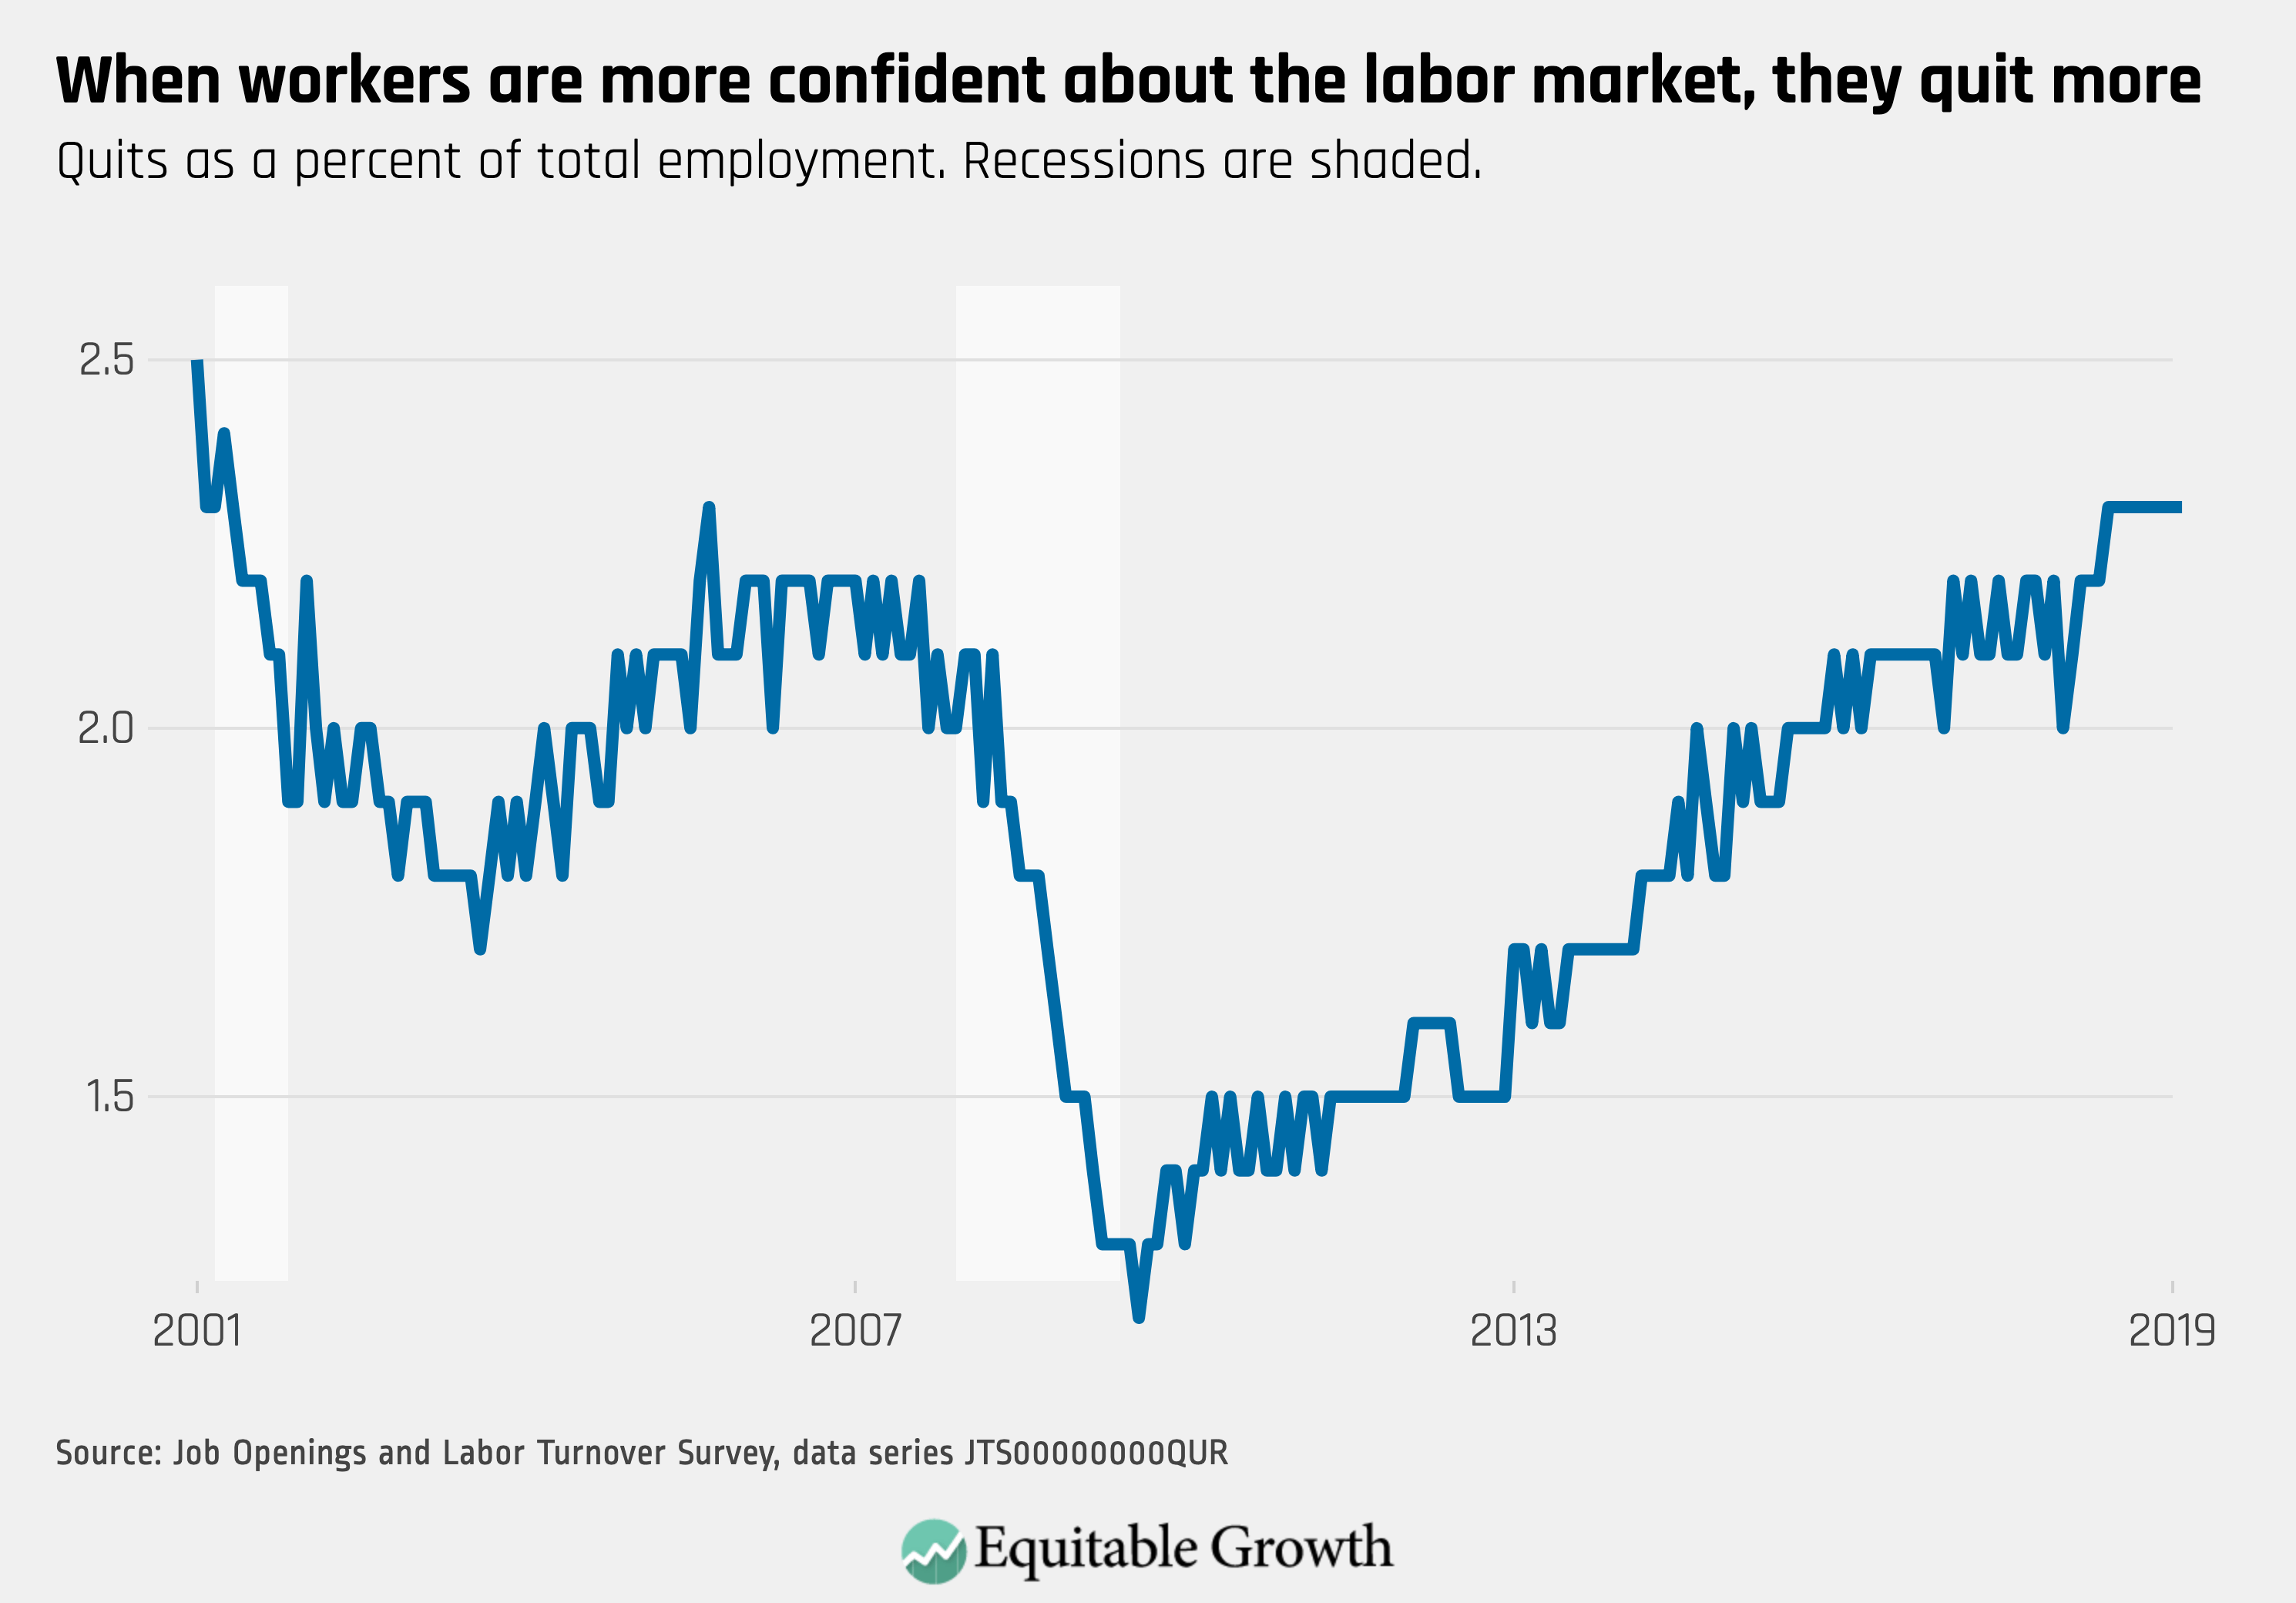
Every month the U.S. Bureau of Labor Statistics releases data on hiring, firing, and other labor market flows from the Job Openings and Labor Turnover Survey, better known as JOLTS. Today, the BLS released the latest data for February 2019. This report doesn’t get as much attention as the monthly Employment Situation Report, but it contains useful information about the state of the U.S. labor market. Below are a few key graphs using data from the report.

1.

The quits rate continued to hold steady at a high rate of 2.3%, reflecting worker confidence about finding another job.
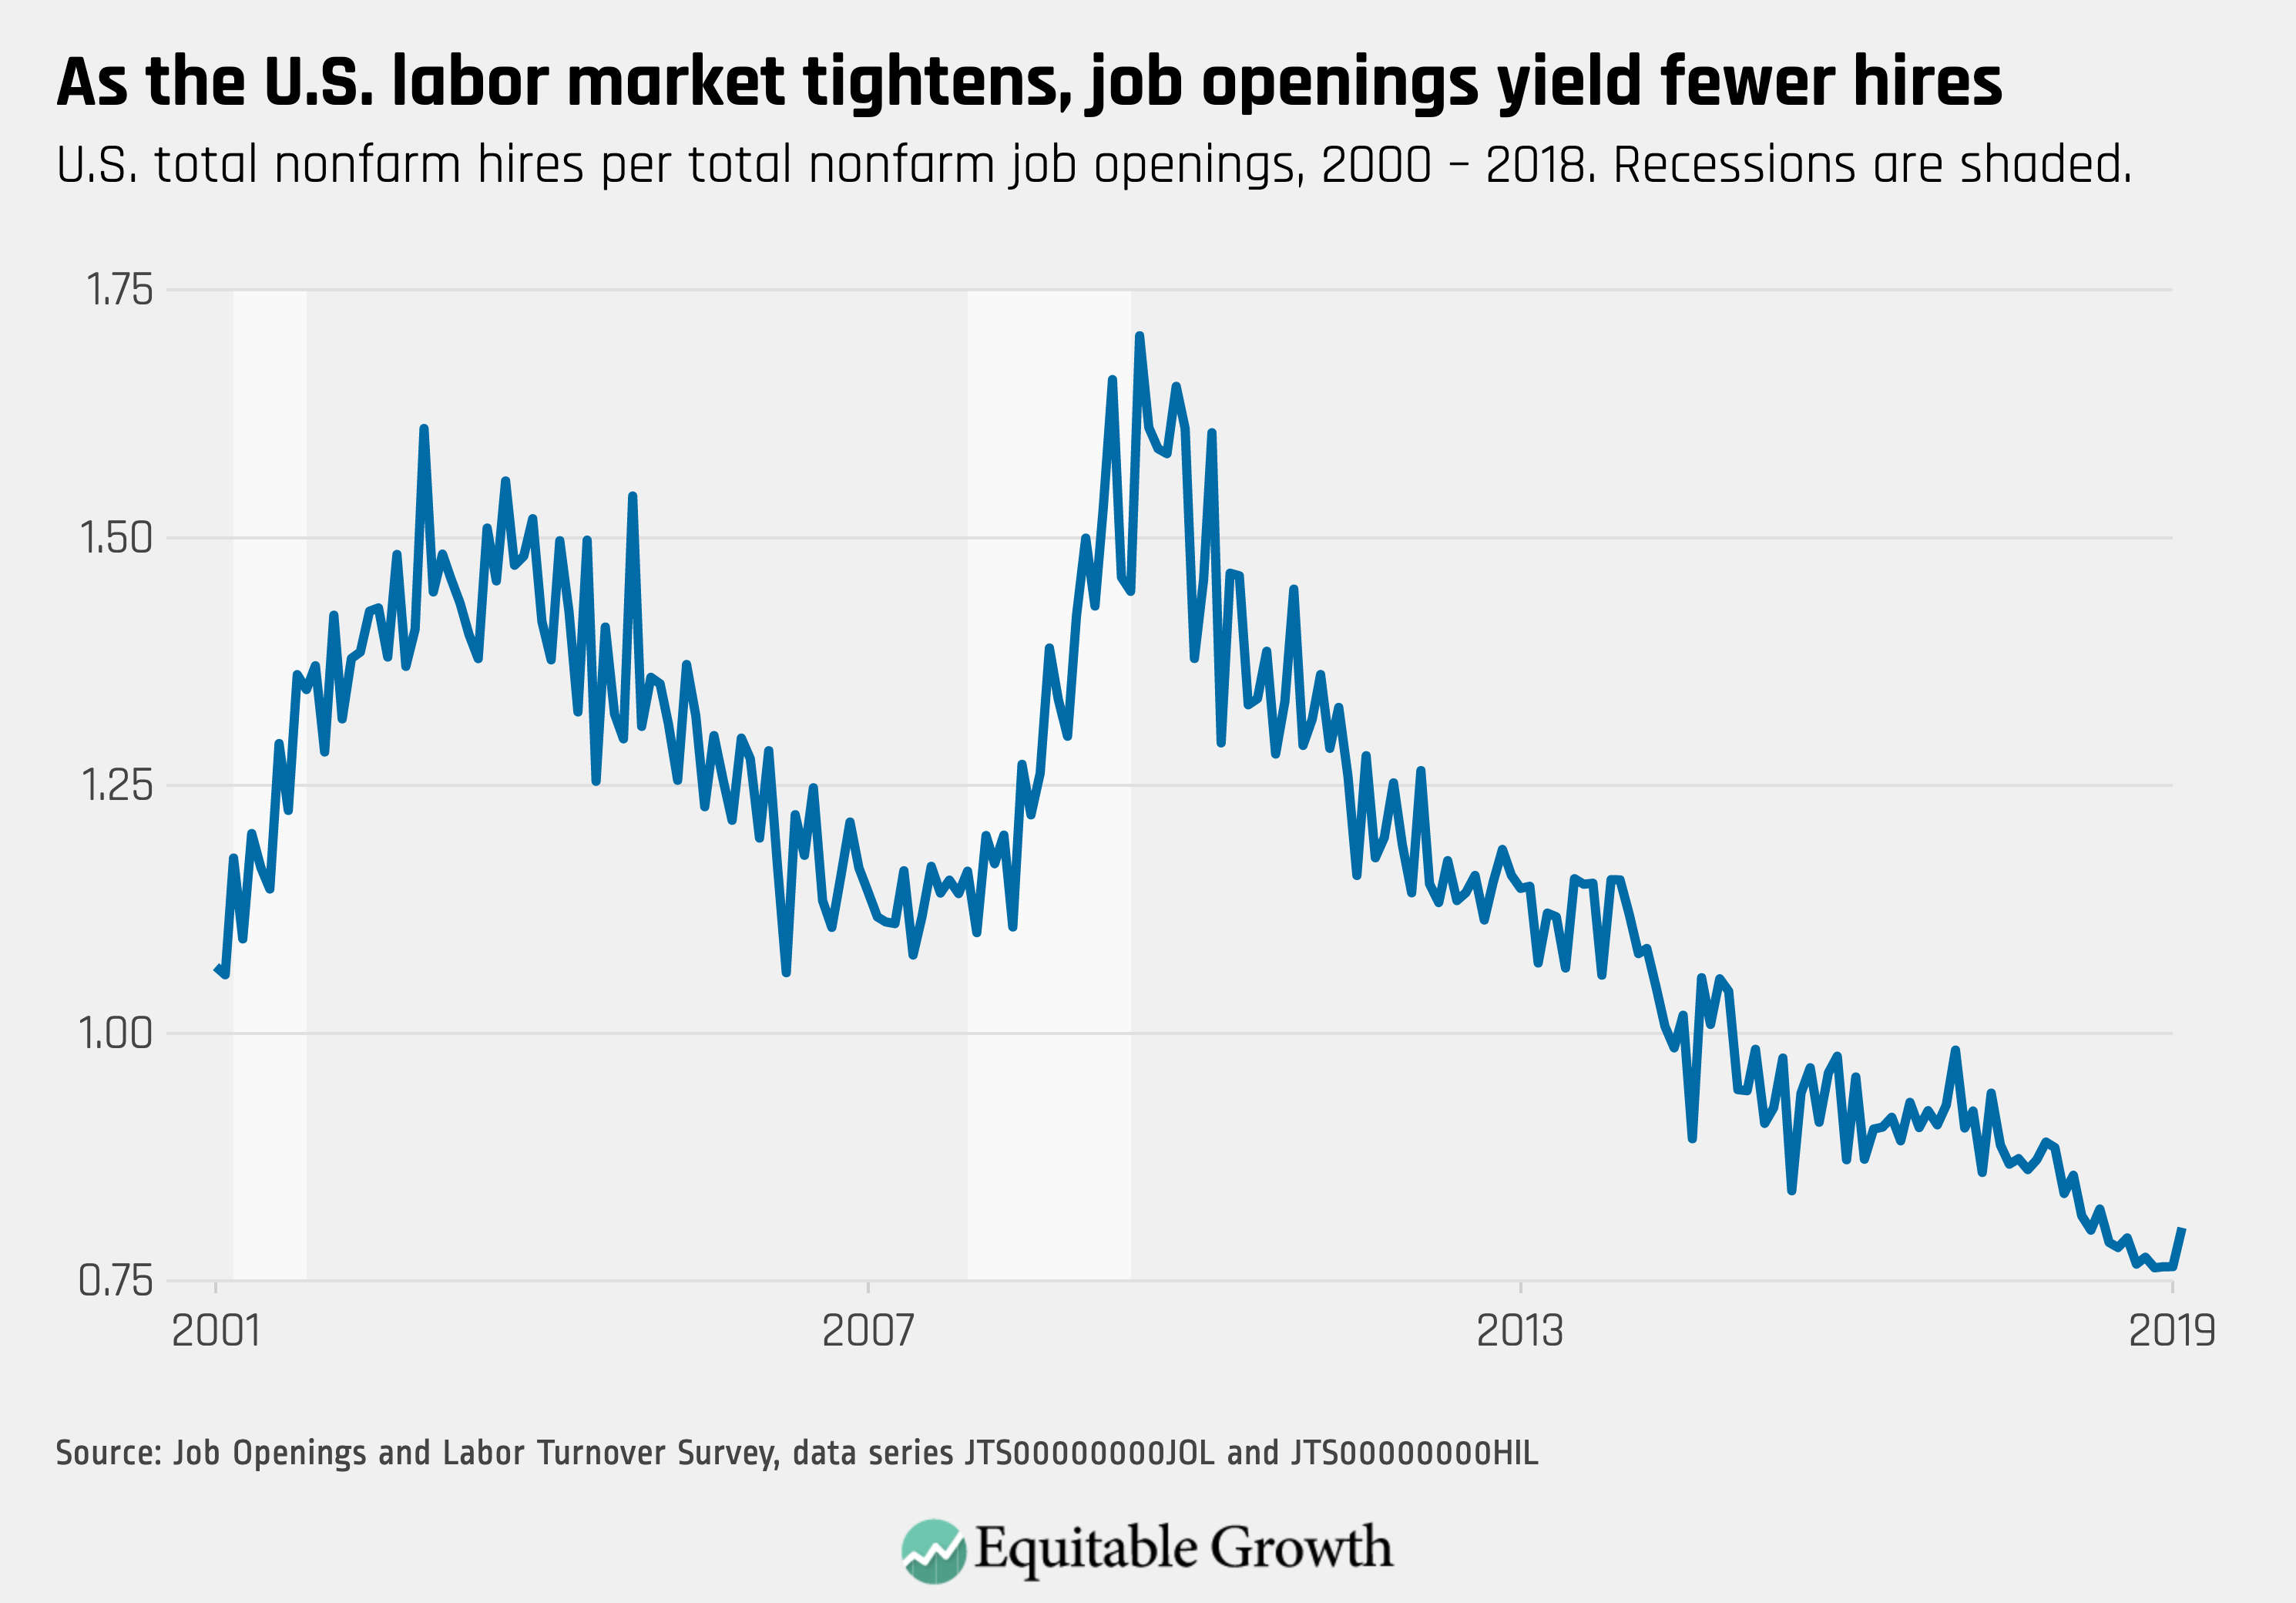
2.

Hires stayed constant in February while job openings declined, so the ratio of hire-per-job opening increased in spite of its downward trend.
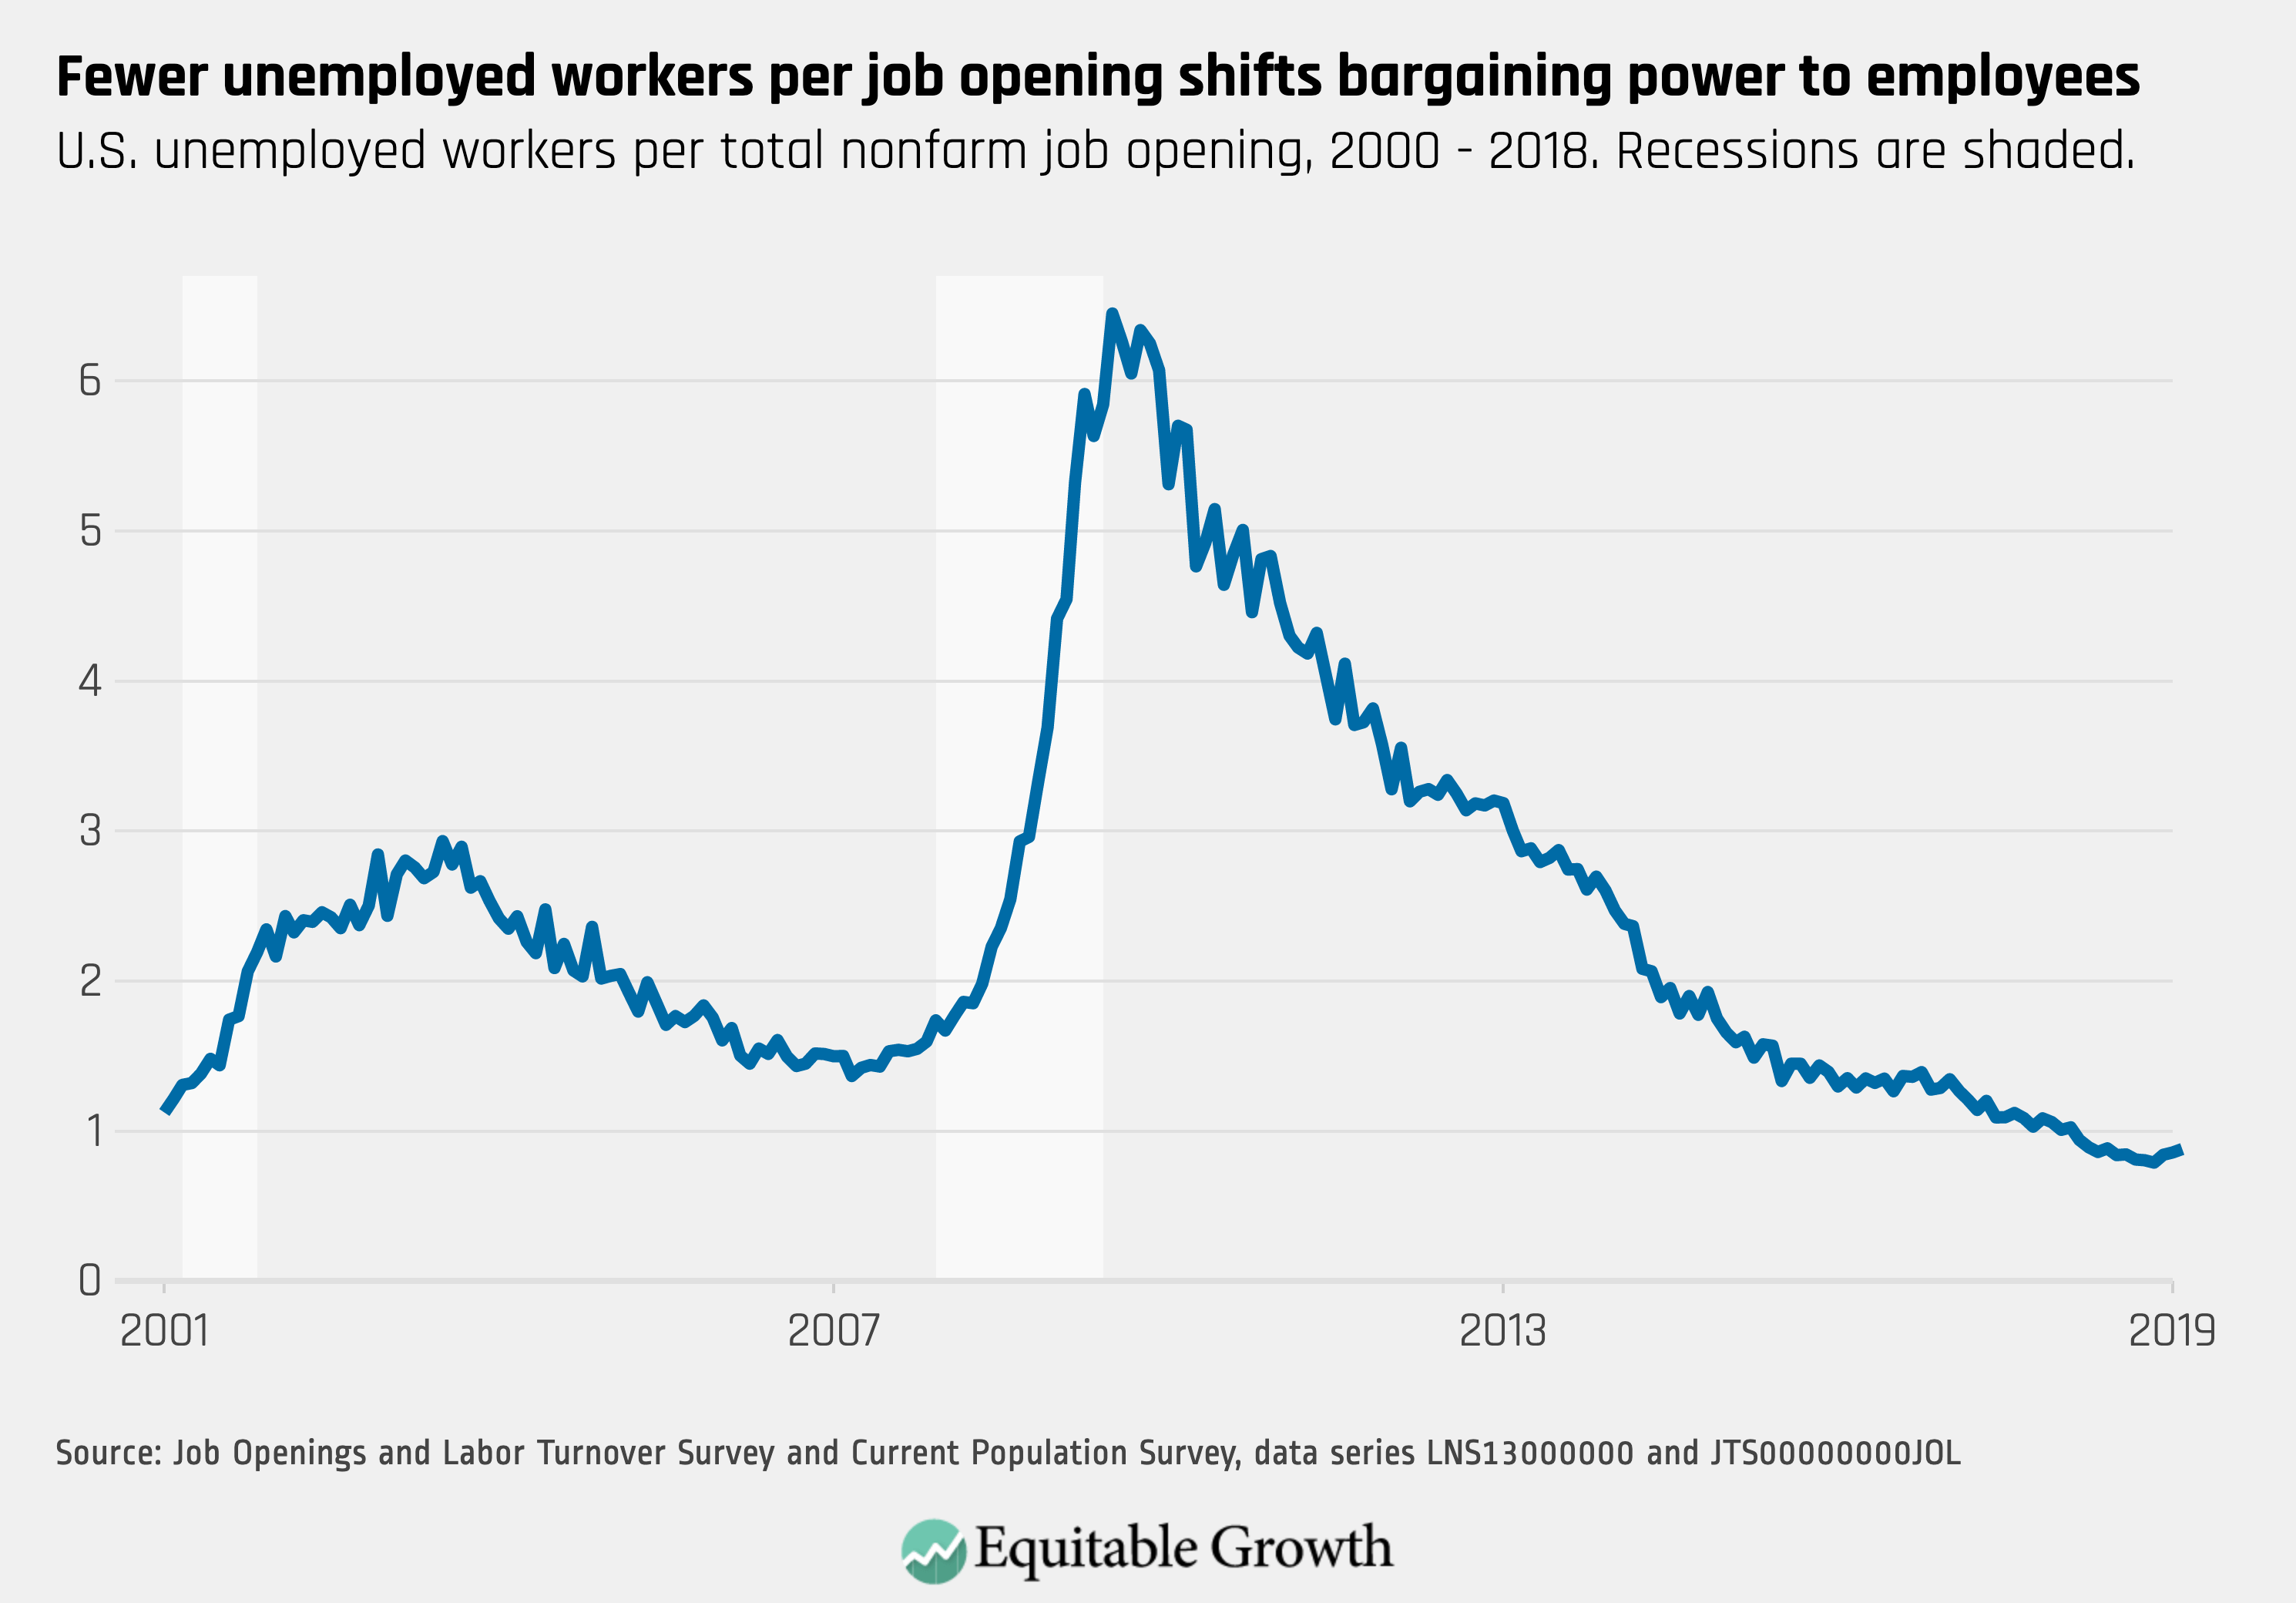
3.

As job openings declined in February, the ratio of unemployed workers to openings increased, but notably remains below 1 unemployed worker per opening.
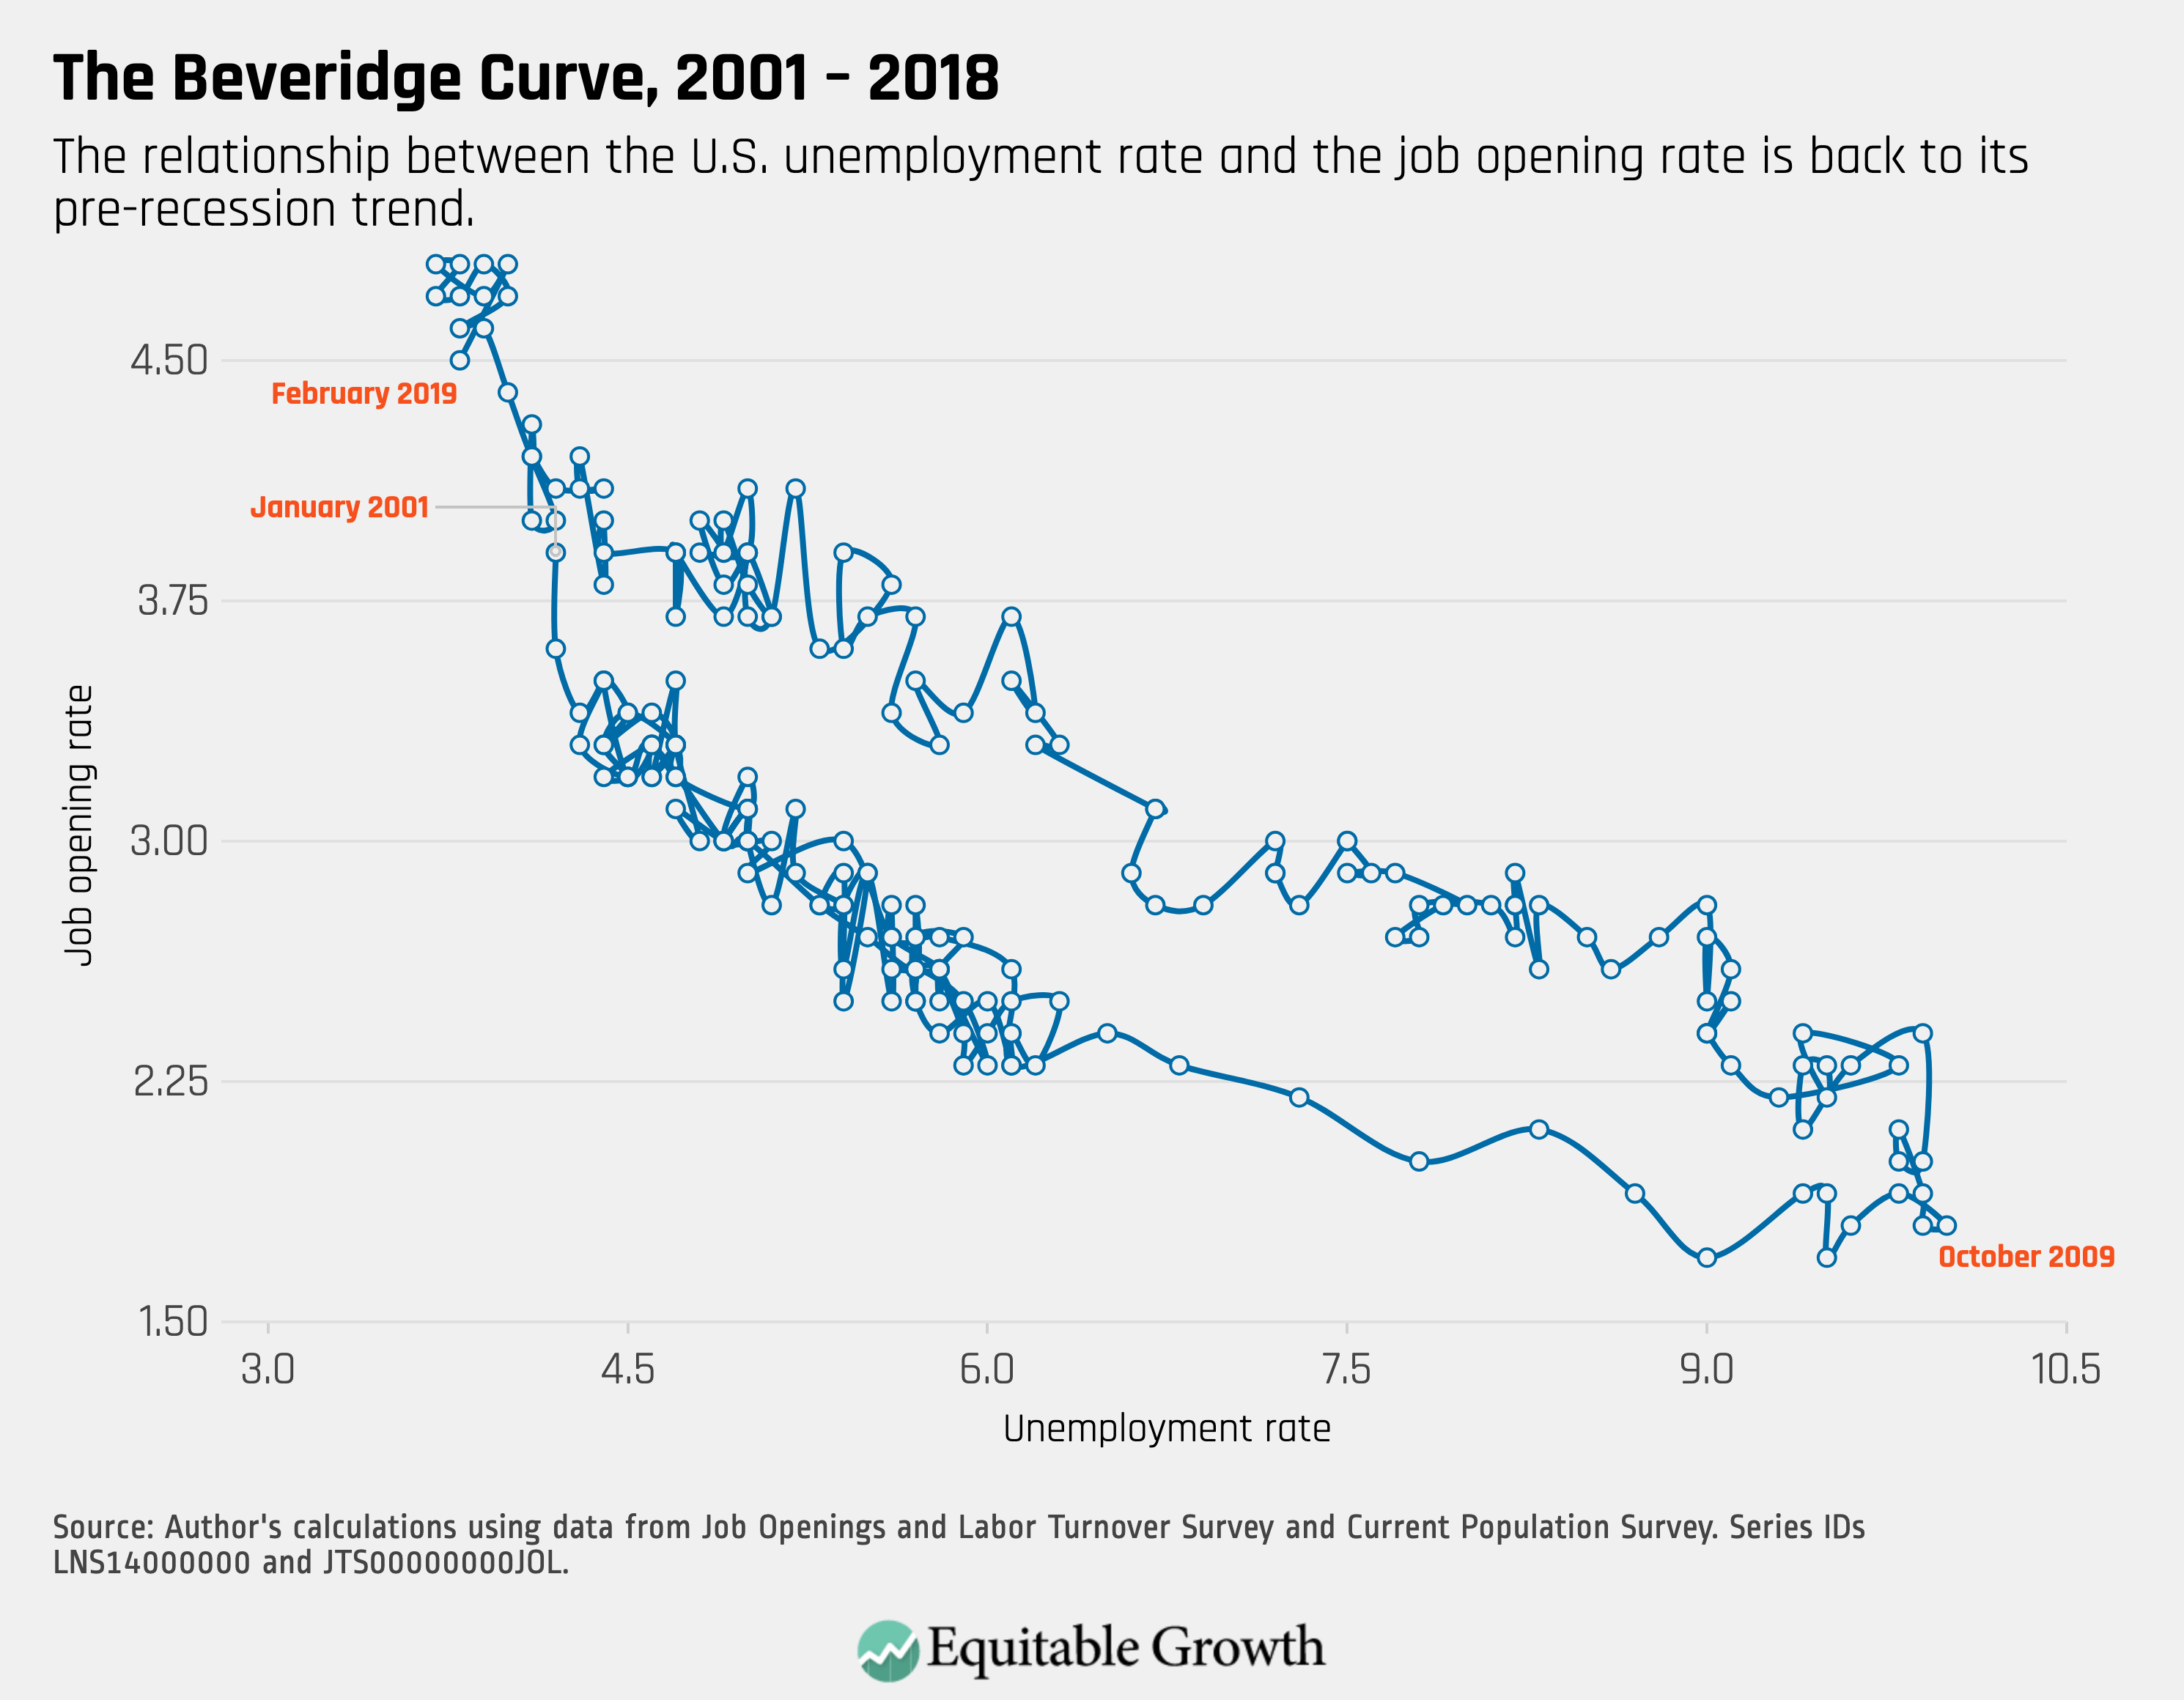
4.

The Beveridge Curve continues its upward trend, hovering around the levels of the early 2000s expansion.

Connect with us!

Explore the Equitable Growth network of experts around the country and get answers to today's most pressing questions!

Get in Touch