JOLTS Day Graphs: April 2022 Edition

Every month the U.S. Bureau of Labor Statistics releases data on hiring, firing, and other labor market flows from the Job Openings and Labor Turnover Survey, better known as JOLTS. Today, the BLS released the latest data for April 2022. This report doesn’t get as much attention as the monthly Employment Situation Report, but it contains useful information about the state of the U.S. labor market. Below are a few key graphs using data from the report.

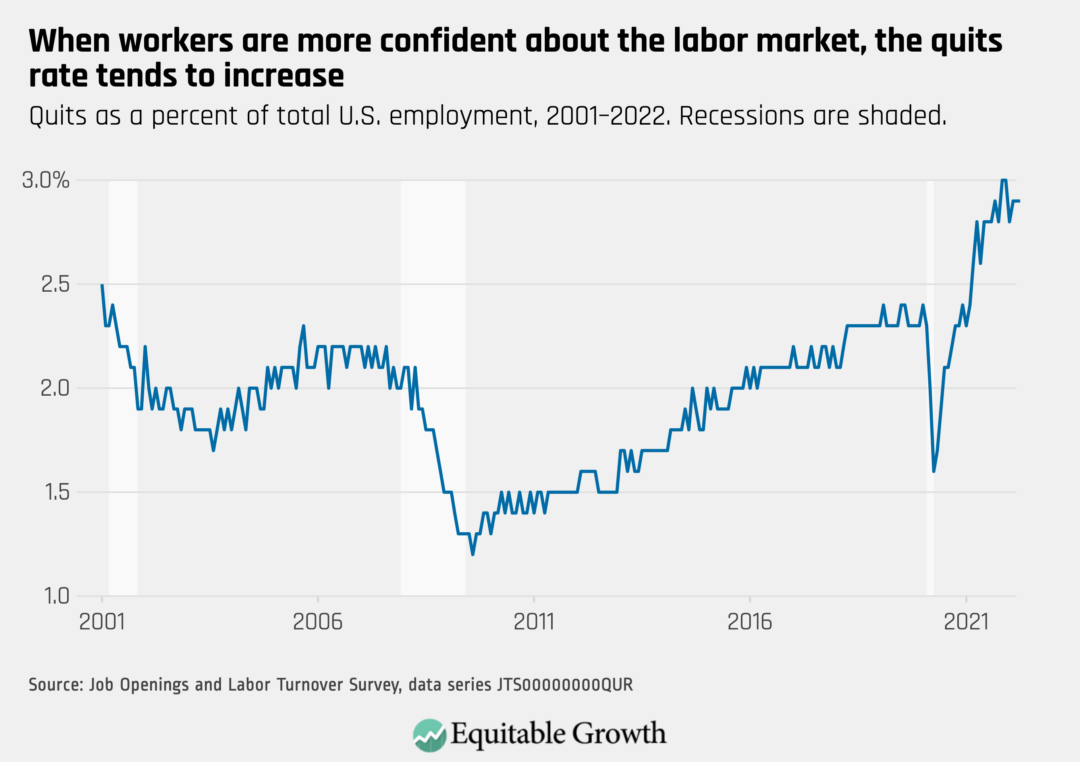
The quits rate remained steady at 2.9 percent as 4.4 million workers quit their jobs in April.

Quits as a percent of total U.S. employment, 2001–2022. Recessions are shaded.

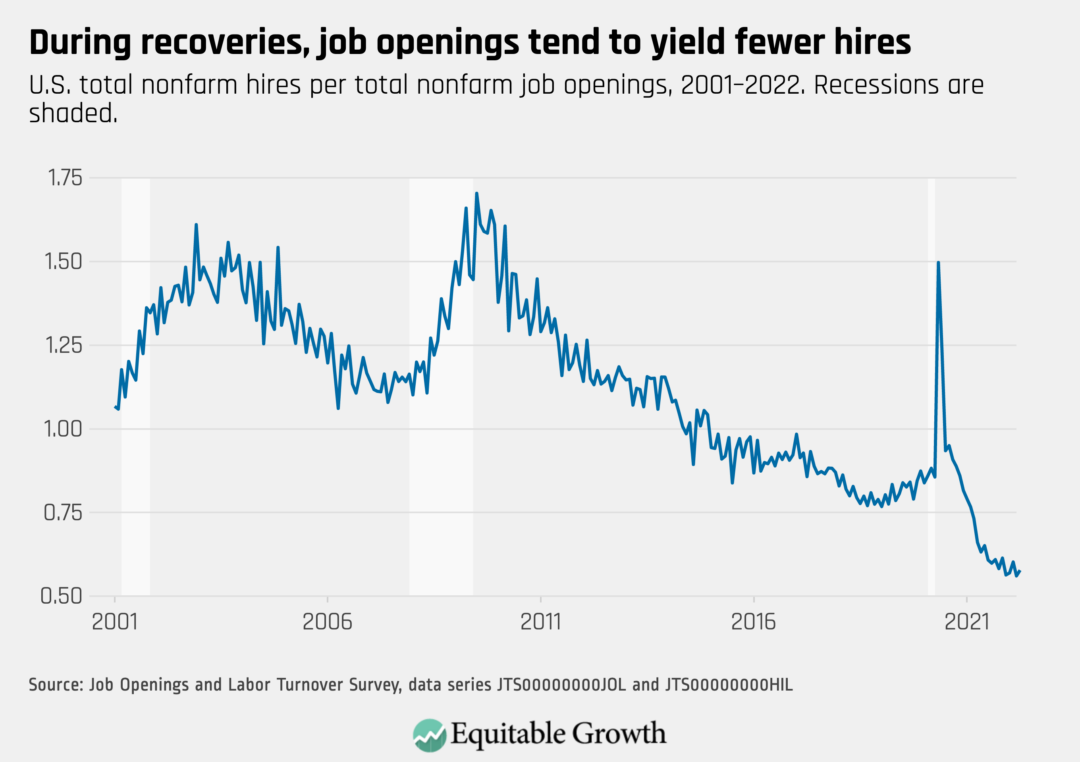
As job openings declined to 11.4 million and hires remained at 6.6 million, the vacancy yield increased to 0.58 in April from a series low of 0.56 in March.

U.S. total nonfarm hires per total nonfarm job openings, 2001–2022. Recessions are shaded.

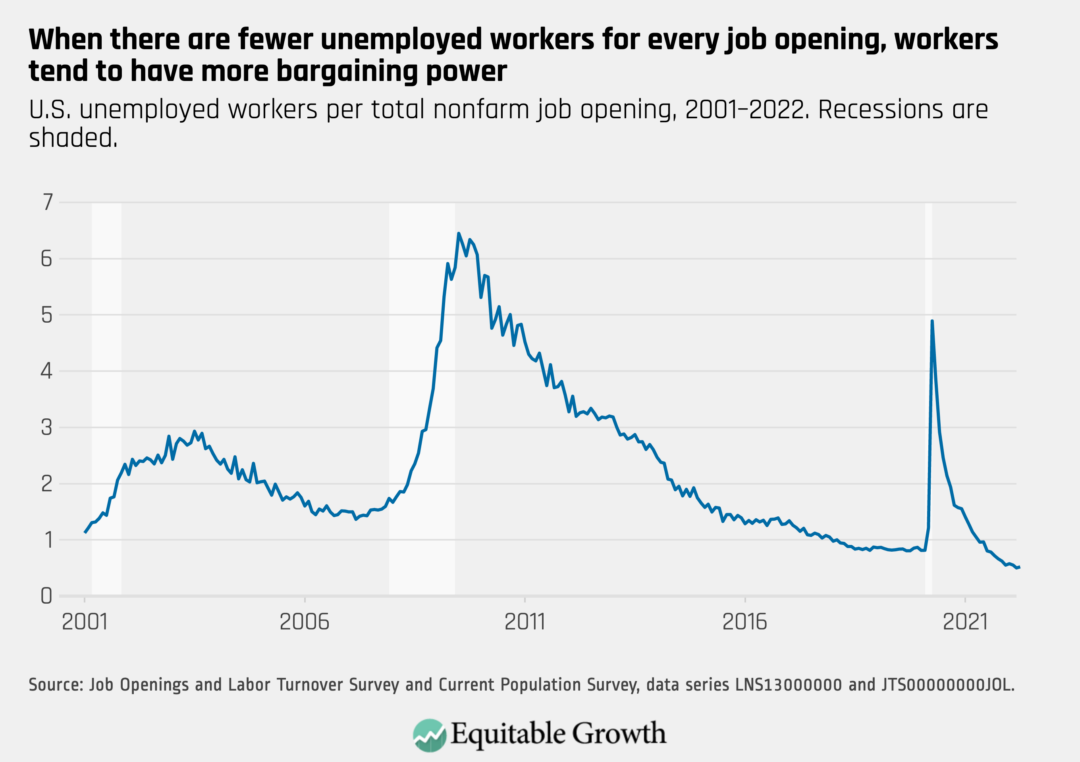
There were 0.52 unemployed workers for every job opening in April, rising from 0.50 the previous month.

U.S. unemployed workers per total nonfarm job opening, 2001–2022. Recessions are shaded.

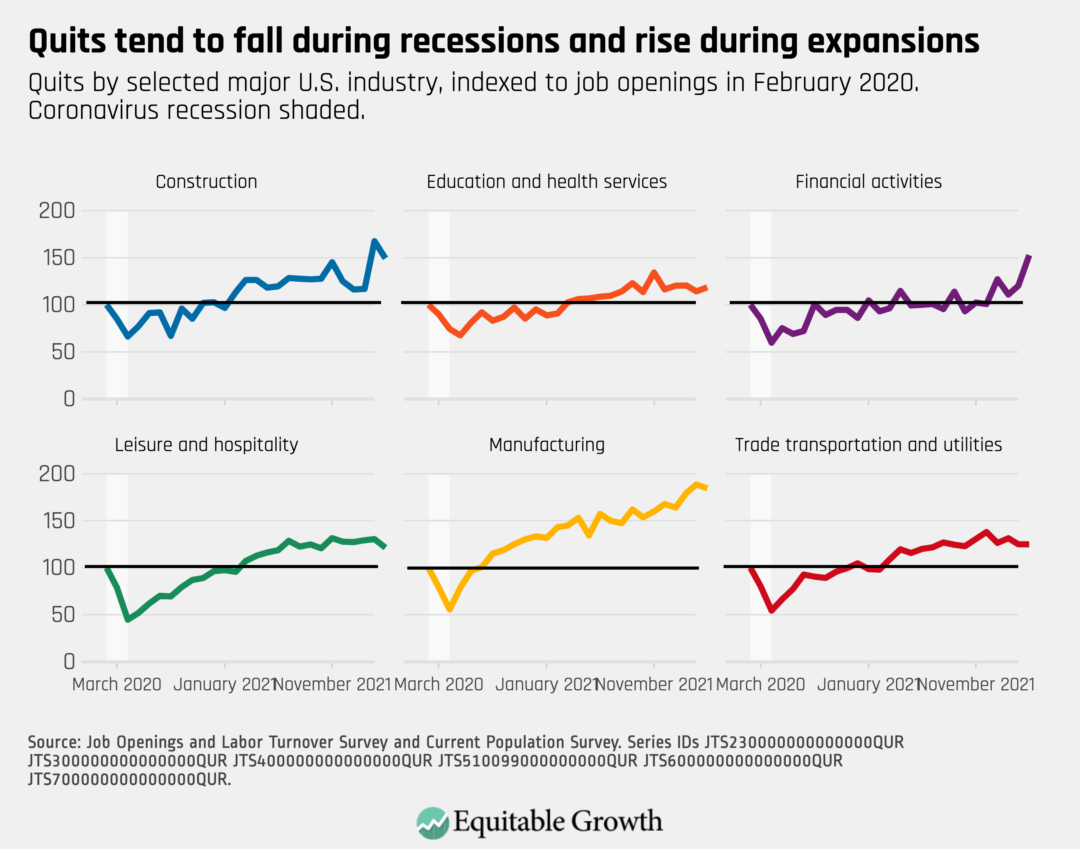
The total number of quits remained steady in April, rising in some industries, such as financial activities, and beginning to fall in others, such as manufacturing and construction.

Quits by selected major U.S. industry, indexed to job openings in February 2020. Coronavirus recession shaded.
Connect with us!

Explore the Equitable Growth network of experts around the country and get answers to today's most pressing questions!

Get in Touch