Archives: Interactives
Interactives
AAPI disaggregation
Smeeding Interactive
Earnings by demographic
wage mobility interactive 2
wage mobility interactive 1
In-use and emerging technologies
In-use and emerging technologiesStepping back from the specifics of clean air regulations for a moment, let’s examine the ways in which already-in-use technologies can be modified by regulations. It may be helpful to compare and contrast in-use technologies or mature technologies with new or emerging technologies. The contrast between the two isn’t as strong as the vocabulary might suggest. Emerging technologies are simultaneously full of promise and danger, while mature technologies seem to be more predictable. The promises of a mature technology are manifest and the dangers seemingly under control. The term “emerging technology” is only used as an indicator that these technologies have the potential to go either way—toward a utopian or dystopian future. When change is easy, the need for it cannot be foreseen; when the need for change is apparent, change has become expensive, difficult, and time-consuming. Emerging technologies are often considered a particularly challenging regulatory problem. The “Collingridge dilemma” in the field of technology assessment—named after the late professor David Collingridge of the University of Aston’s Technology Policy Unit—posits that it is difficult, perhaps impossible, to anticipate the impacts of a new technology until it is widely in use, but once it is in wide use, it is then difficult or perhaps impossible to control the pace of change (regulate) of the technology precisely because it is in wide use. Nowadays, it is often common in economic and political rhetoric to hear of the speed of technological development as a further obstacle to effective regulation. |
Defining income groups and young families
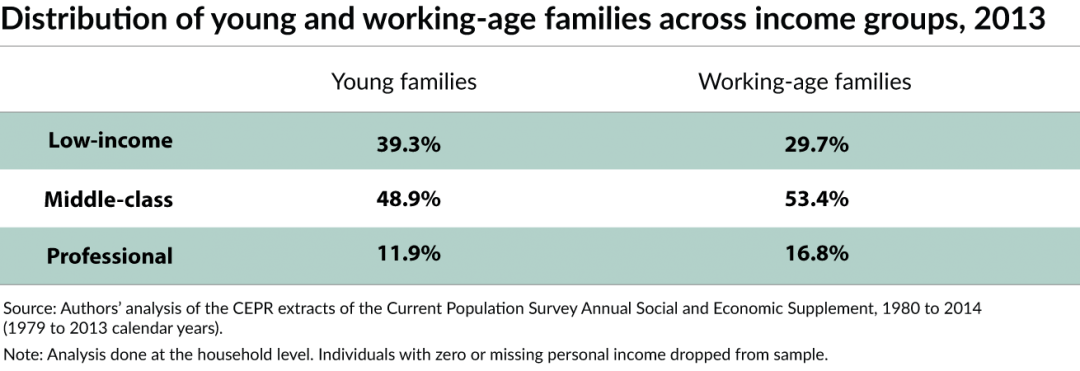
Defining income groups and young familiesThe analysis in this issue brief follows the same methodology presented in “Finding Time.” For ease of composition, we use the term “family” throughout the brief, even though the analysis is done at the household level. In this issue brief, we refer to what we call “young” families and compare their experiences to “working-age” families. A working-age family (the subject of an earlier issue brief) is one where at least one person in the household is between the ages of 16 and 64. Young families are a subset of these working-age families: Young families are those that have at least one person over the age of 16 and where everyone is under 35 years of age. We split households in our sample into three income groups:
Table 1 breaks down the share of young families (a subset of these working-age families) across the three income groups in 2013. Young families are more likely than working-age families to be low-income. Table 1
|
labor force participation interactive 1
Defining income groups and family race
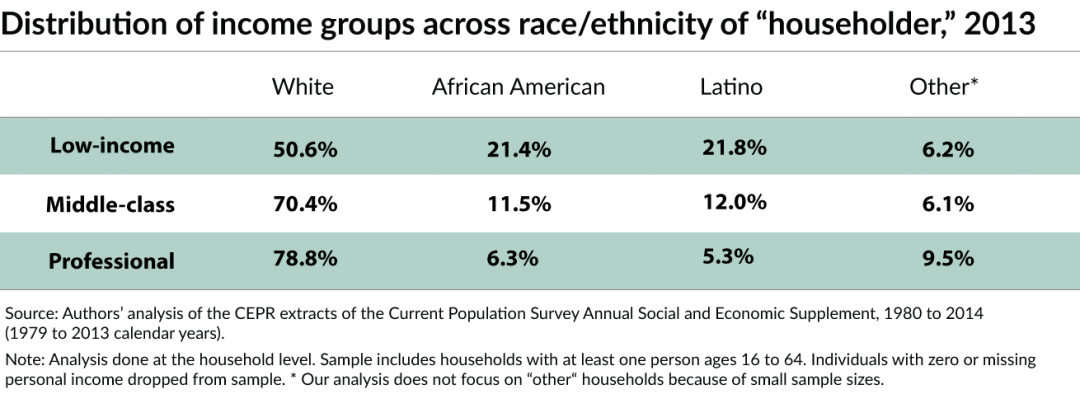
Defining income groups and family raceThis analysis follows the same methodology presented in “Finding Time.” For ease of composition, we use the term “family” throughout the brief, even though the analysis is done at the household level. We split households in our sample into three income groups. Low-income households are those in the bottom third of the income distribution, earning less than $25,440 per year in 2015 dollars. Professional households are those in the top fifth of the income distribution who have at least one household member with a college degree or higher; these households have an income of $71,158 or higher in 2015 dollars. Everyone else falls in the middle-class category. It’s more complex to define what race or ethnicity a family should be categorized as, especially considering the growing share of multiracial and multiethnic households in the United States. In this brief, we categorize a family as white, African American, or Latino based on the race and ethnicity of the person identified by the Census as the “household head.” We recognize this is an approximation and ideally the categories would be more inclusive. Breaking the category down smaller, however, does not give us a large-enough sample size for our analysis. Table 1 breaks down the distribution of racial and ethnic groups within each income group. Low-income families have a higher share of African American and Latino families, compared to middle-class or professional families. Table 1
|


