JOLTS Day Graphs: September 2017 Report Edition
Every month the U.S. Bureau of Labor Statistics releases data on hiring, firing, and other labor market flows from the Job Openings and Labor Turnover Survey, better known as JOLTS. Today, the BLS released the latest data for September 2017. This report doesn’t get as much attention as the monthly Employment Situation Report, but it contains useful information about the state of the U.S. labor market. Below are a few key graphs using data from the report.
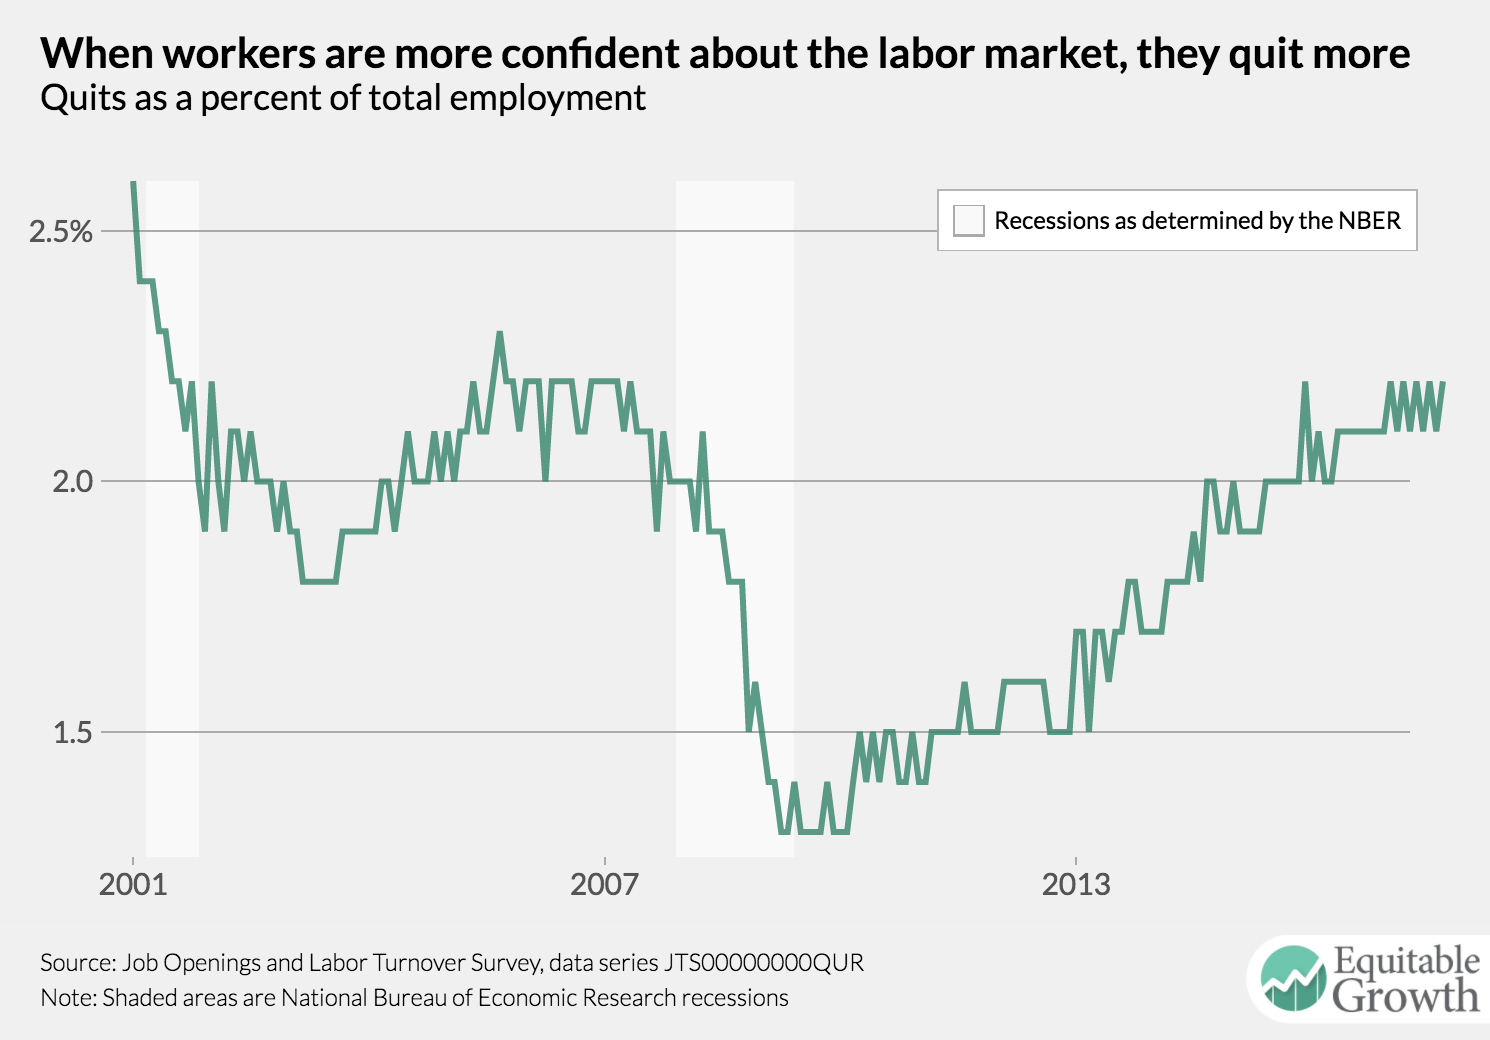
The rate at which workers are quitting their jobs hasn’t changed much over the last year, coming in at 2.2 percent in September.
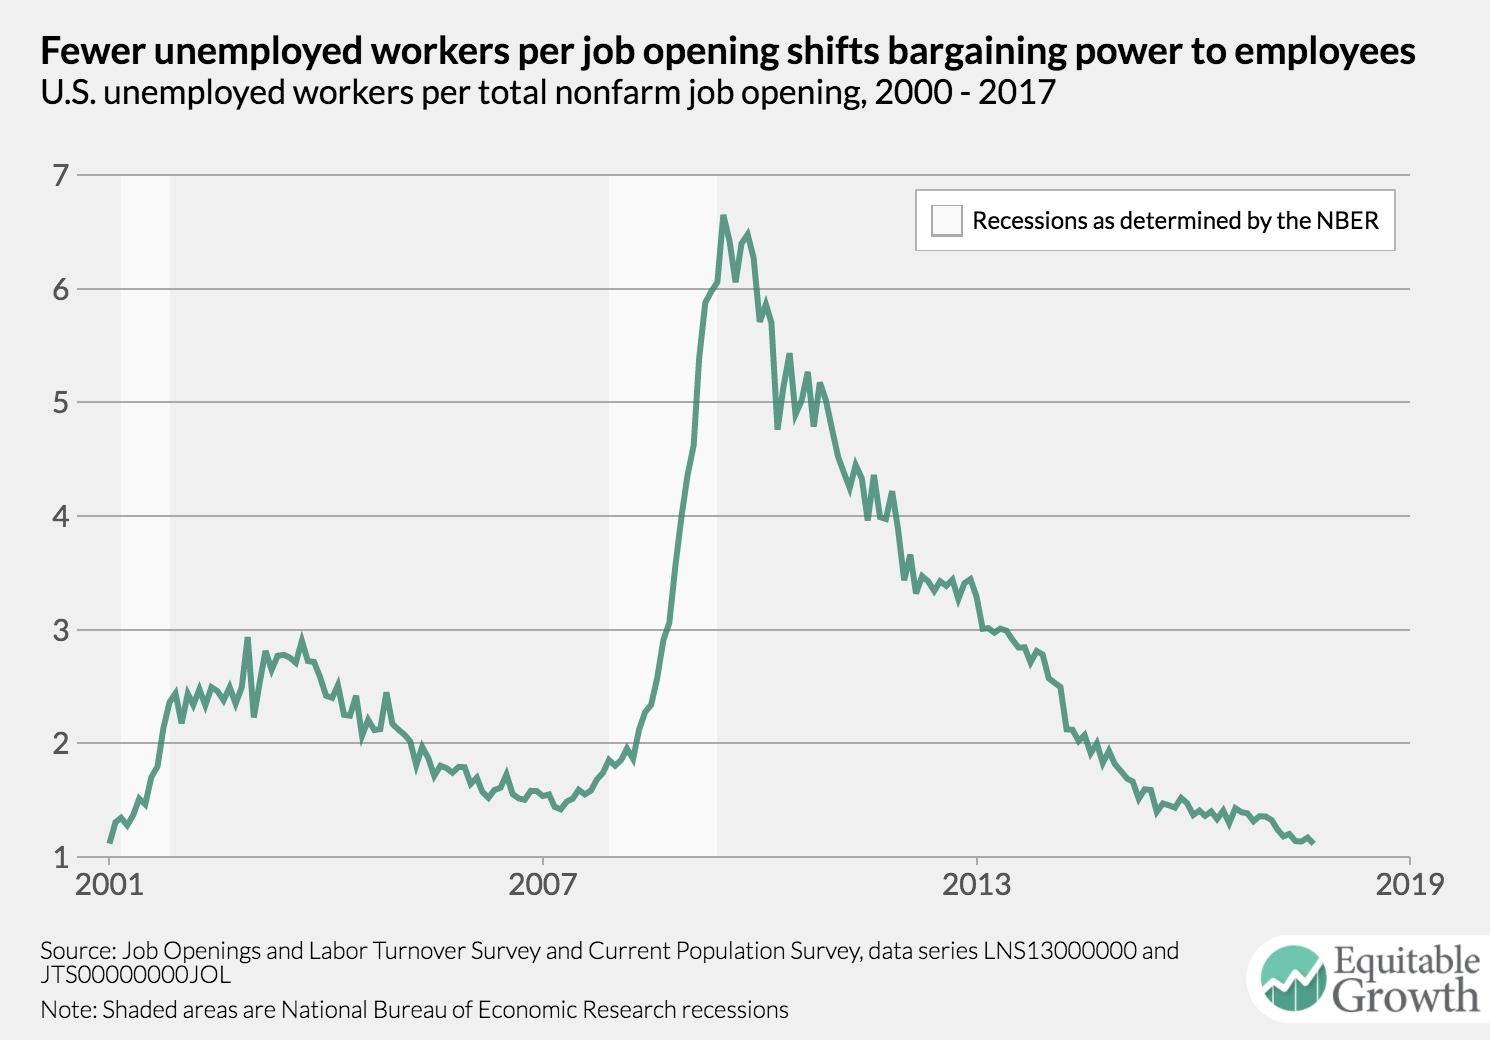
The ratio of unemployed workers to job vacancies was 1.116 in September, the lowest recorded level in the JOLTS data.
As the labor market has tightened, job vacancies are producing fewer and fewer hires. The vacancy yield has been below 1 for several years.

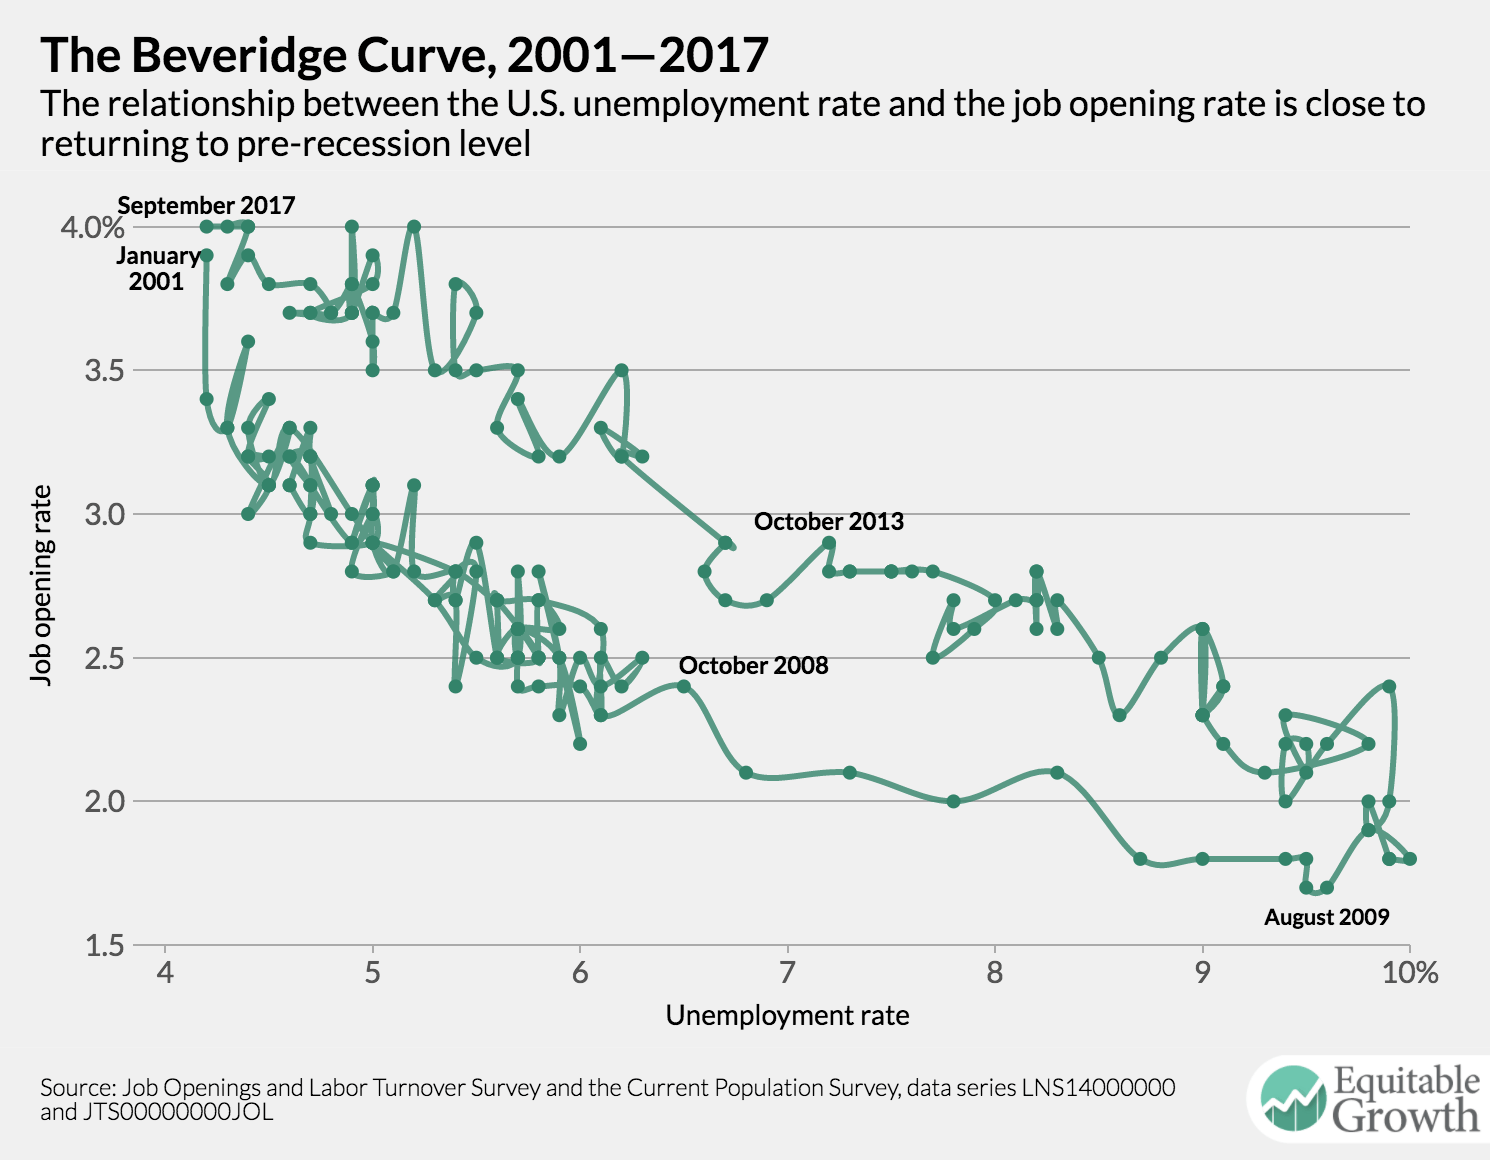
The Beveridge Curve, after shifting outward during the recession, has returned to its 2001—2007 relationship.