JOLTS Day Graphs: April 2017 Report Edition
Every month the U.S. Bureau of Labor Statistics releases data on hiring, firing, and other labor market flows from the Job Openings and Labor Turnover Survey, better known as JOLTS. Today, the BLS released the latest data for April 2017. This report doesn’t get as much attention as the monthly Employment Situation Report, but it contains useful information about the state of the U.S. labor market. Below are a few key graphs using data from the report.
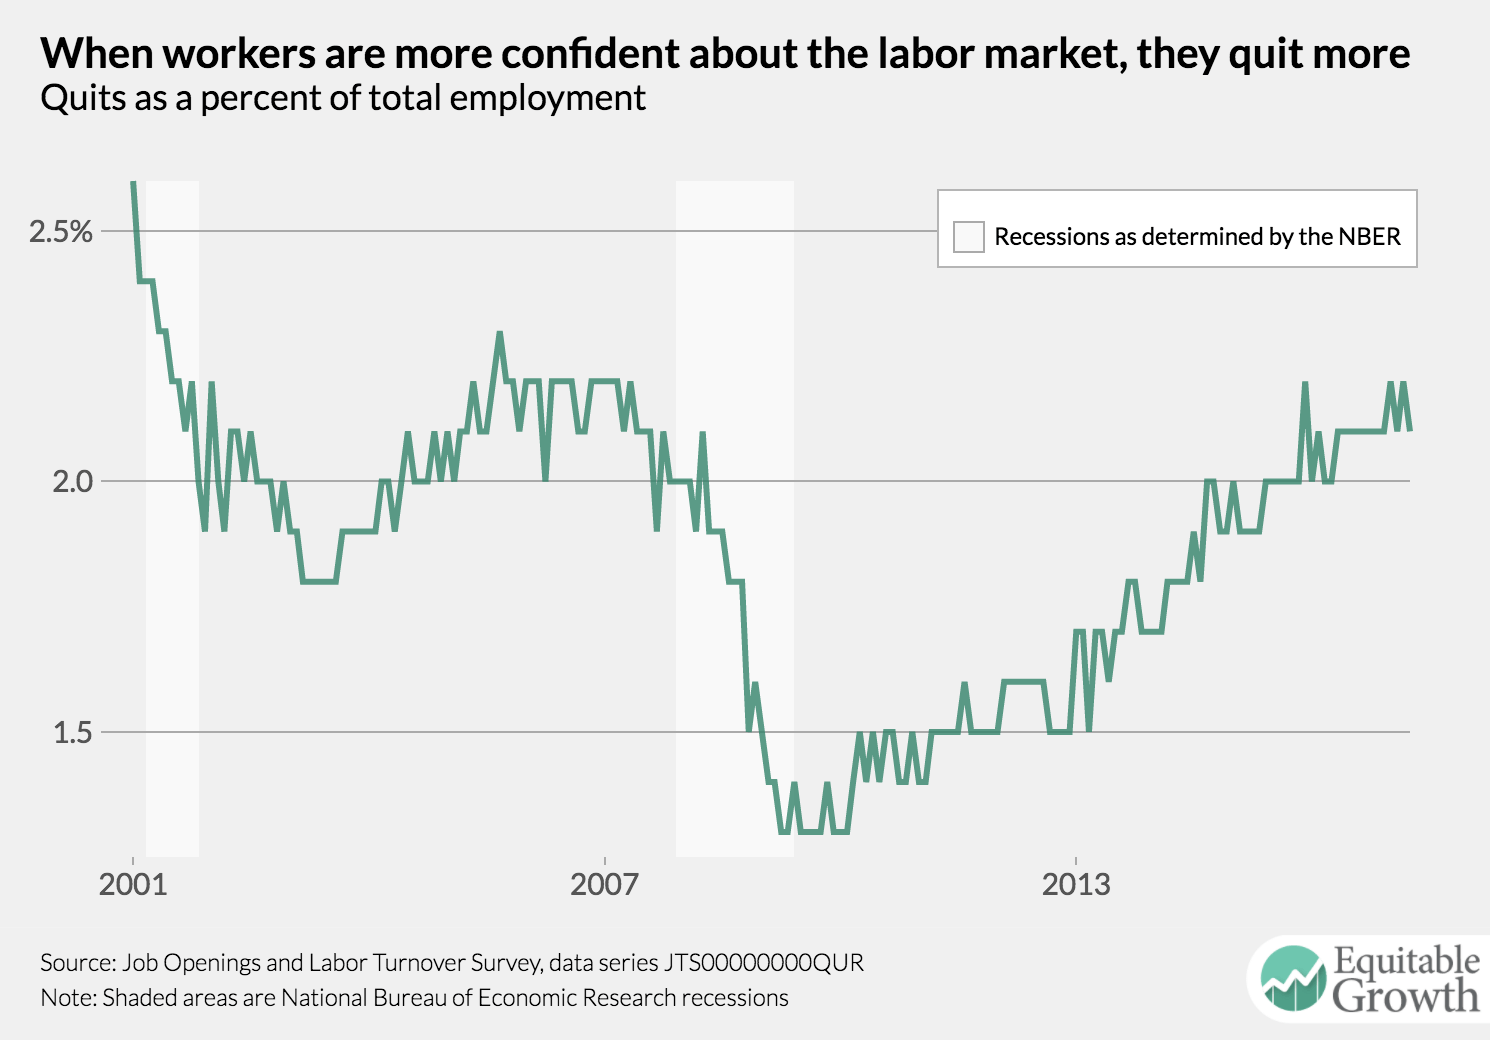
The quits rate declined slightly to 2.1 percent, but that’s familiar territory for the statistic. It’s been 2.1 percent in 10 of the past 12 months.
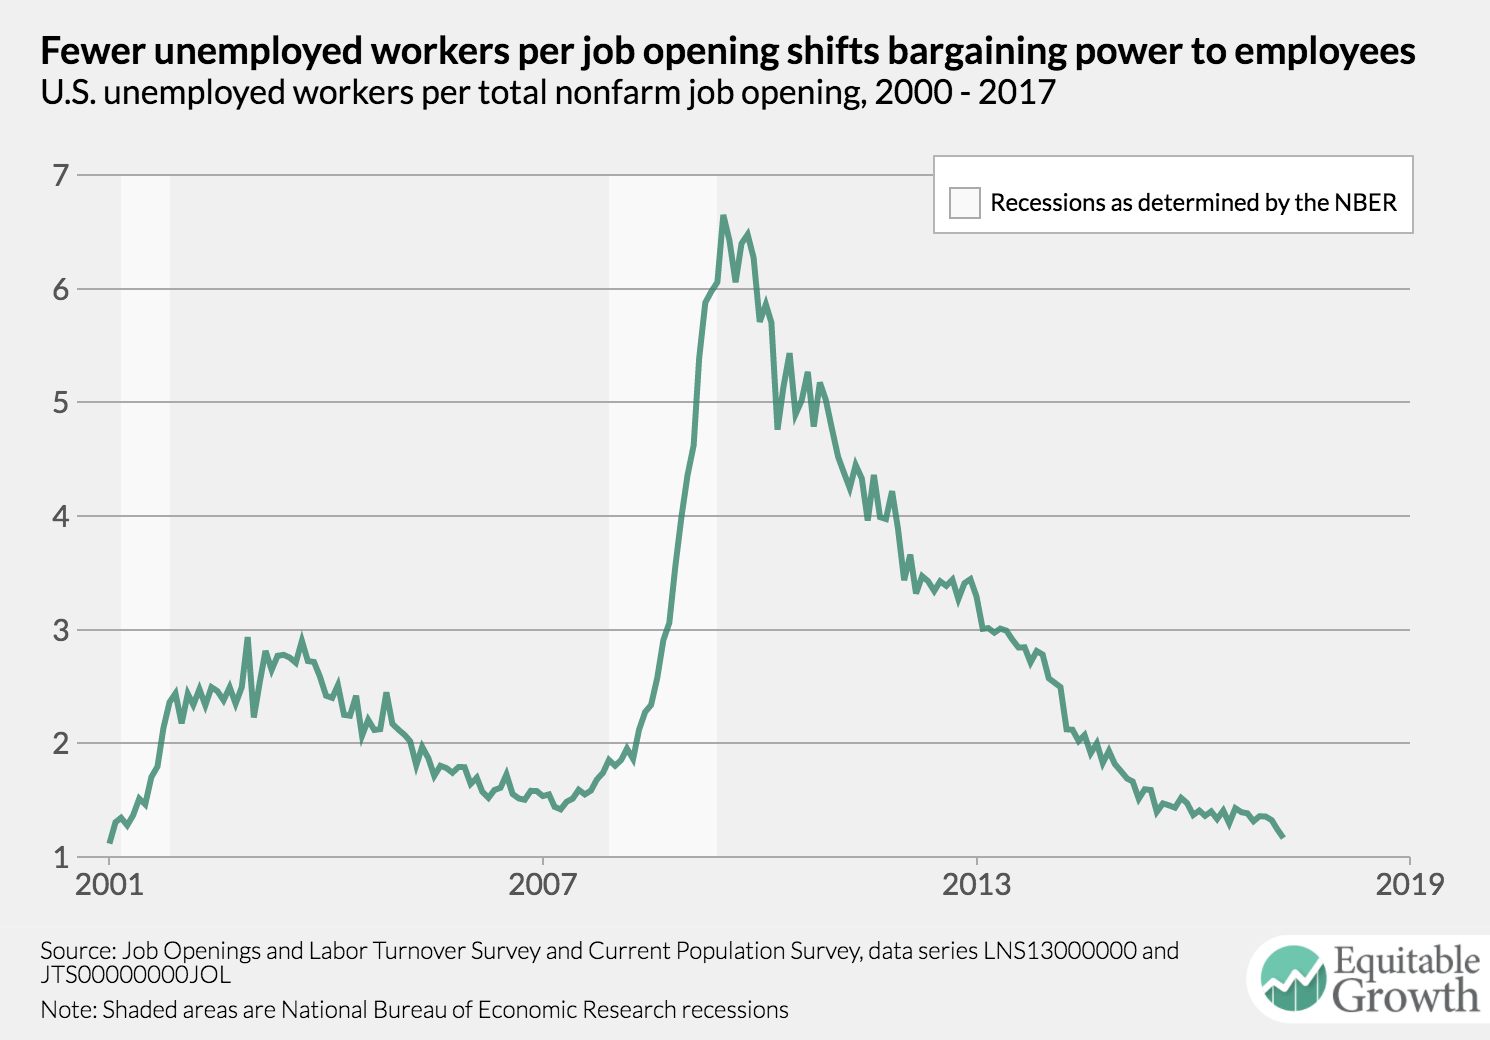
The number of unemployed workers per job opening declined in April to 1.17, the second lowest ratio on record.
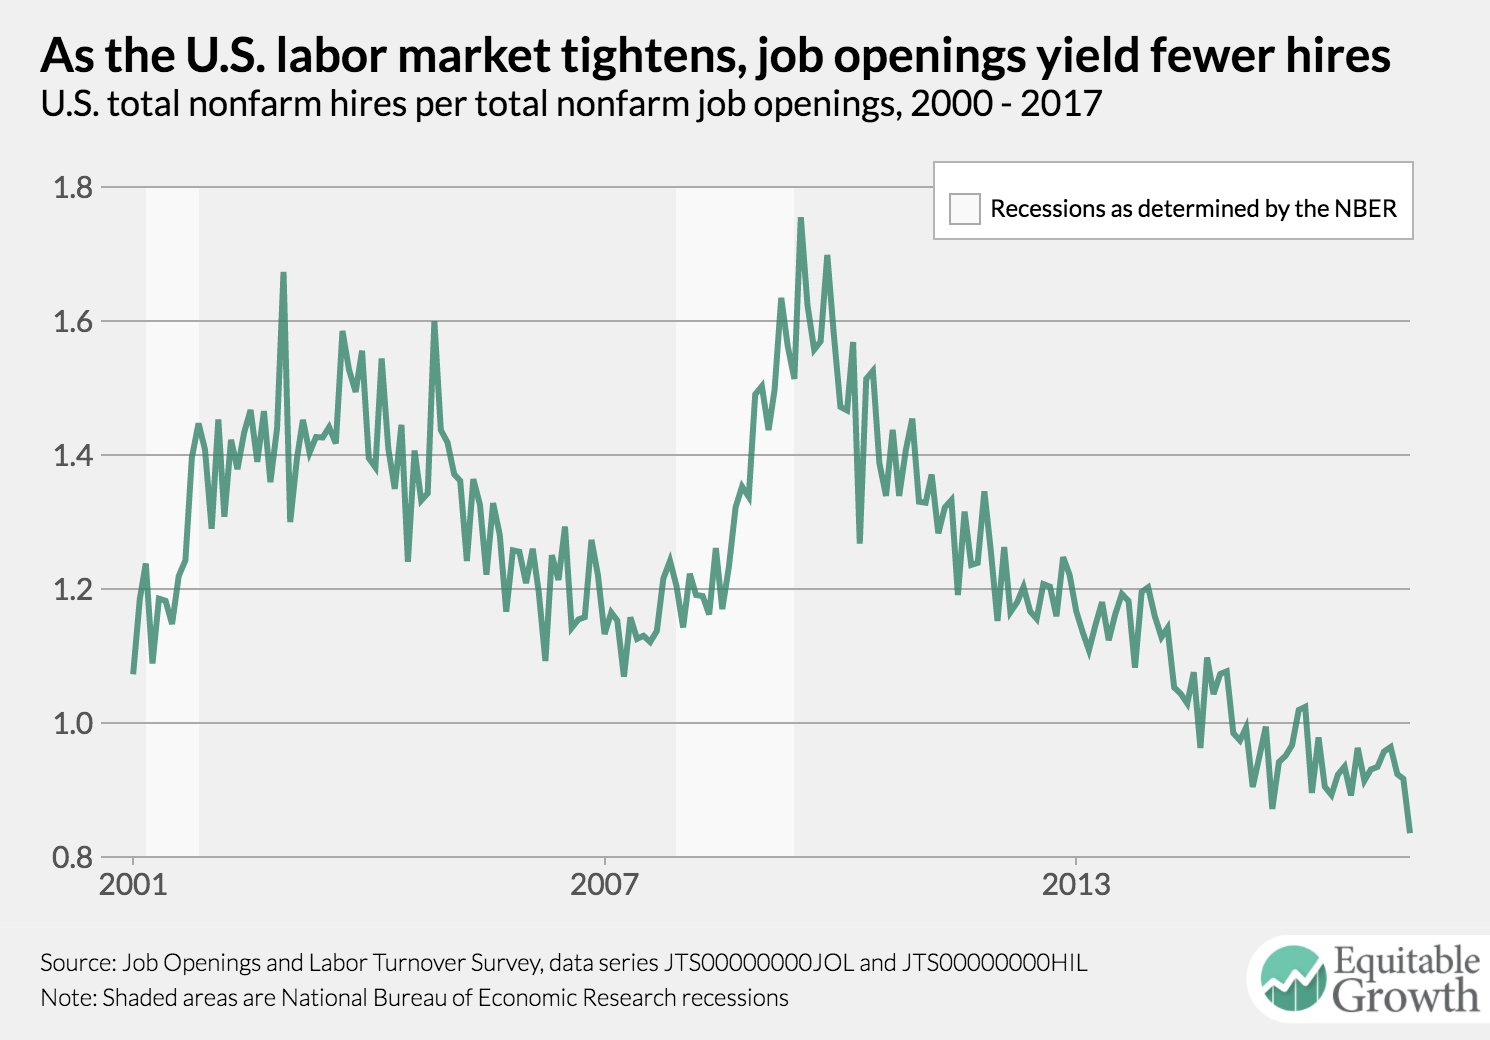
The vacancy yield, a measure of how readily a job opening turns into a hire, fell quite a bit to 0.84 in April from 0.92 in March.
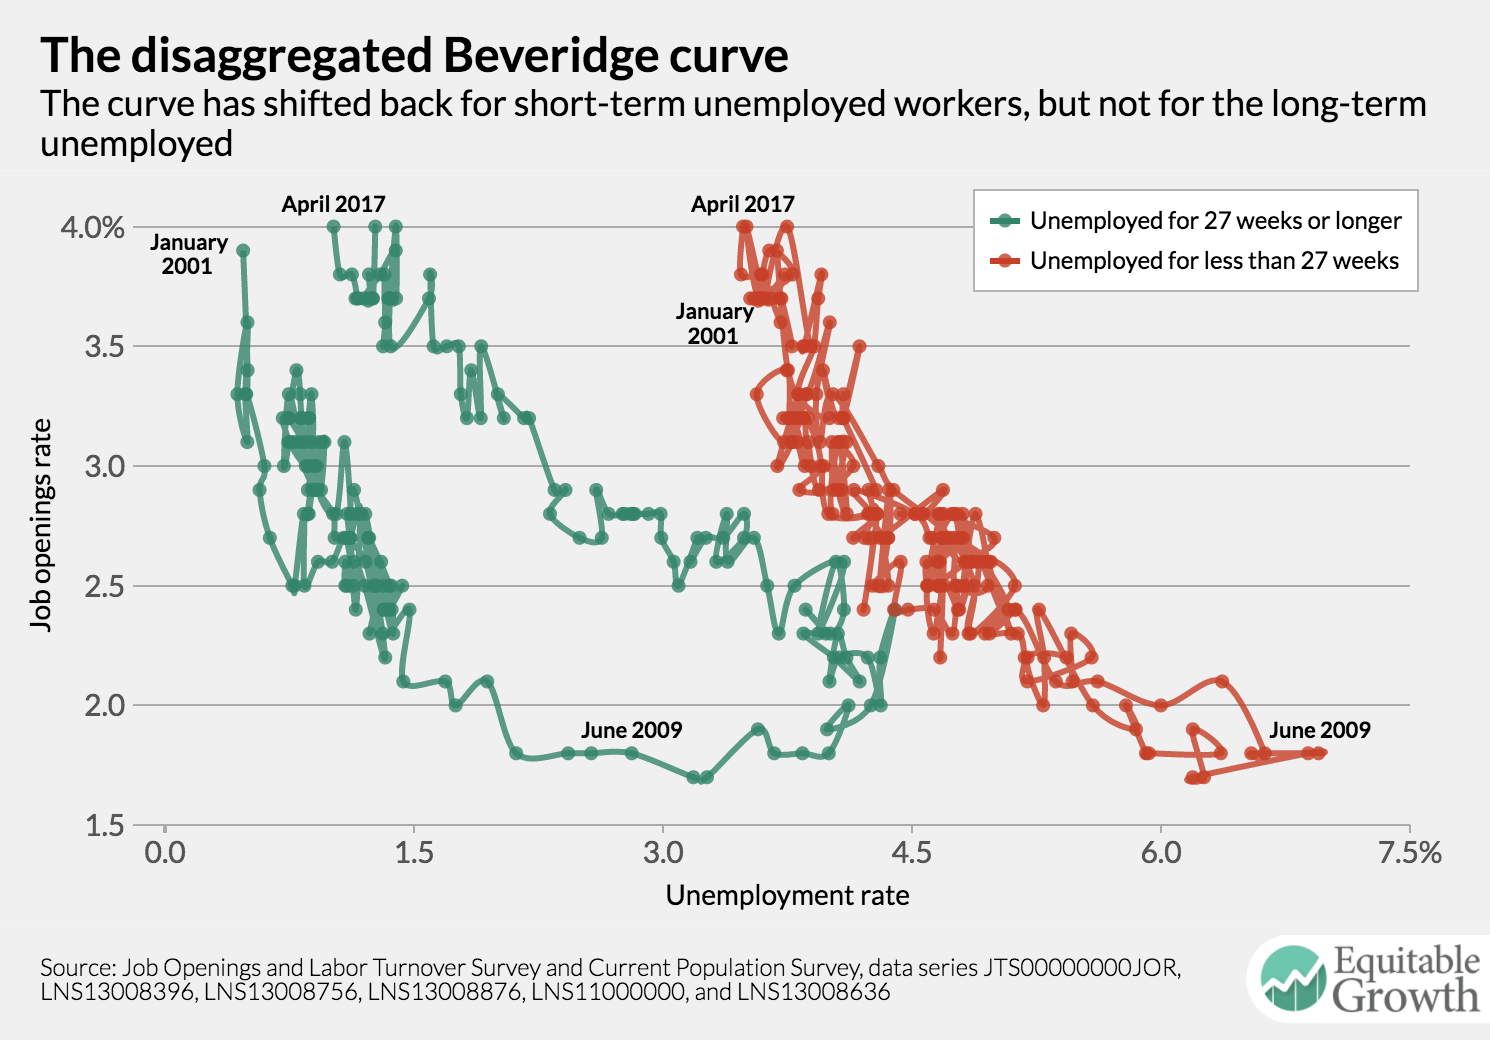
The relationship between job openings and the unemployment rate hasn’t returned to its pre-recession form, due to the shift in the relationship for long-term unemployed workers.