Equitable Growth’s Jobs Day Graphs: September 2020 Report Edition
On October 2nd, the U.S. Bureau of Labor Statistics released new data on the U.S. labor market during the month of September. Below are five graphs compiled by Equitable Growth staff highlighting important trends in the data.
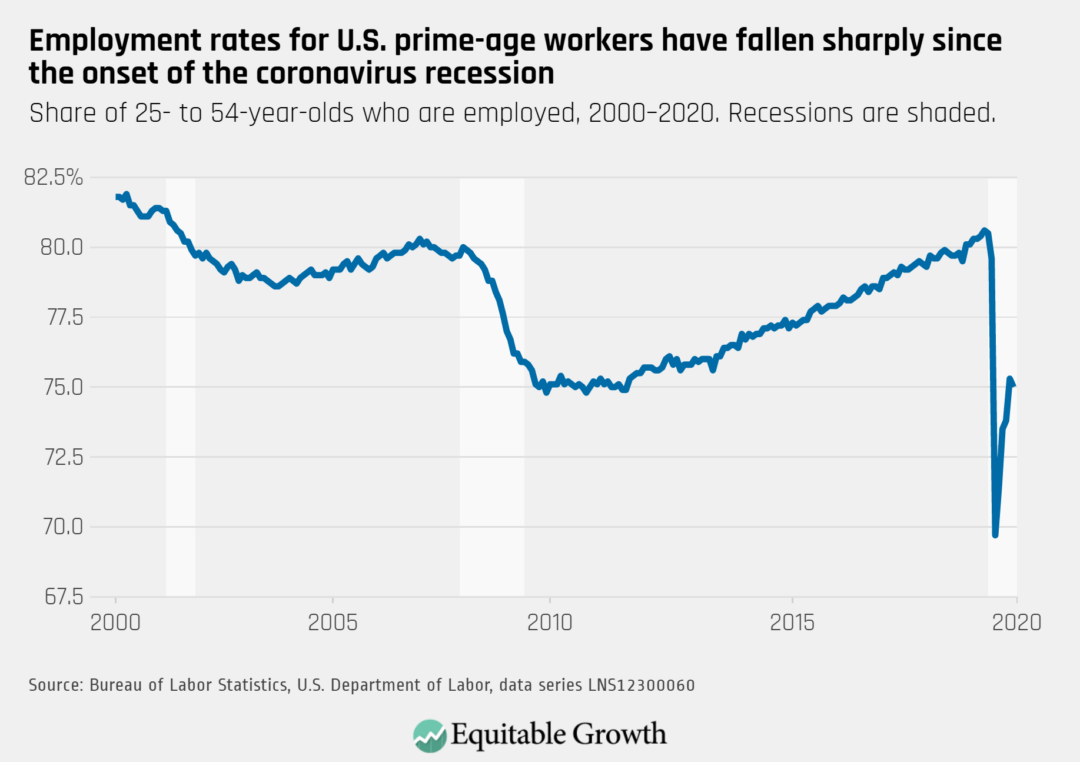
The employment-to-population ratio for people in their prime working years fell slightly from 75.3 percent to 75.0 percent in September, signaling a stalling recovery for the labor market.
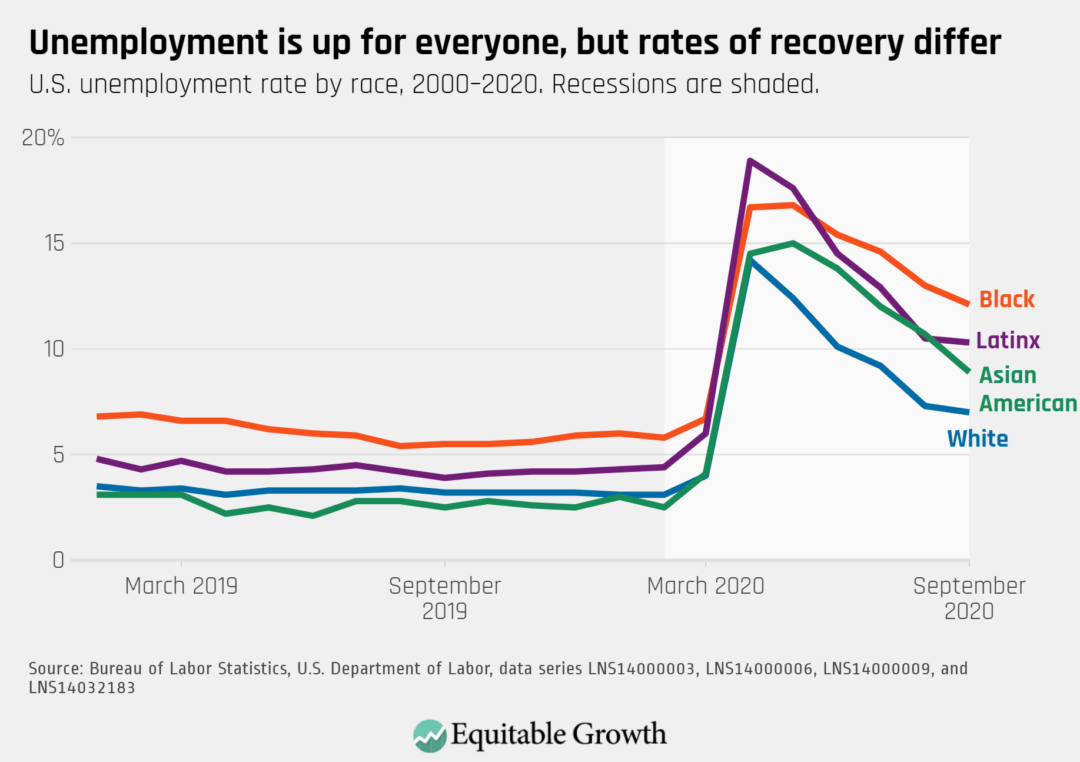
The unemployment rate for Black and Latinx workers remains in double digits at 12.1 percent and 10.3 percent, respectively, remaining significantly higher than White and Asian American workers. In May, Asian American workers saw an unprecedented increase in unemployment, which later fell but remains elevated above White workers.
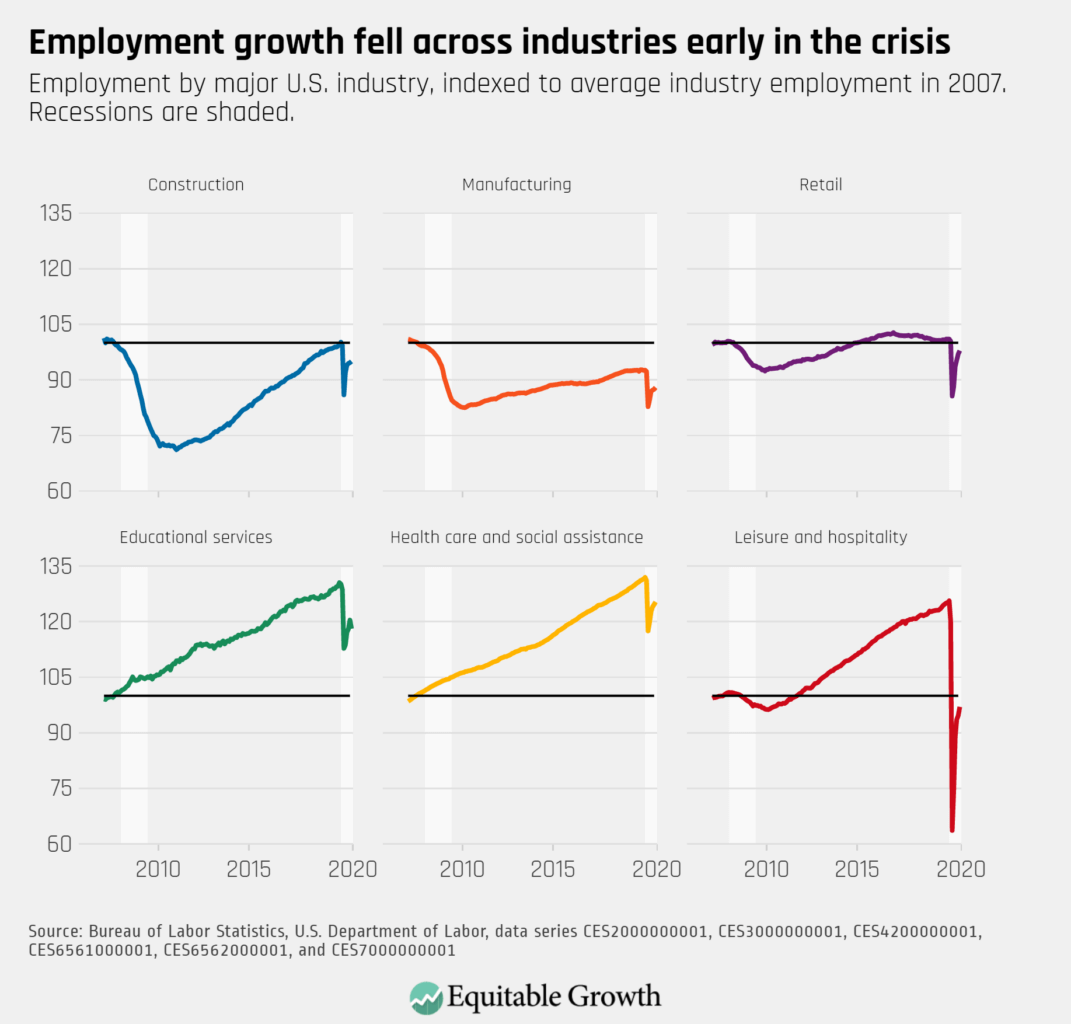
Employment growth slowed across all industries and fell in education services.
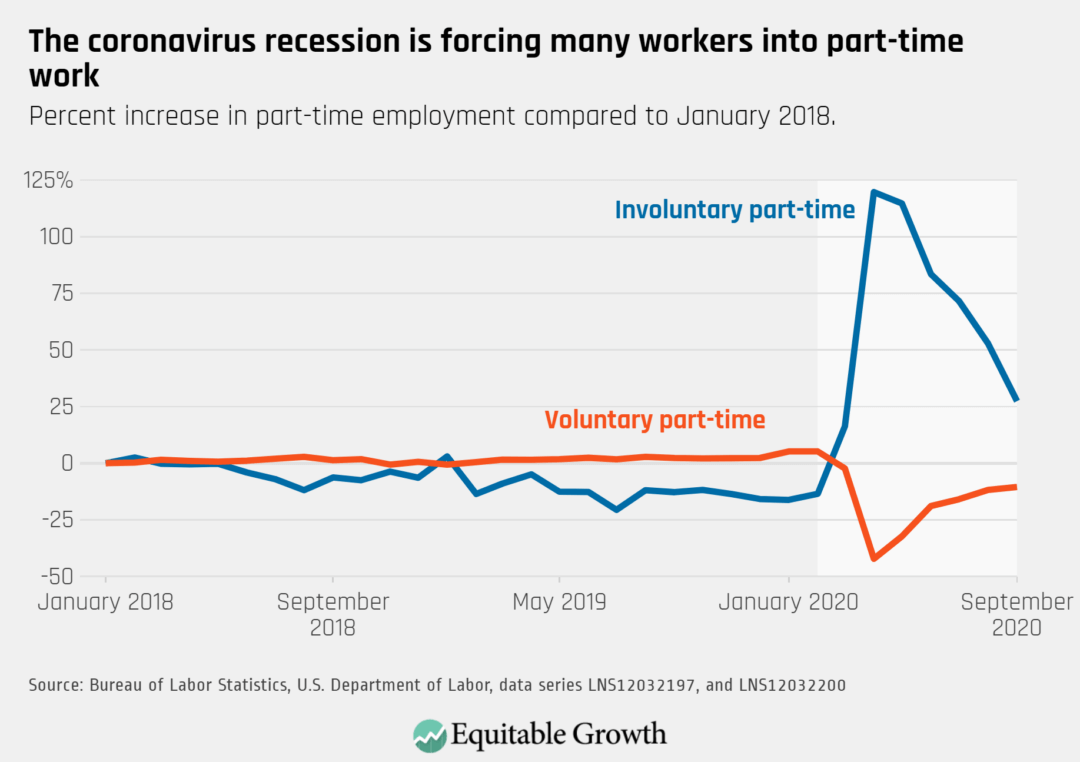
Involuntary part-time work fell by 1.3 million jobs, but still remains 2 million higher than in February before the crisis.
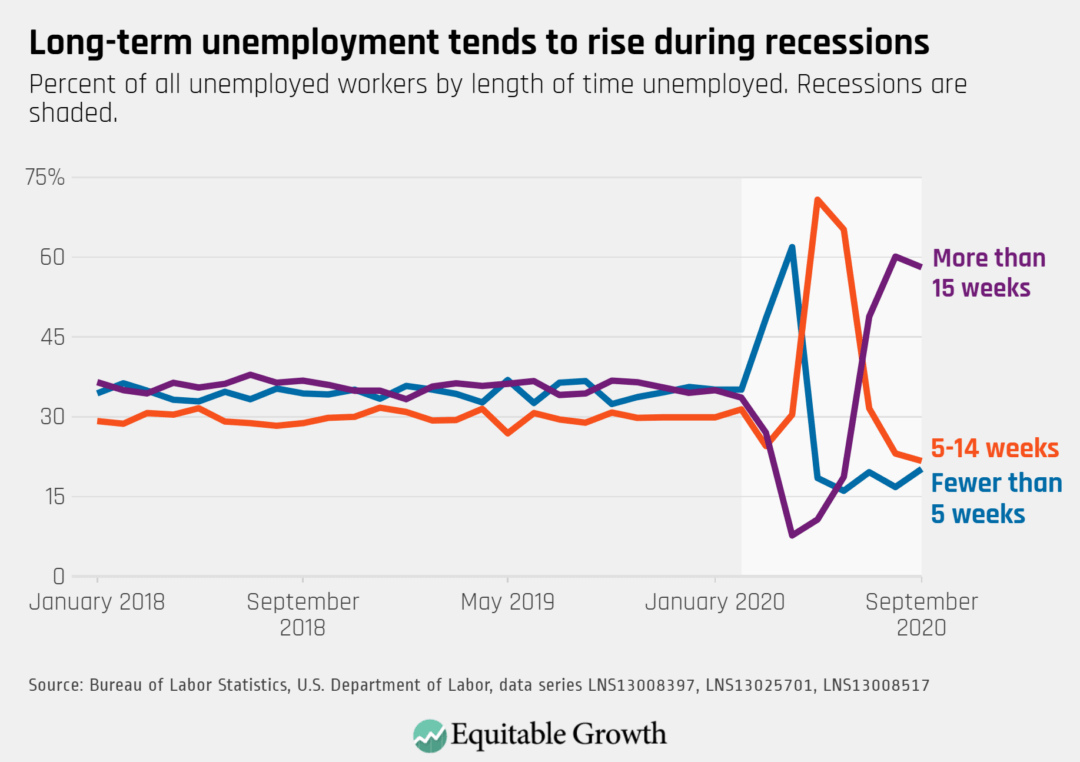
The proportion of those unemployed who have recently lost a job rose by 271,000 in September, reflecting new layoffs as the coronavirus recession continues.