Equitable Growth’s Jobs Day Graphs: November 2021 Report Edition
On December 3, the U.S. Bureau of Labor Statistics released new data on the U.S. labor market during the month of November. Below are five graphs compiled by Equitable Growth staff highlighting important trends in the data.
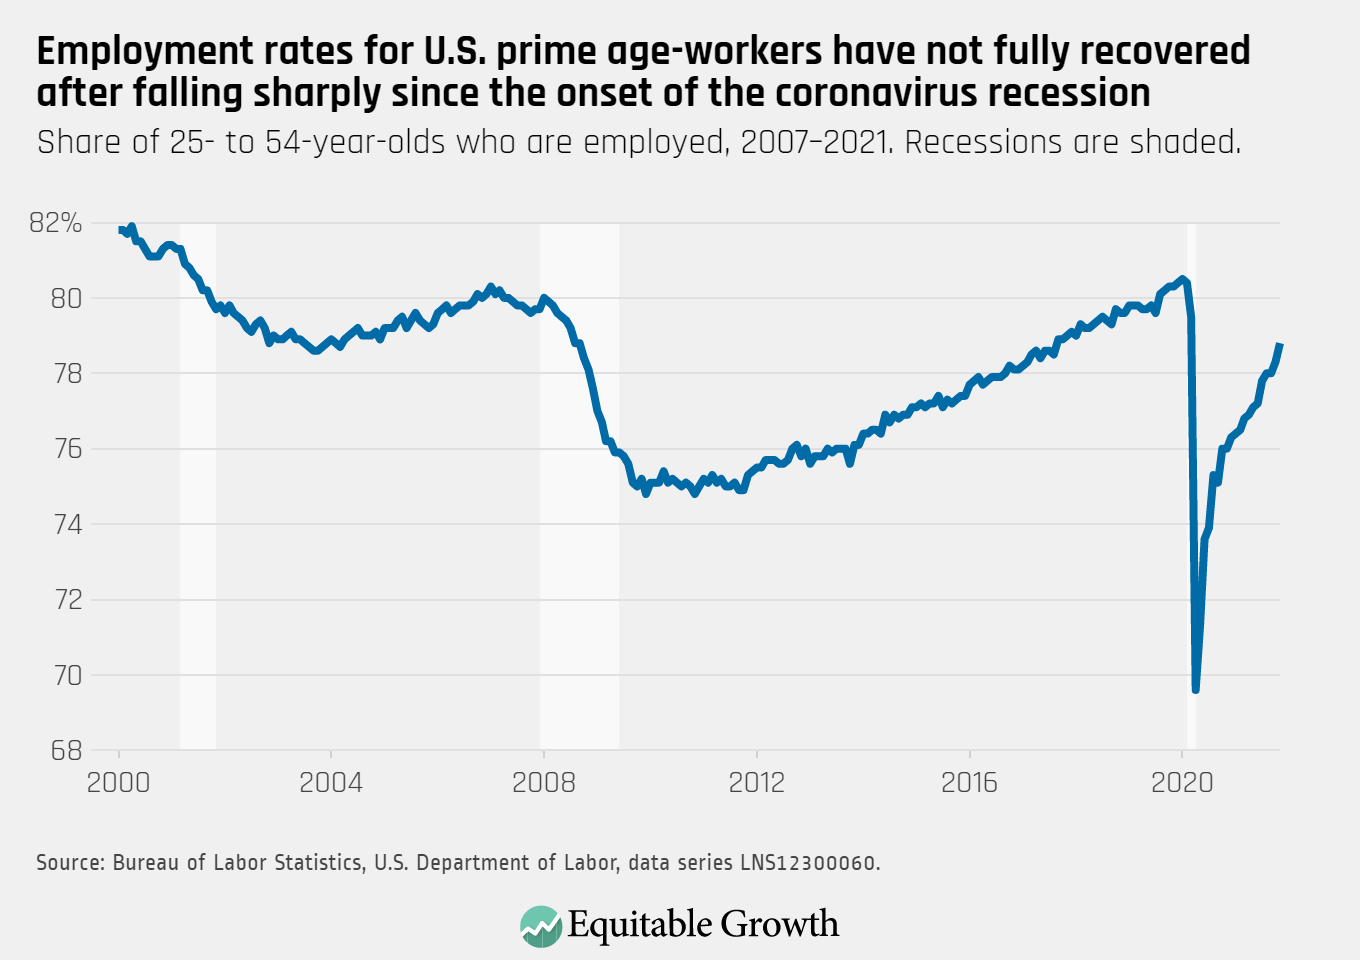
Total nonfarm employment increased by 210,000 in November, and the employment rate for prime-age workers rose to 78.8 percent.
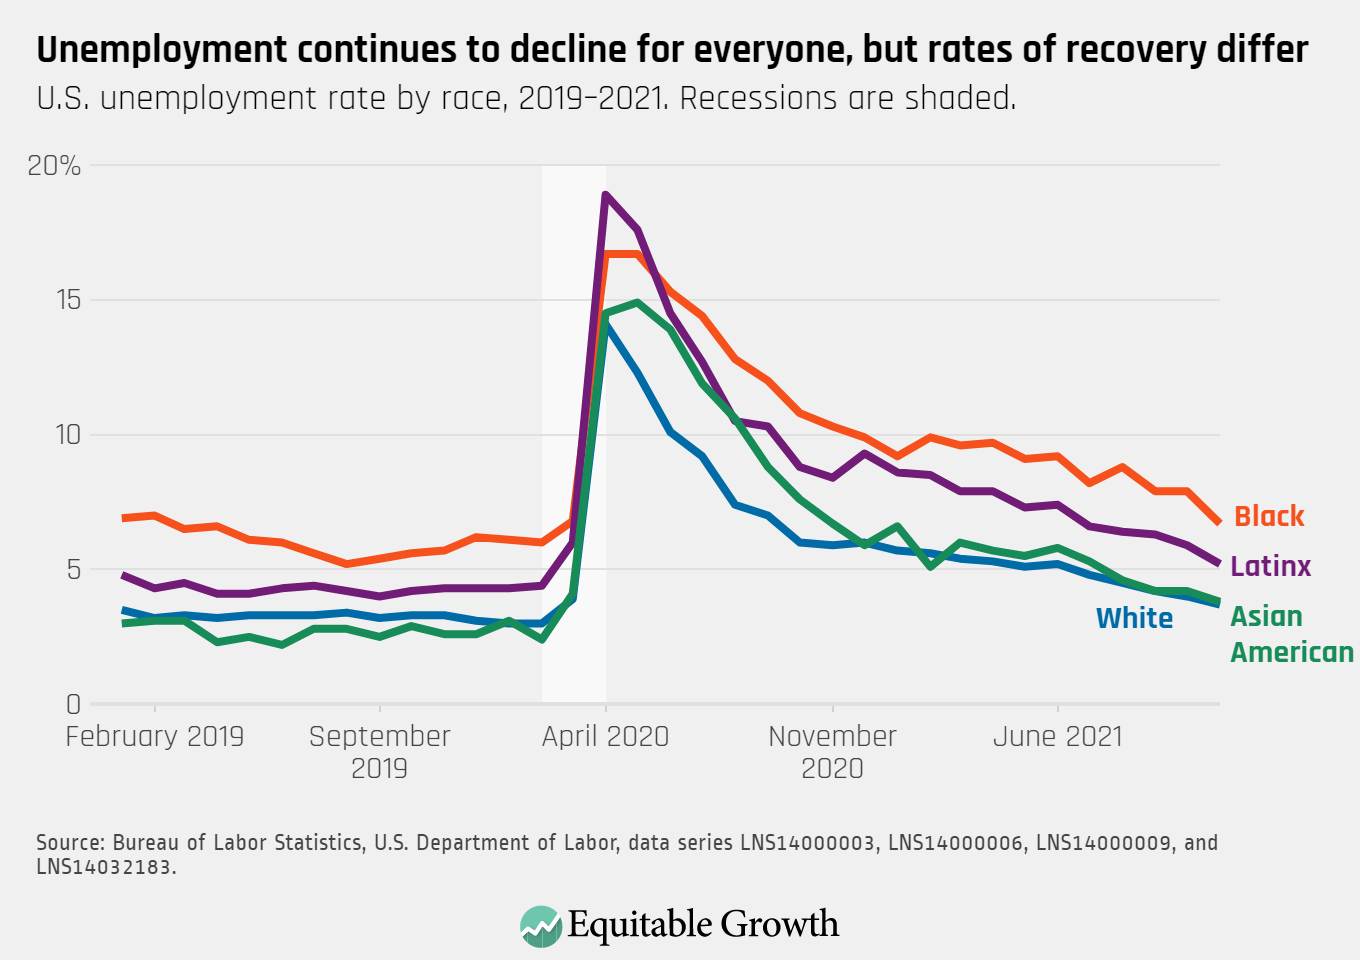
The unemployment rate declined to 4.2 percent in November, remaining higher for Black workers (6.7 percent) and Latinx workers (5.2 percent) compared to Asian American workers (3.8 percent) and White workers (3.7 percent).
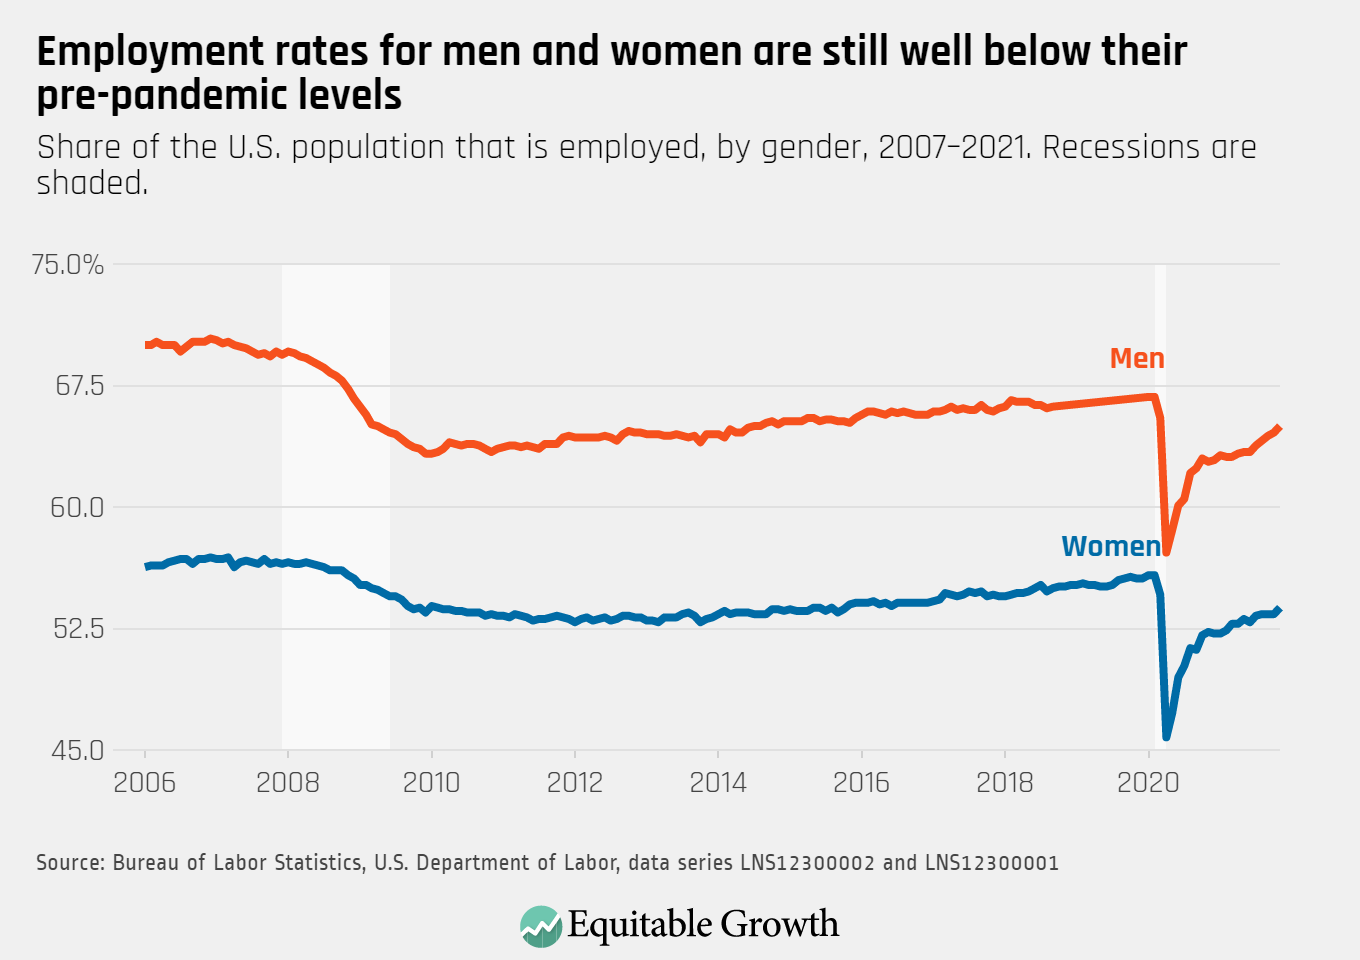
The overall employment rate rose to 65.0 percent for men and 53.8 percent for women, still below pre-pandemic levels for both groups.
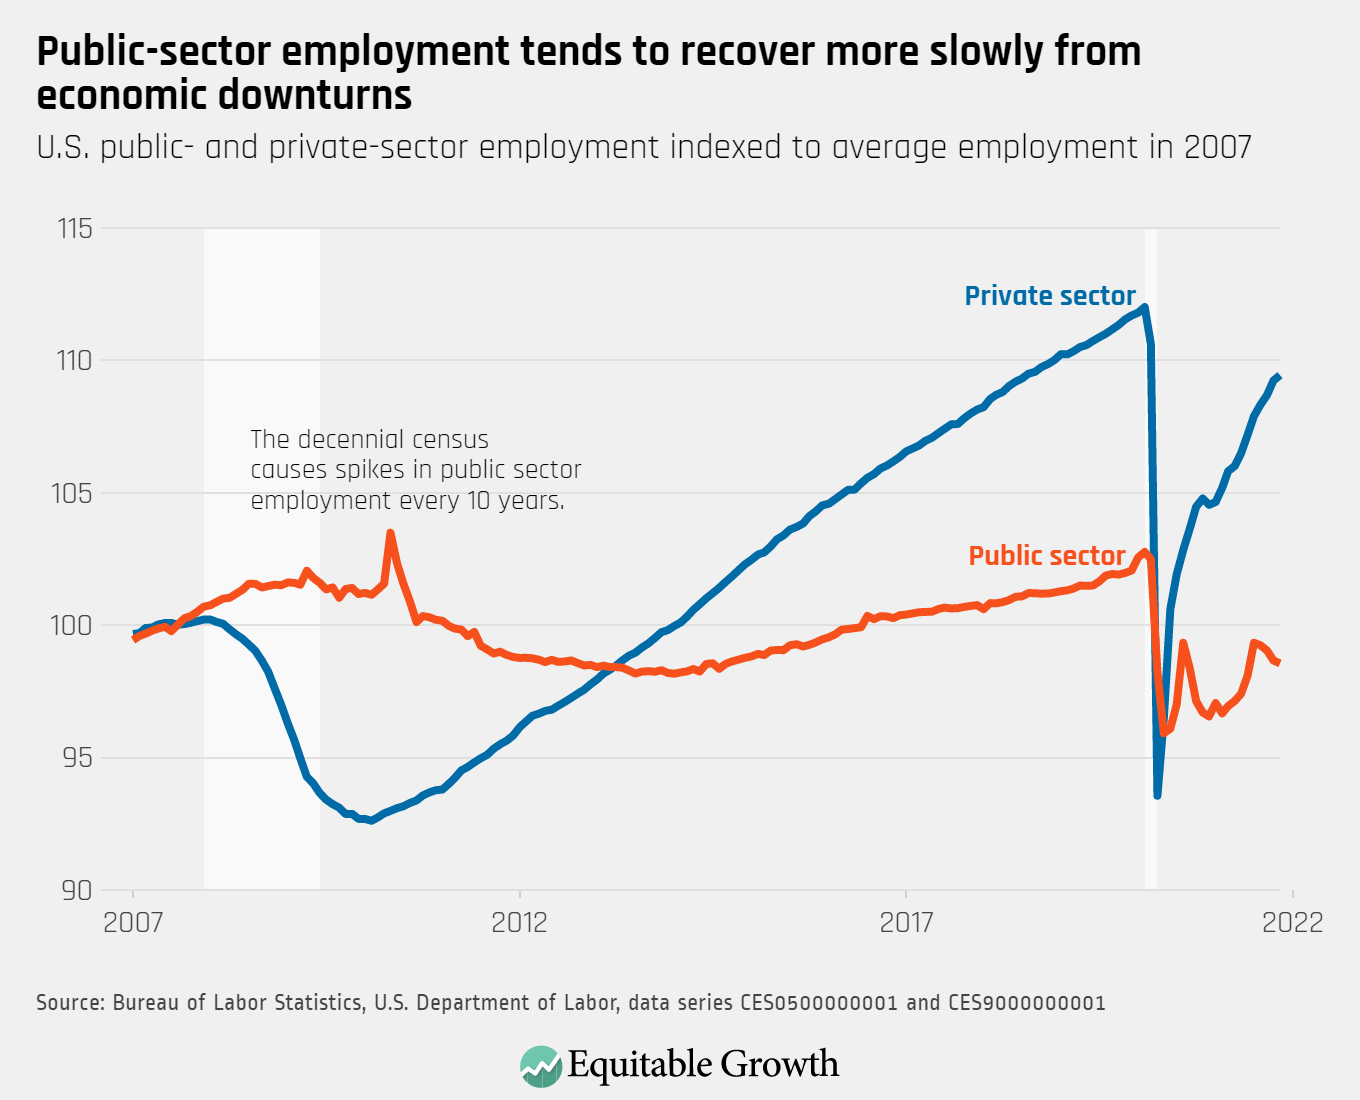
Private-sector employment continued to make gains in November, but public-sector employment gains have faltered
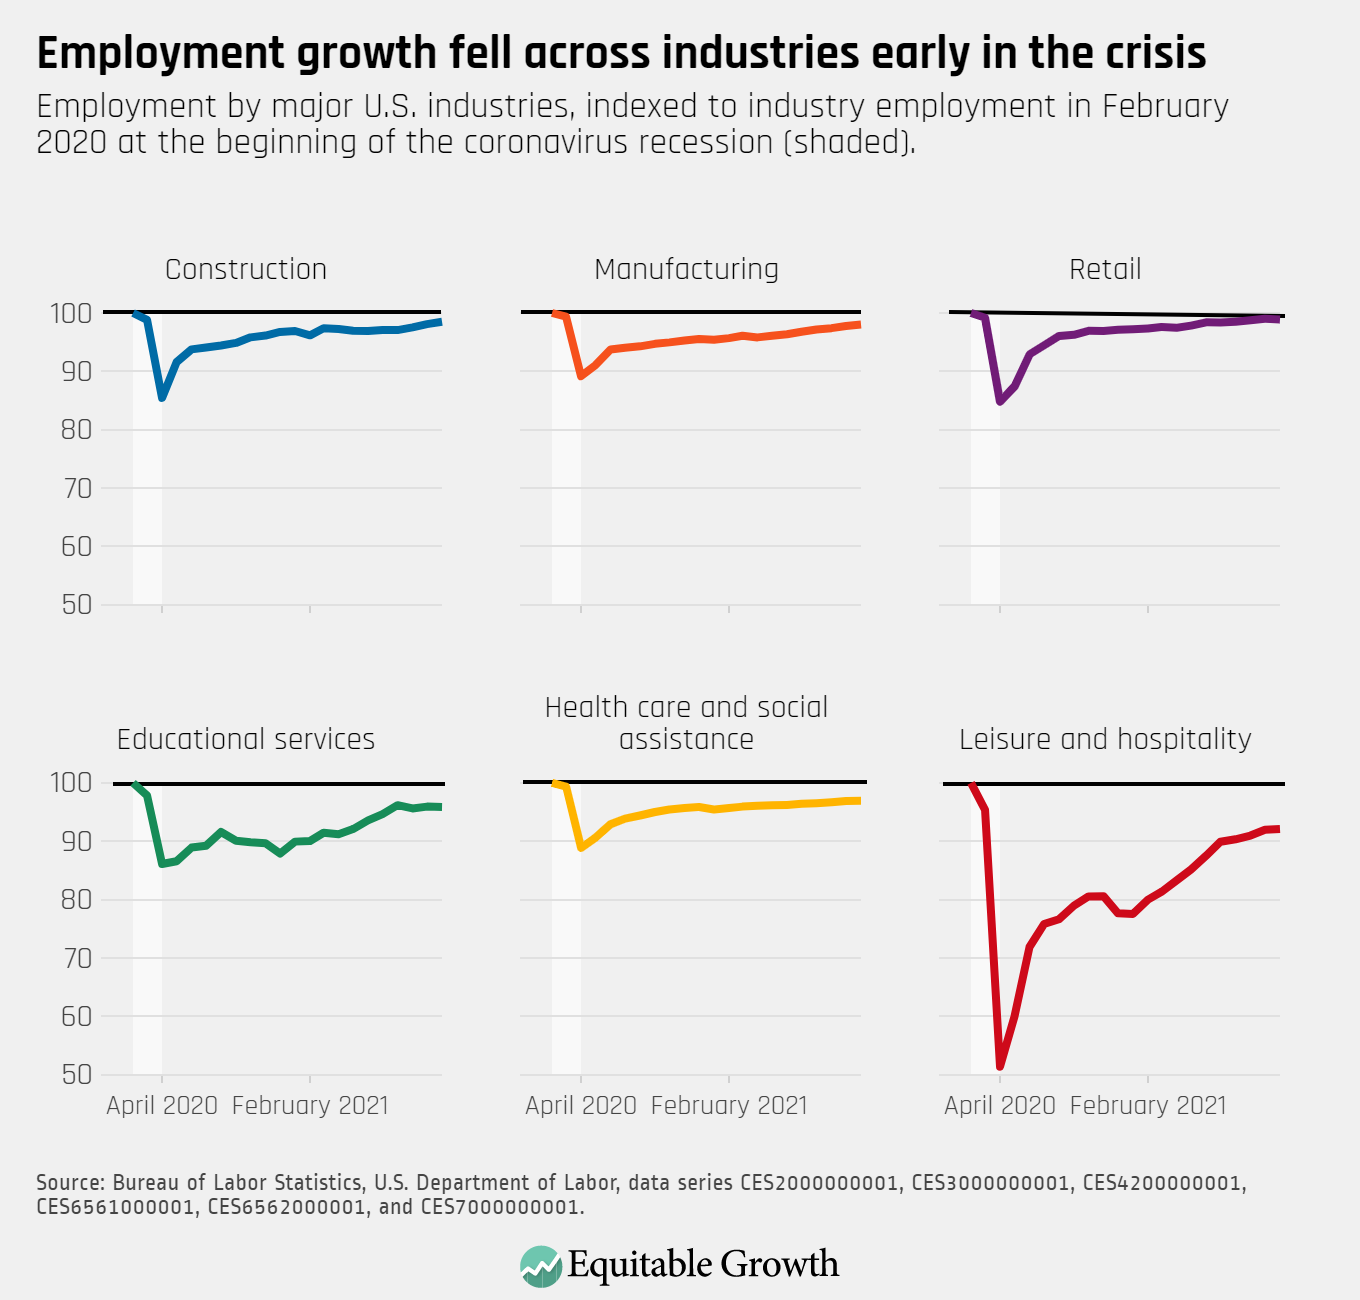
Despite recent gains, the jobs recovery remains fragile. Employment in many industries has increased more slowly than in recent months, and remains below pre-pandemic levels.