Equitable Growth’s Jobs Day Graphs: May 2022 Report Edition
On June 3, the U.S. Bureau of Labor Statistics released new data on the U.S. labor market during the month of May. Below are five graphs compiled by Equitable Growth staff highlighting important trends in the data.
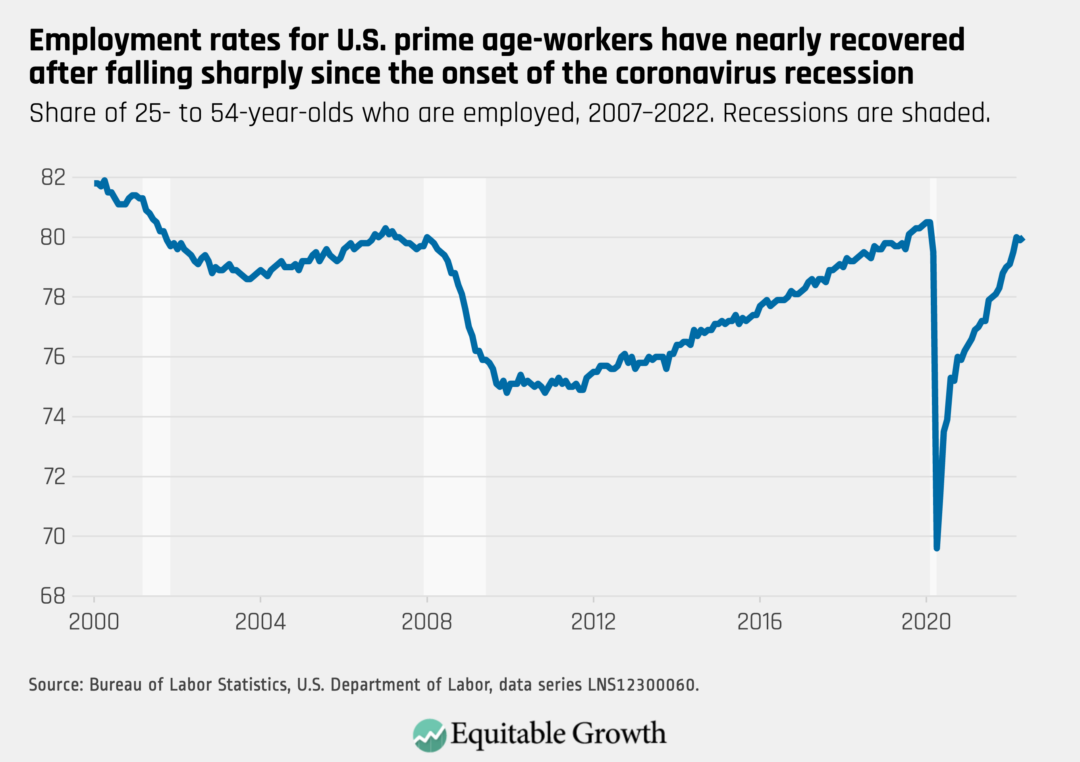
Total U.S. nonfarm employment rose by 390,000 in May, and the employment rate for prime-age workers increased slightly to 80.0 percent.
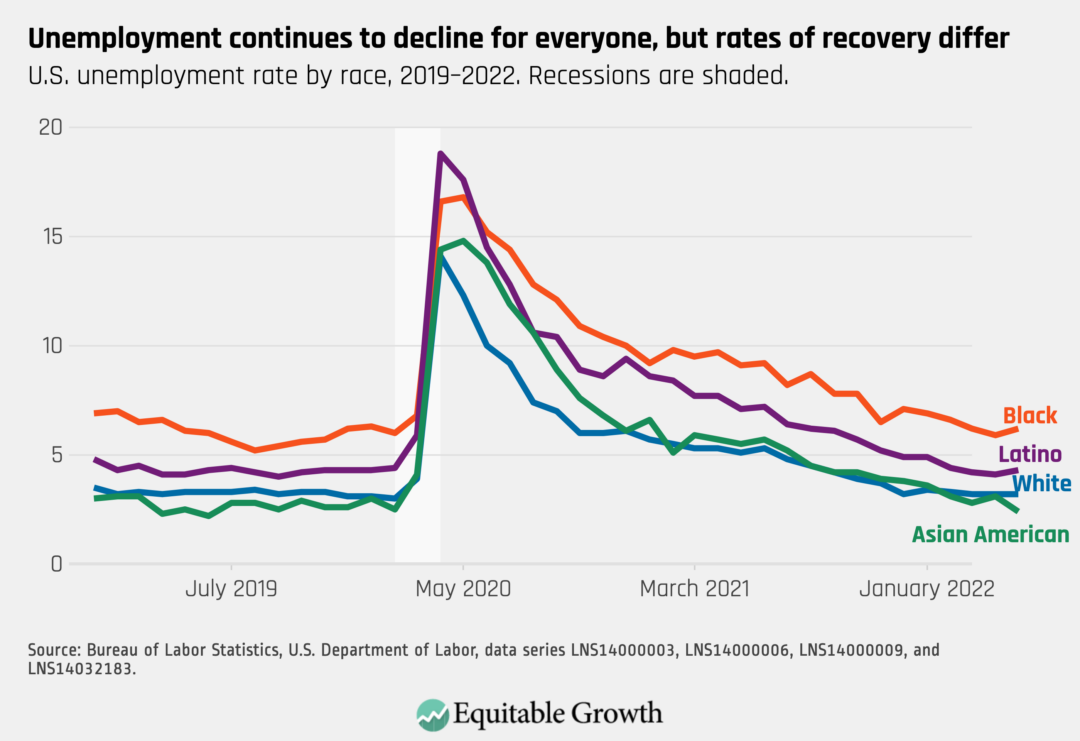
The unemployment rate remained at 3.6 percent again in May, still elevated for Black workers (6.2 percent) and Latino workers (4.3 percent) compared to White workers (3.2 percent) and Asian American workers (2.4 percent).
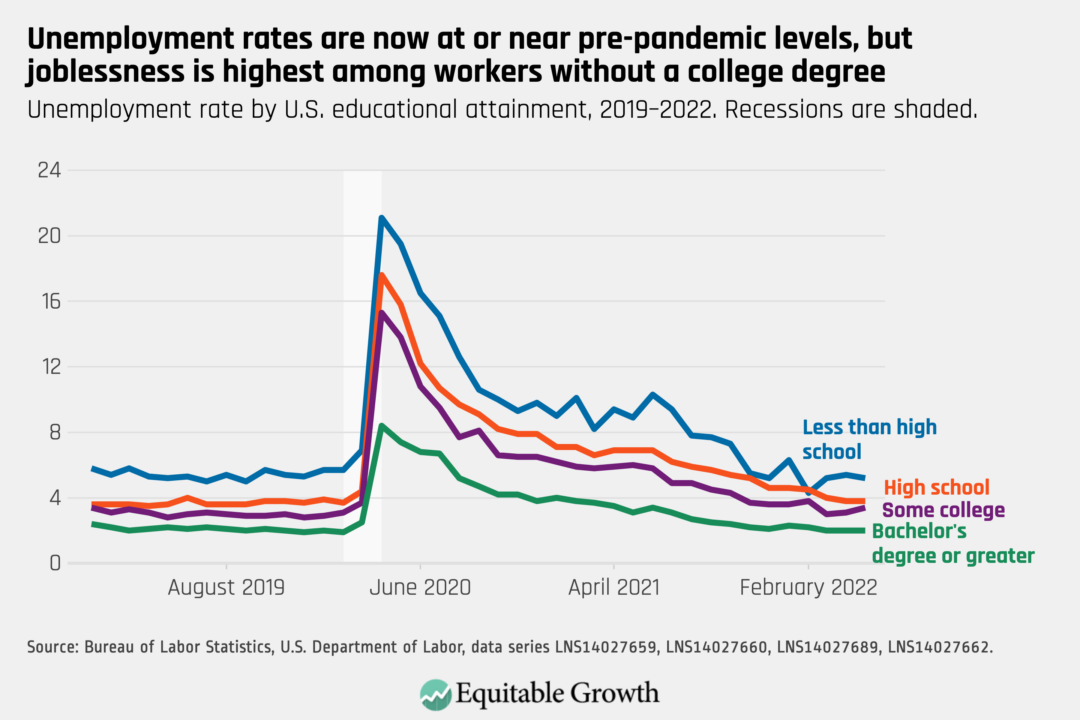
Unemployment rates are now 5.2 percent for workers with less than a high school degree and 3.8 percent for high school graduates. The unemployment rate is 3.4 percent for workers with some college, and 2.0 percent for college graduates.
Employment in many major industries is now back to or surpassing pre-pandemic levels, including construction, retail, and educational services. Employment in leisure and hospitality, however, has yet to recover.
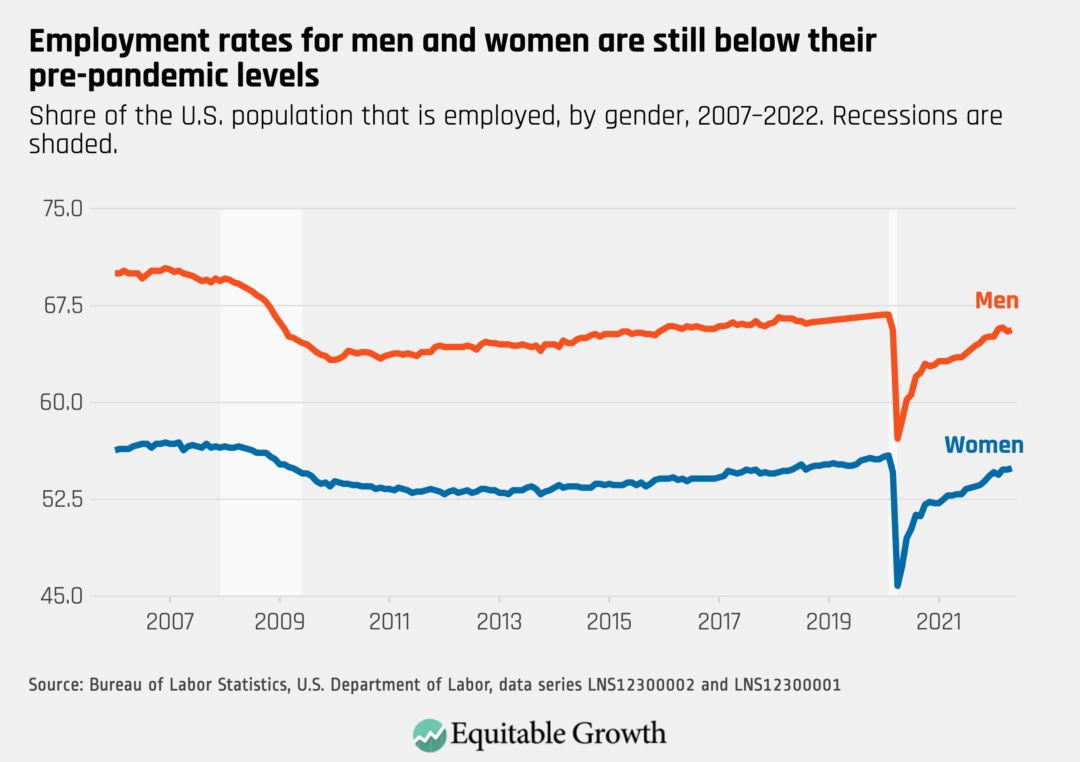
The employment rate increased slightly in May to 65.6 percent for men and 54.9 percent for women, remaining below pre-pandemic levels for both groups.