Equitable Growth’s Jobs Day Graphs: February 2017 Report Edition
Earlier this morning, The U.S. Bureau of Labor Statistics released new data on the U.S. labor market during the month of February. Below are five graphs compiled by Equitable Growth staff highlighting important trends in the data.
1.
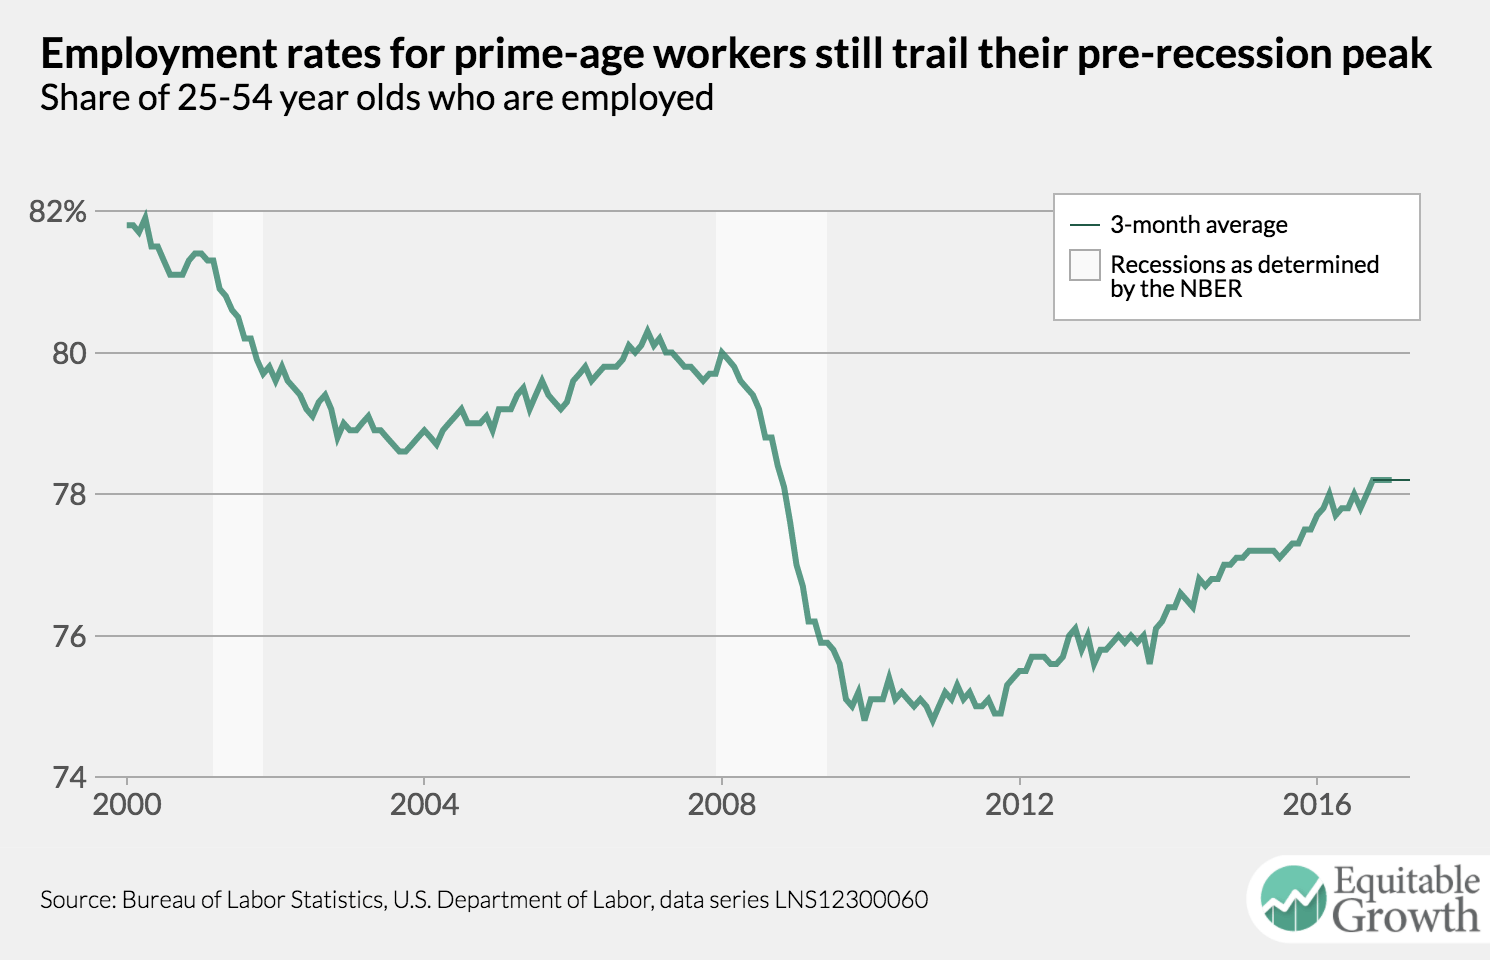
The share of workers in their prime working years with a job hit a new high for this recovery. But that peak is still well below the peaks in 2007 and 2001.
a
2.
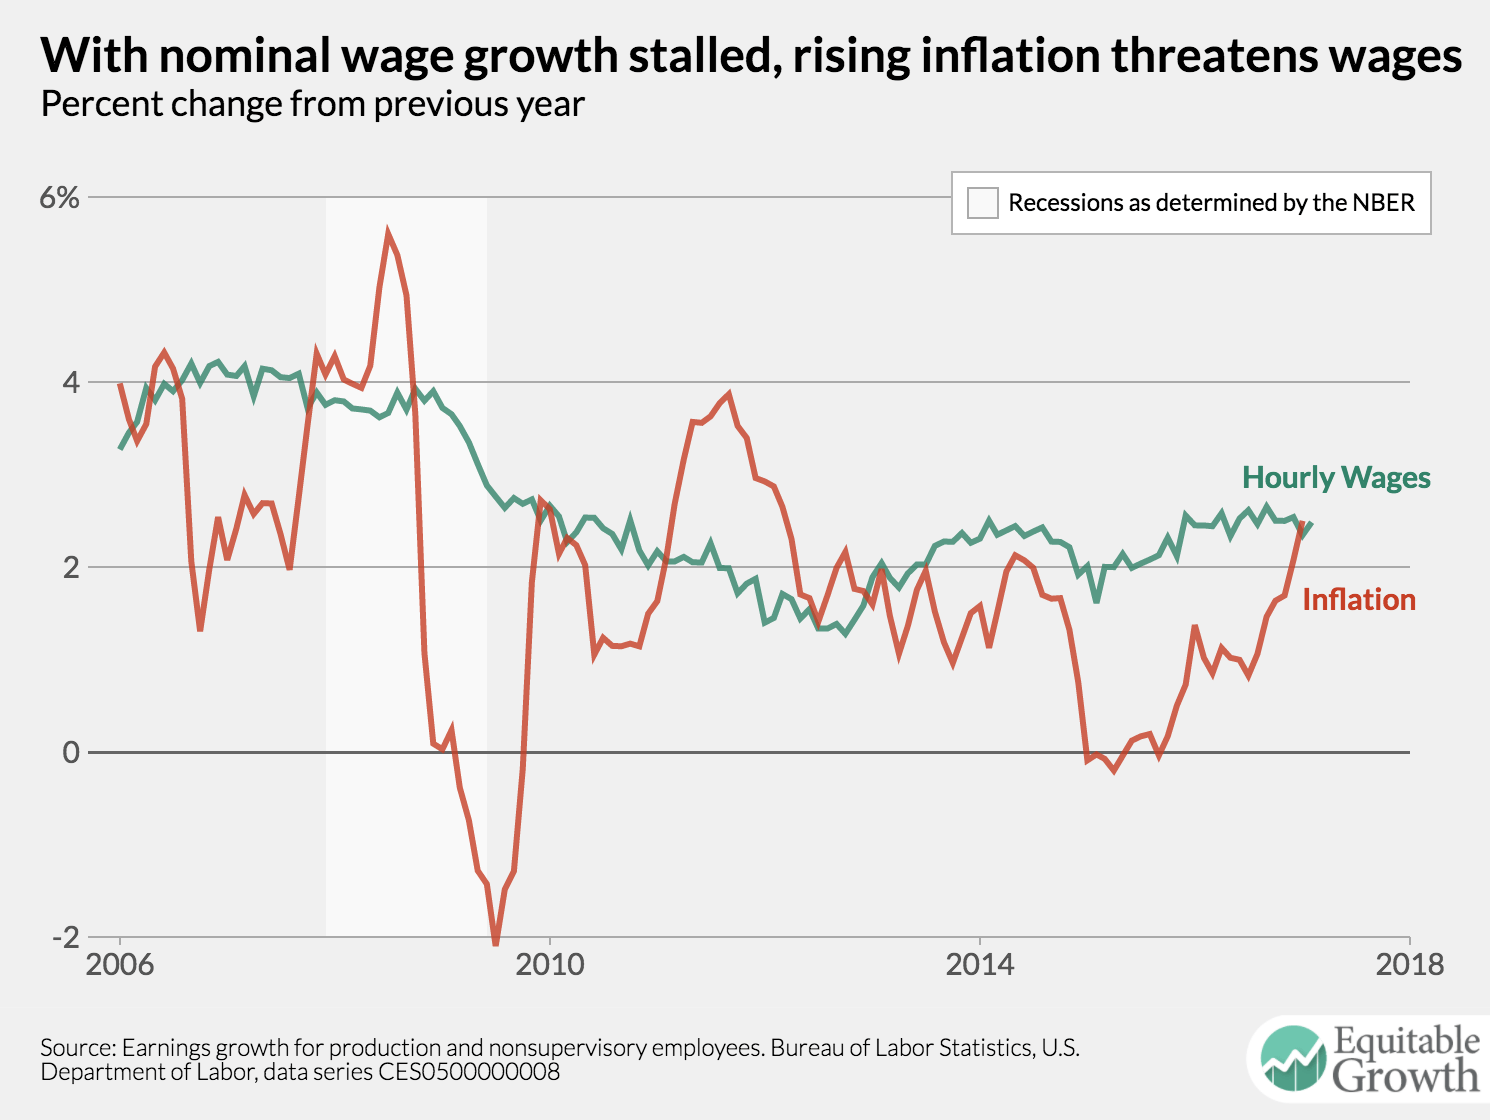
Nominal wage growth is increasing for all workers but seems stalled for lower-paid workers. With higher inflation in recent months, this means minimal real wage growth for this group.
a
3.
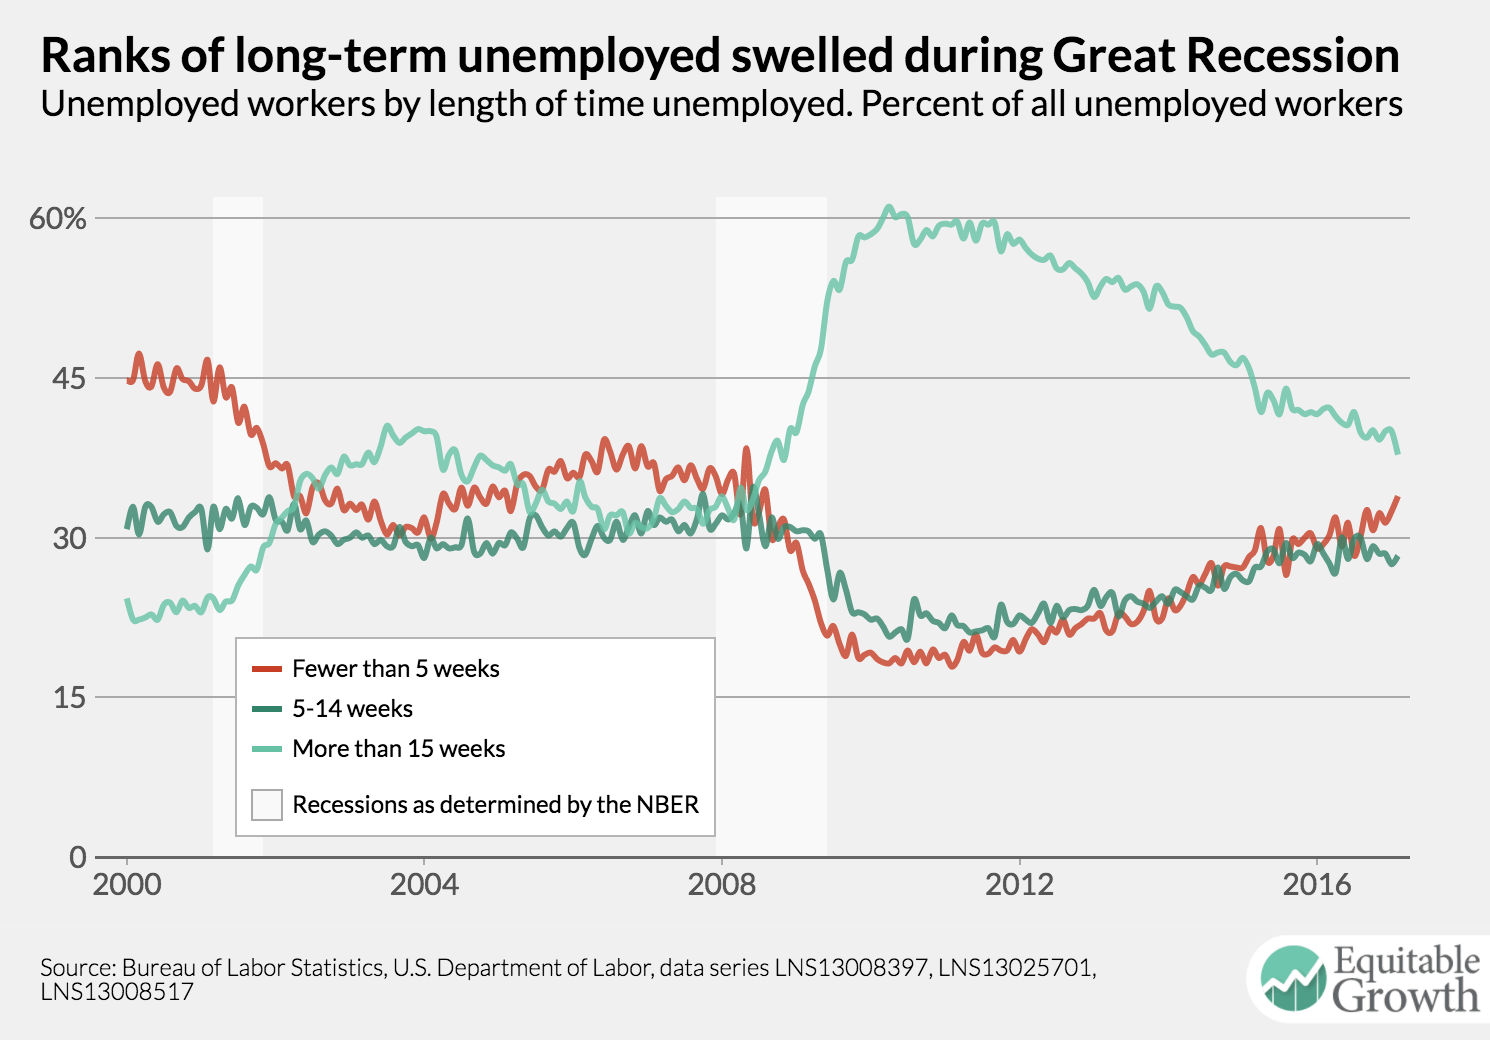
While long-term unemployment remains elevated, it is a declining share of unemployment as short-term unemployment increases its share.
a
4.
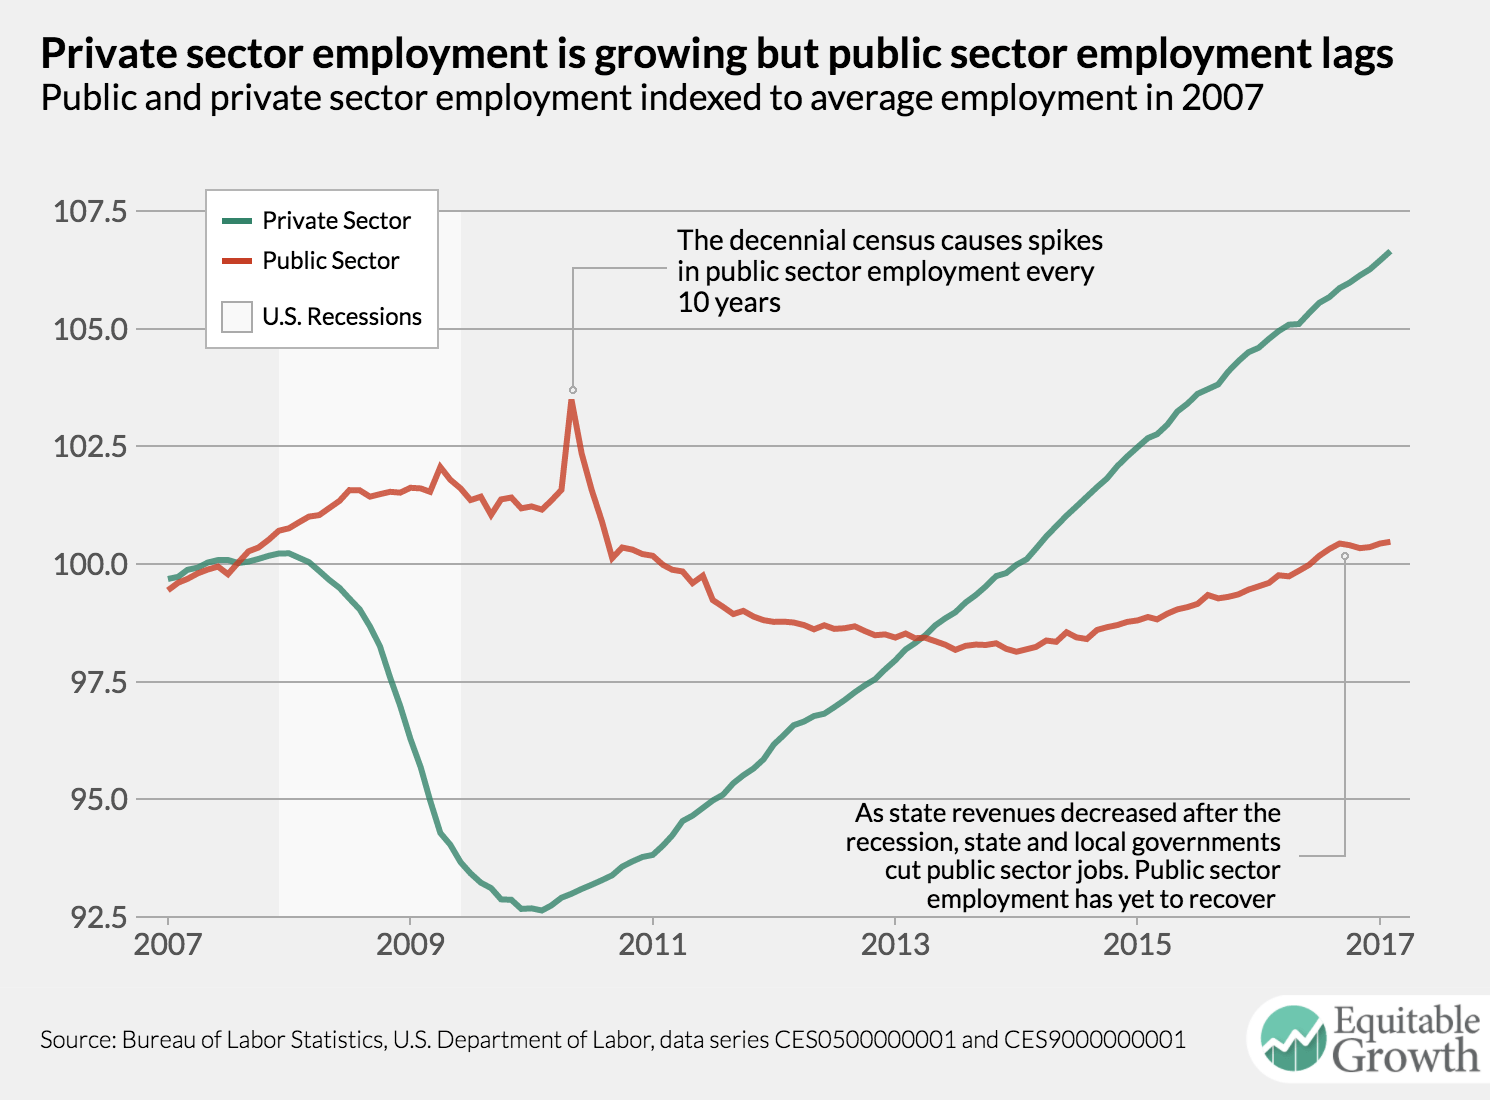
The private sector continues to lead the recovery as the government sector pulled back on jobs and hasn’t caught up.
a
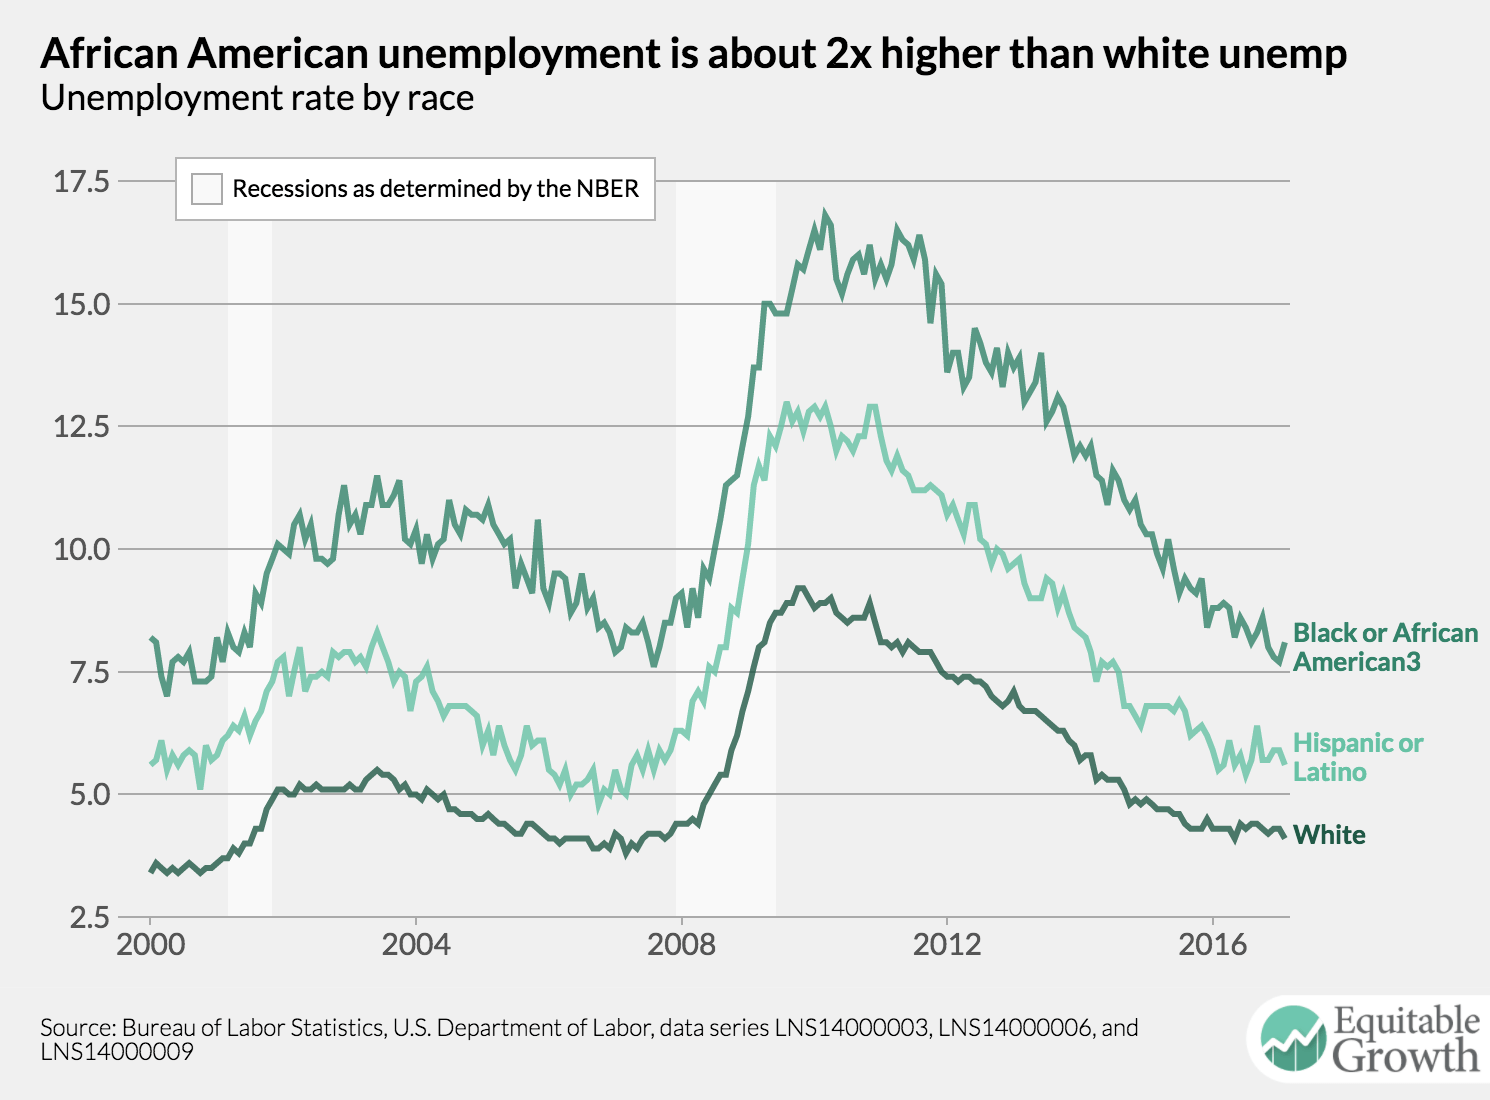
5.
The unemployment rate for all workers is well below 5 percent, but when we argue about full employment, we have to ask, “who is at full employment?” as well.
a