Equitable Growth’s Jobs Day Graphs: December 2021 Report Edition
On January 7, the U.S. Bureau of Labor Statistics released new data on the U.S. labor market during the month of December. Below are five graphs compiled by Equitable Growth staff highlighting important trends in the data.
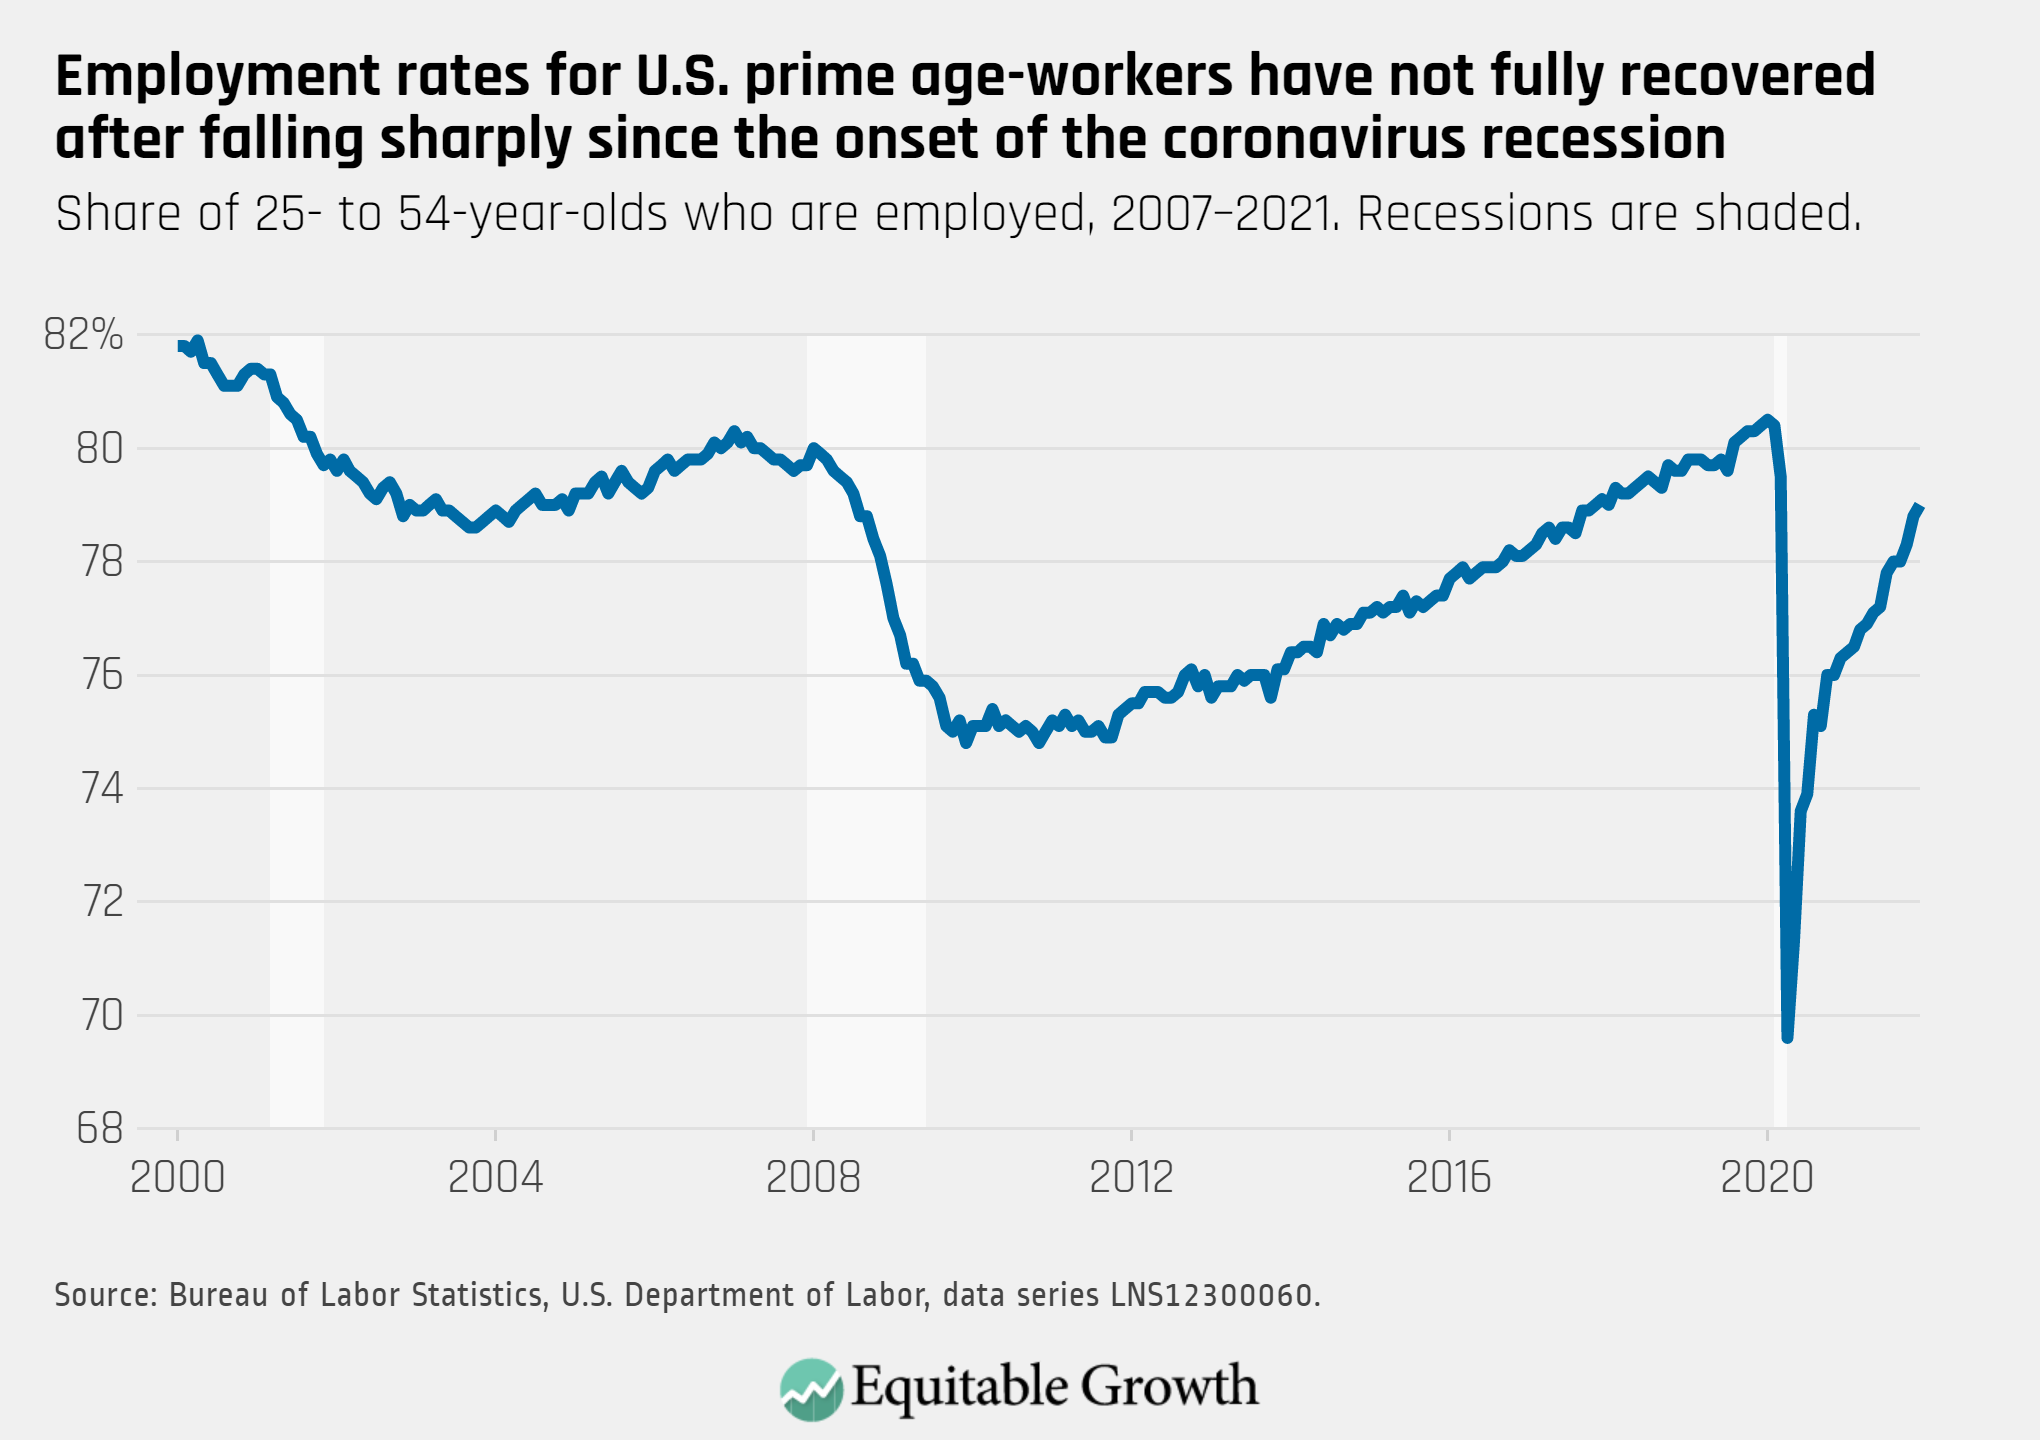
Total nonfarm employment increased by 199,000 in December, as the employment rate for prime-age workers rose from 78.8 percent to 79.0 percent.
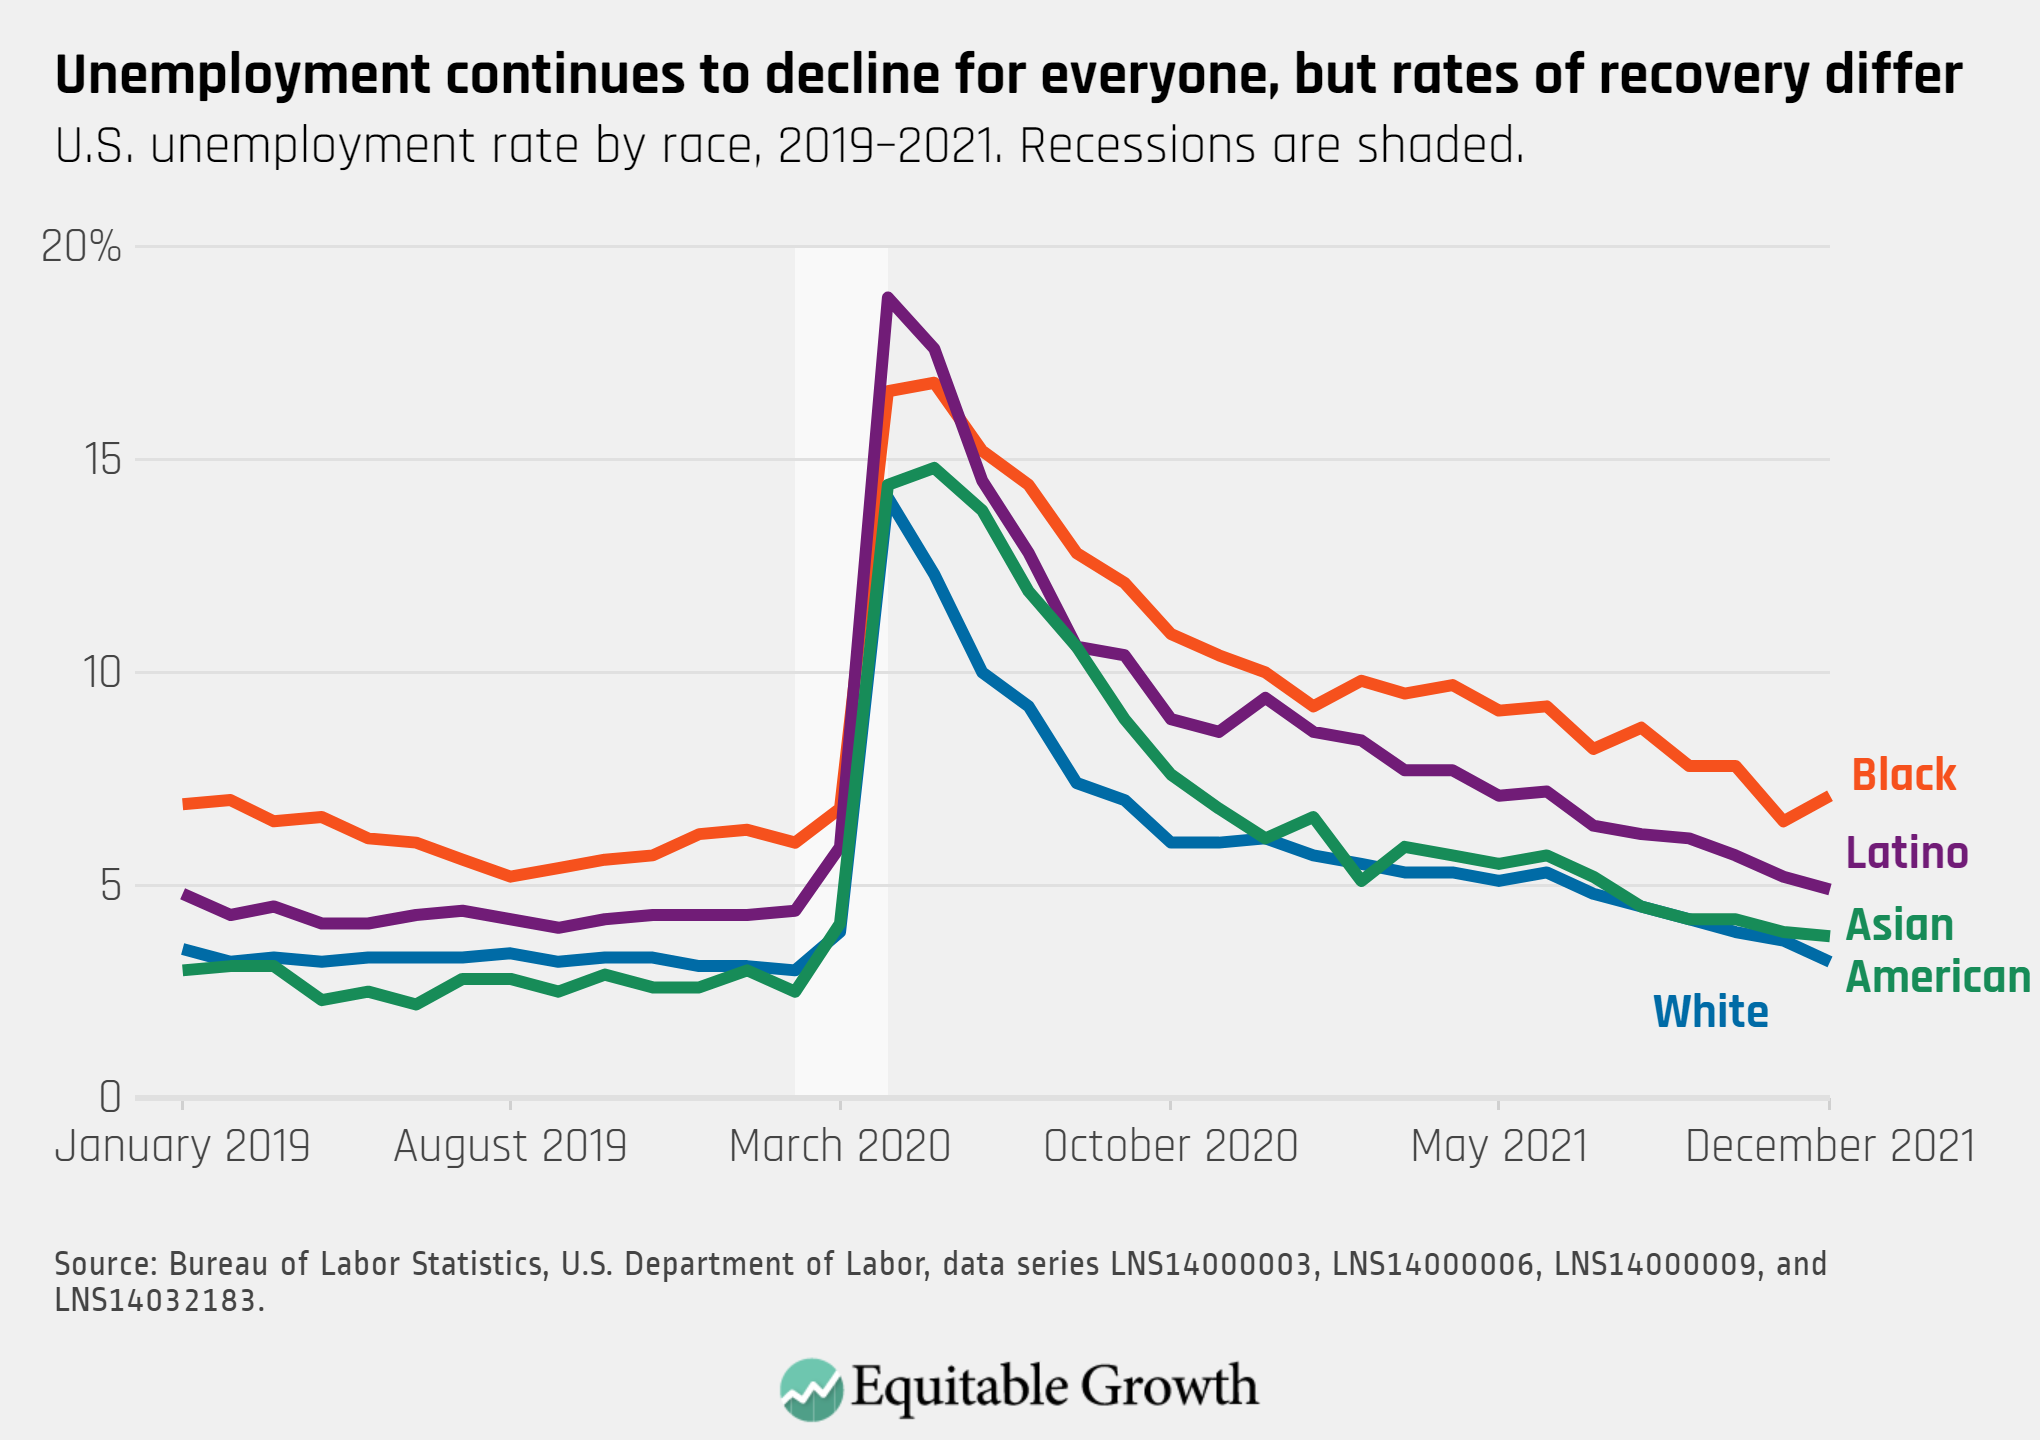
The unemployment rate for Black workers rose to 7.1 percent in December. The overall unemployment rate declined to 3.9 percent, and fell or remained steady for Latino workers (4.9 percent), Asian American workers (3.8 percent), and White workers (3.2 percent).
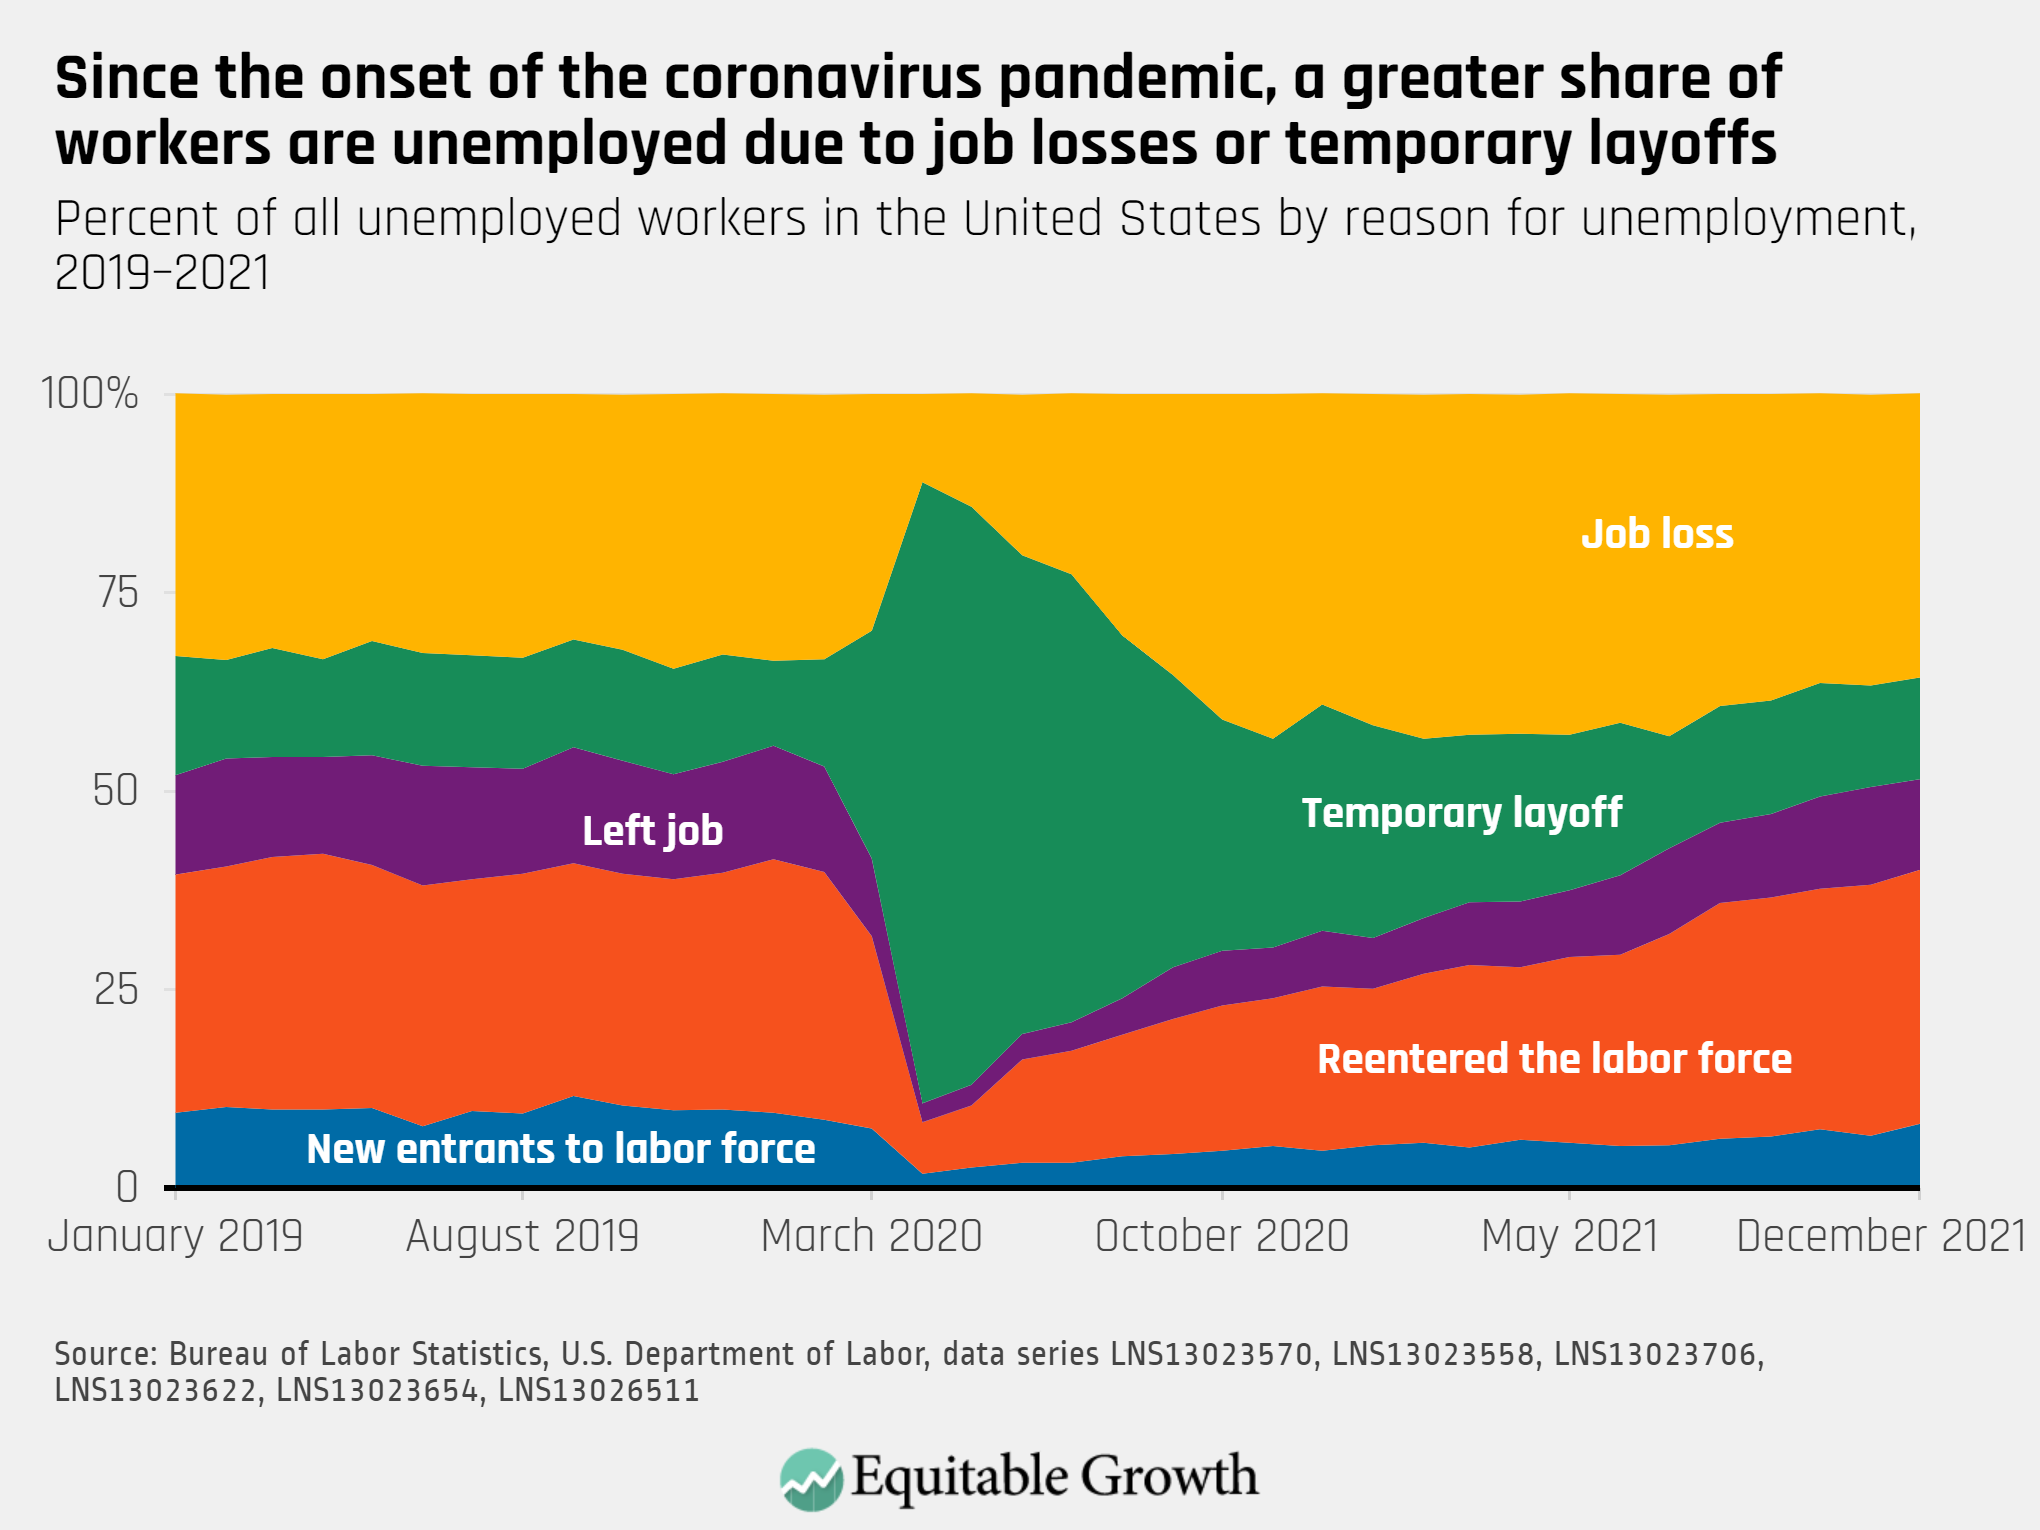
The number of unemployed workers fell by 483,000 in December. Workers who are new to the labor force (8.1 percent) or re-entering the labor force (32.0 percent) made up a greater share of unemployed workers in December, while a smaller share of unemployment was due to job loss.
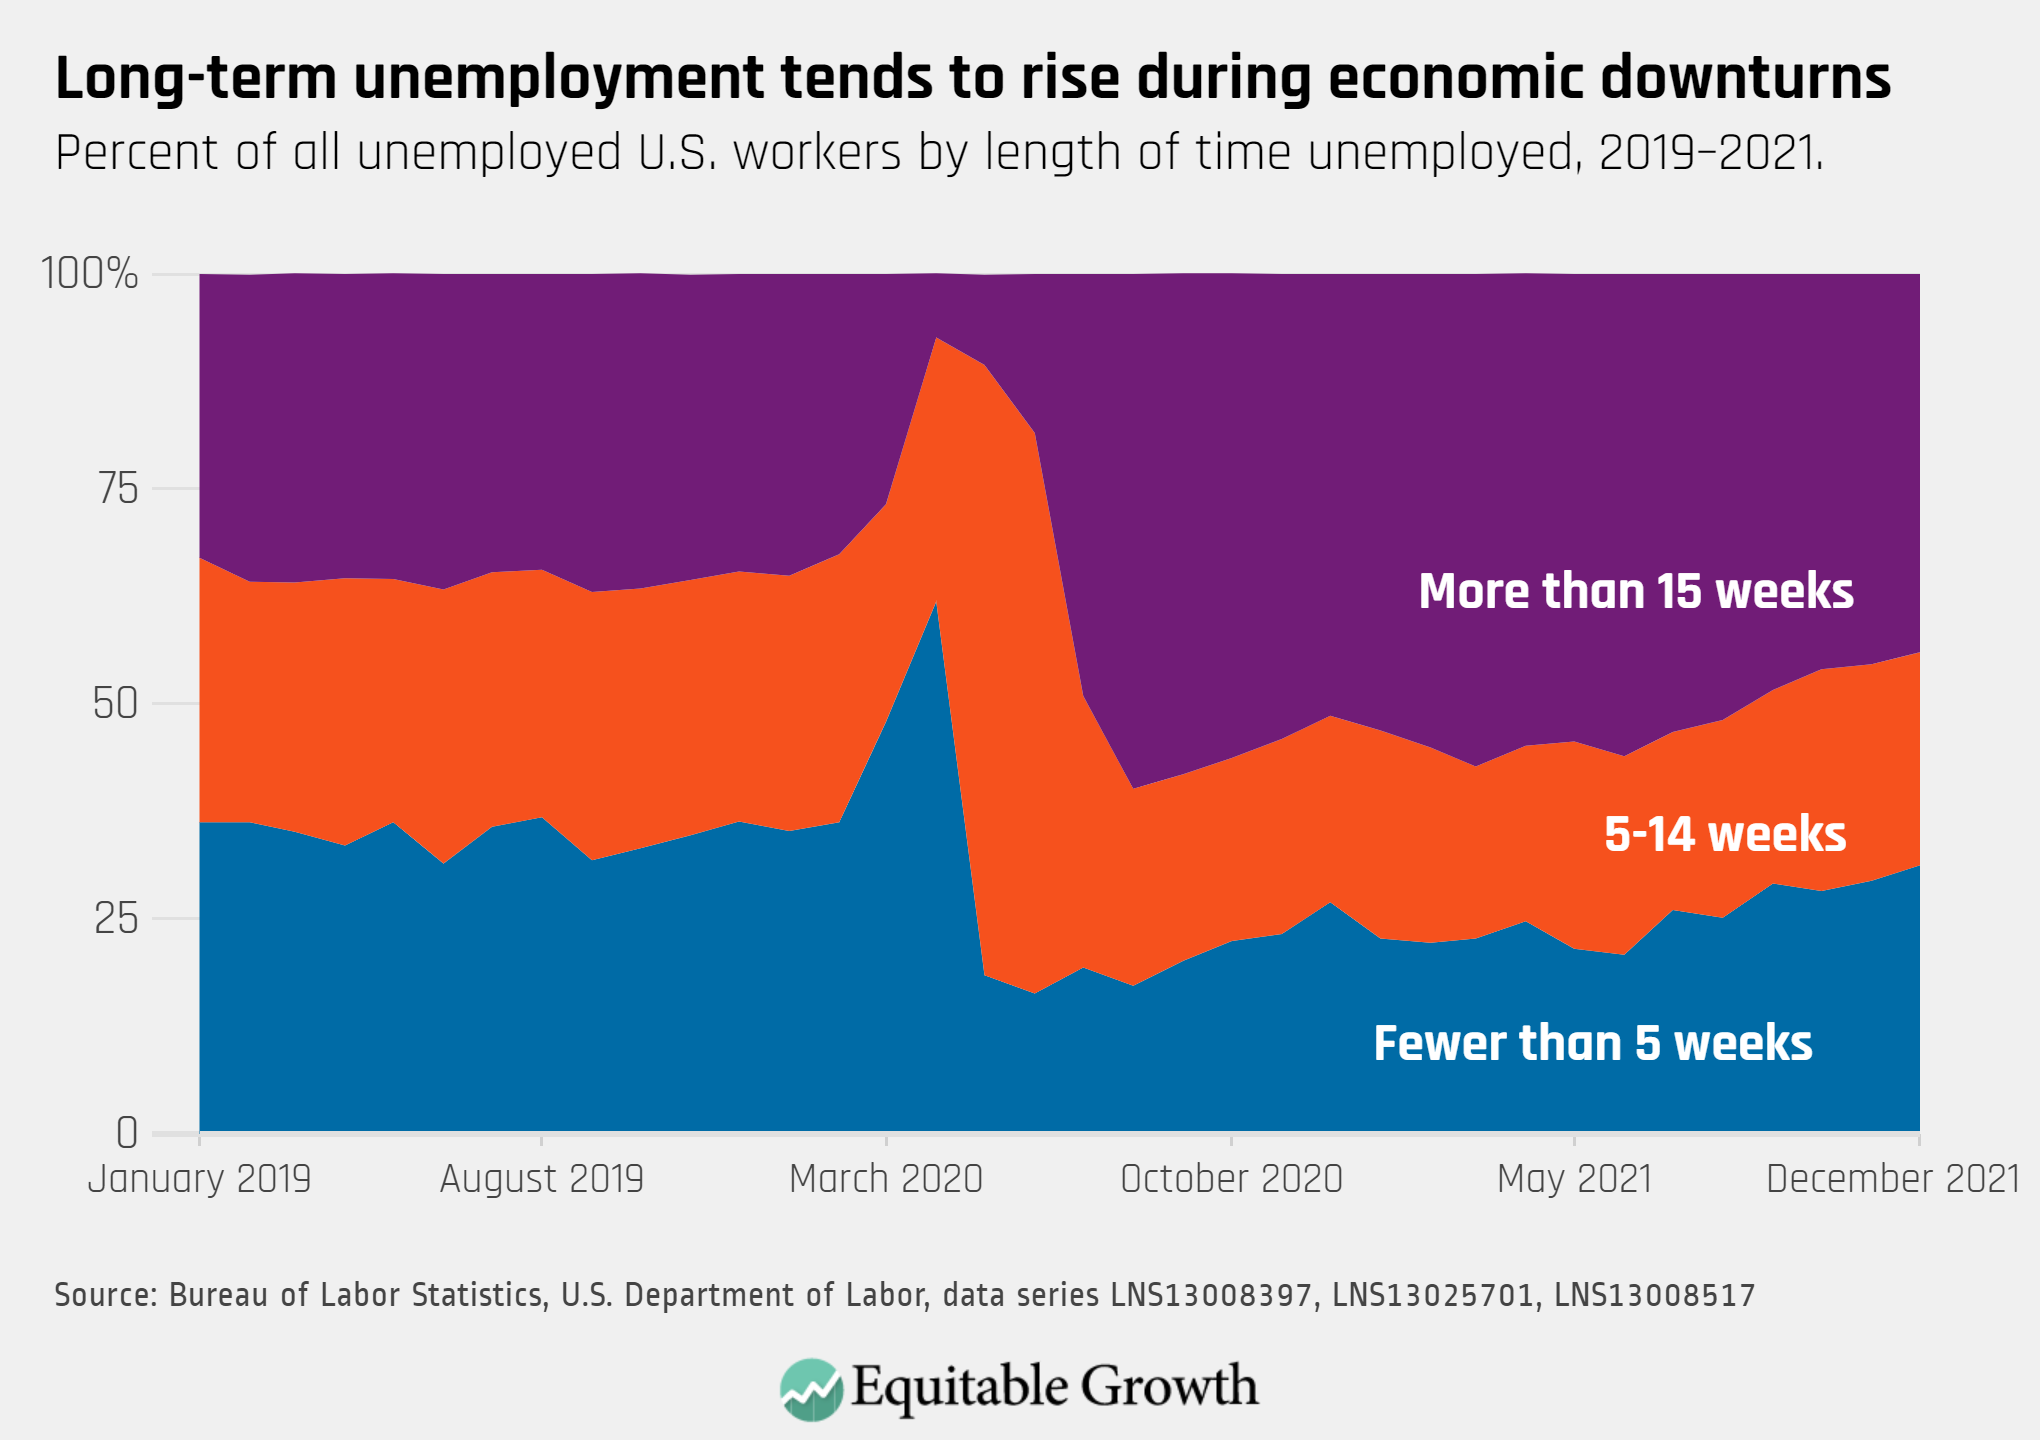
The proportion of unemployed U.S. workers facing long-term unemployment declined in December but remains elevated, as fewer than half (44.0 percent) of unemployed workers have been out of work for more than 15 weeks. A quarter (24.8 percent) have been out of work for 5-14 weeks, and almost a third (31.2 percent) for fewer than five weeks.
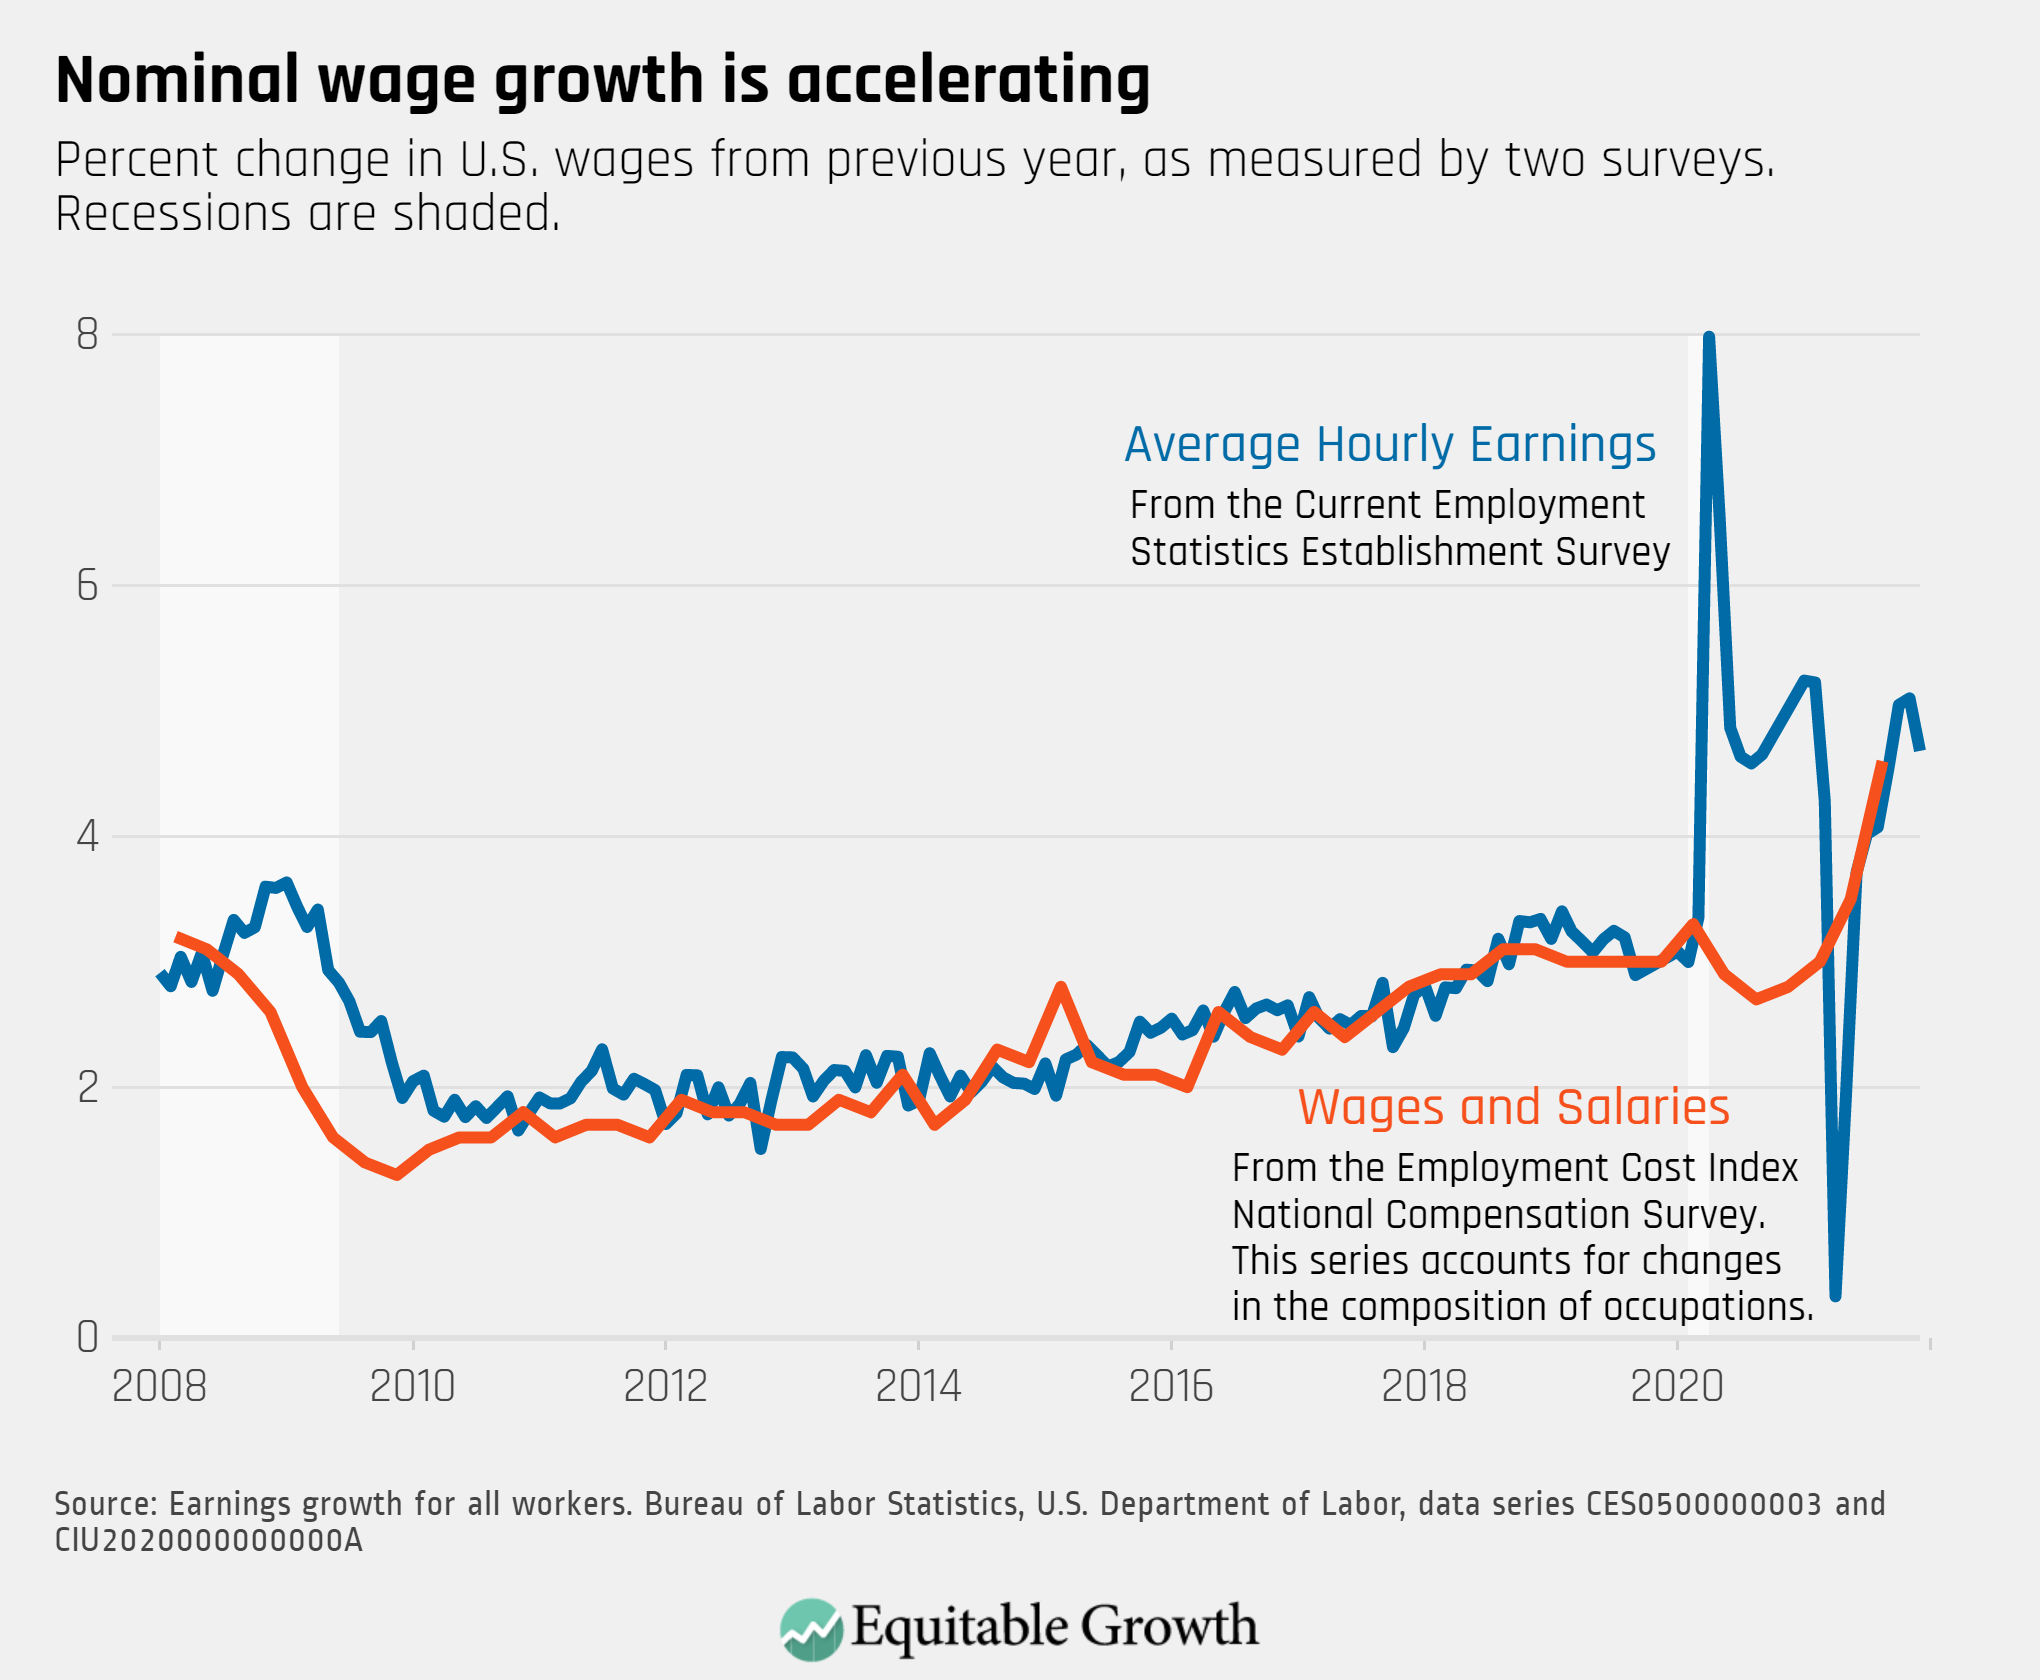
At the end of a volatile year, nominal earnings (not accounting for inflation) continued to rise, as average hourly earnings rose from $31.12 in November to $31.31 in December, while rising 4.7 percent year over year.