Equitable Growth’s Jobs Day Graphs: August 2020 Report Edition
On September 4th, the U.S. Bureau of Labor Statistics released new data on the U.S. labor market during the month of August. Below are five graphs compiled by Equitable Growth staff highlighting important trends in the data.
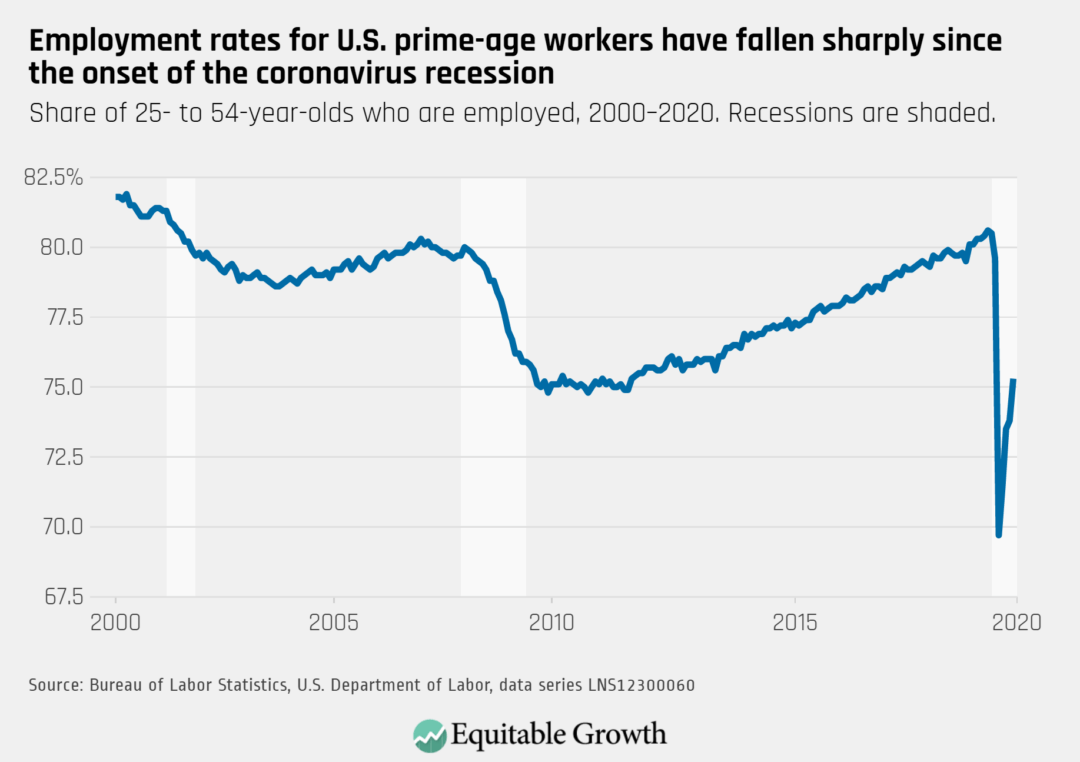
While still well below its pre-coronavirus level, the employment rate for prime-age workers rose to 75.3% in August, having regained half of the losses since its low in April.
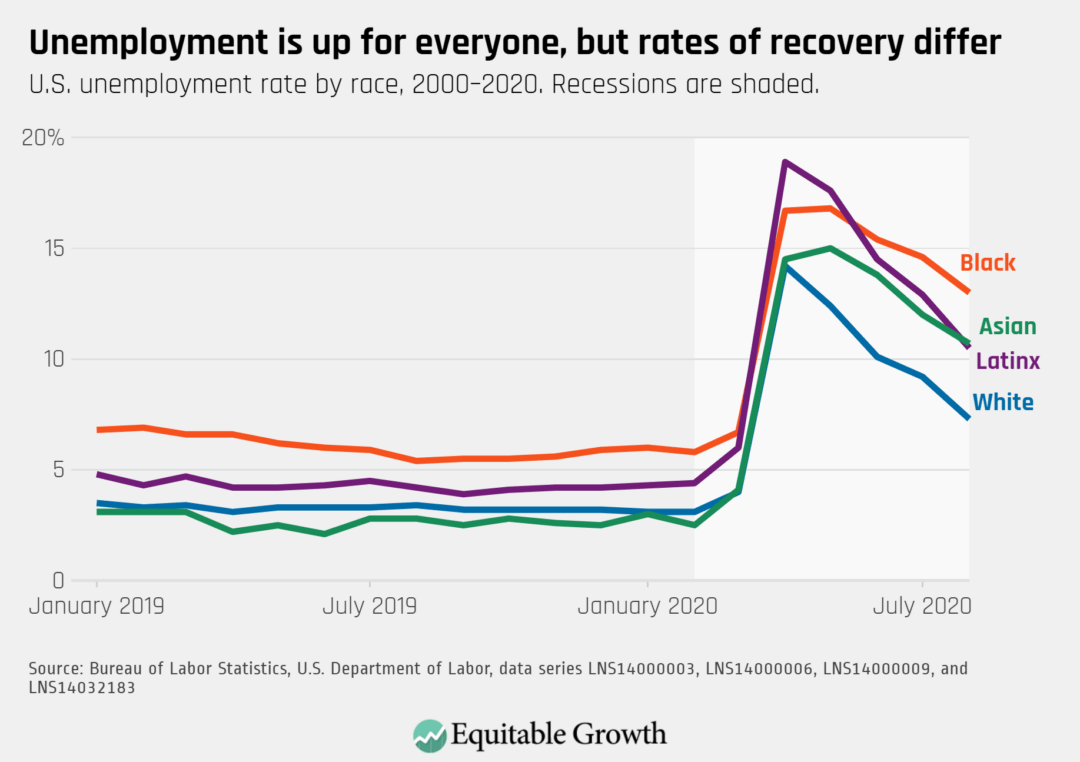
Unemployment rates remain highest for Black workers at 13.0%. Latinx unemployment fell to 10.5%, just below the Asian American unemployment rate of 10.7%. White unemployment declined to 7.3%.
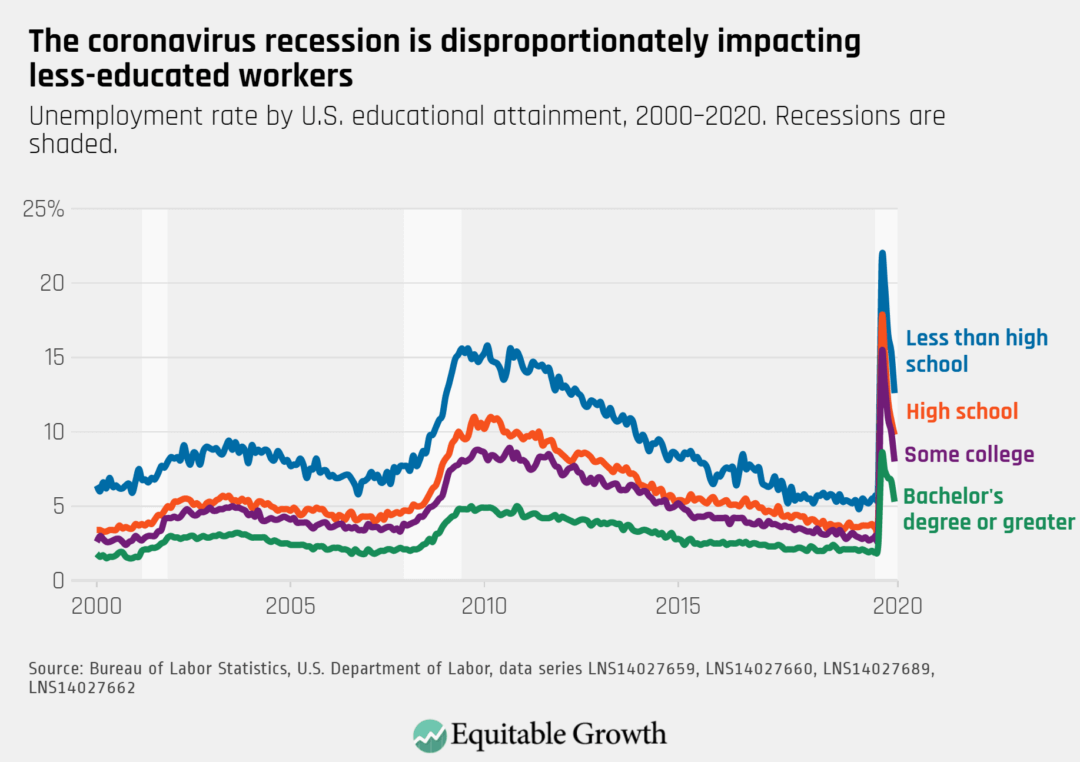
While unemployment rates continue to decline for all education levels, the unemployment rate for workers with less than a high school education is still more than twice as high as for those with a college degree.
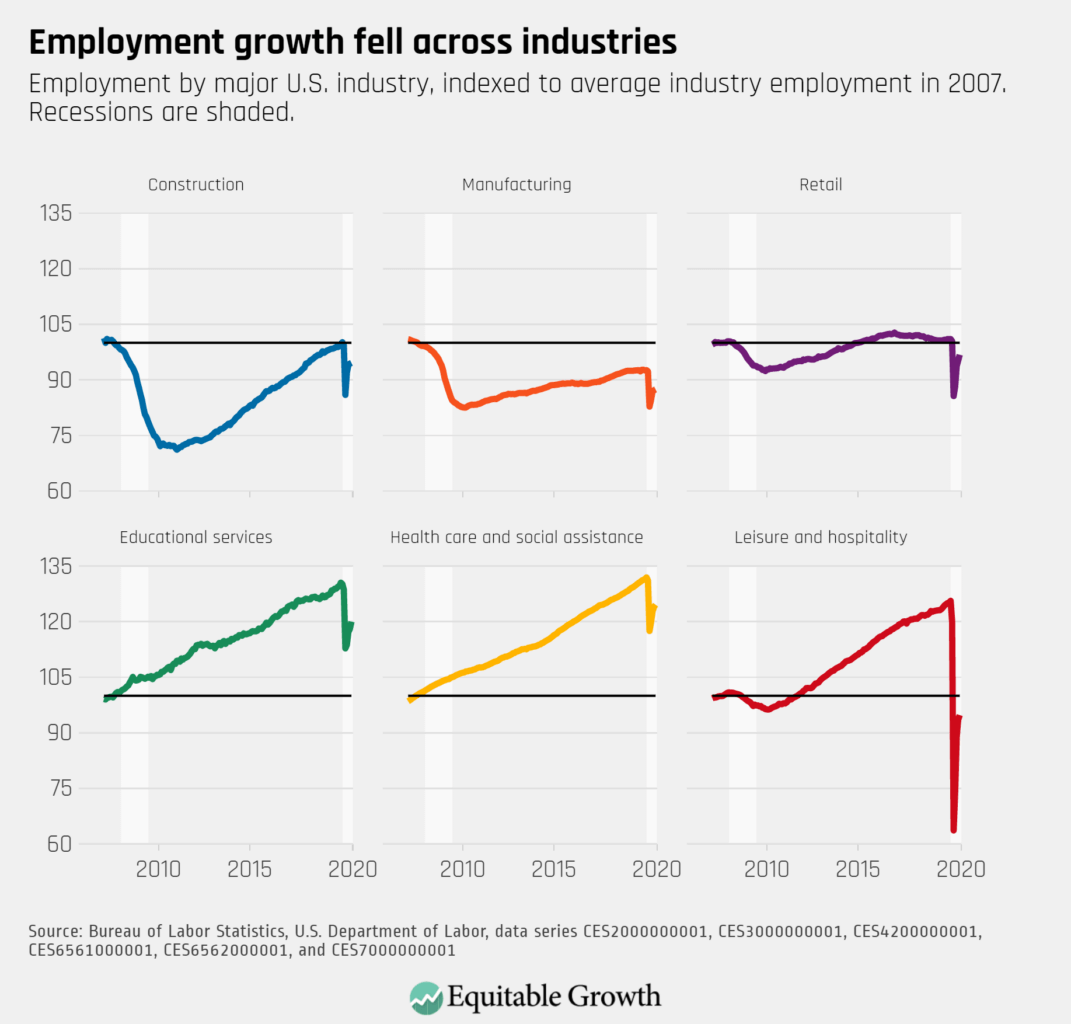
Employment rose across all sectors in August, and in leisure and hospitality has rebounded to roughly half of its lowest levels.
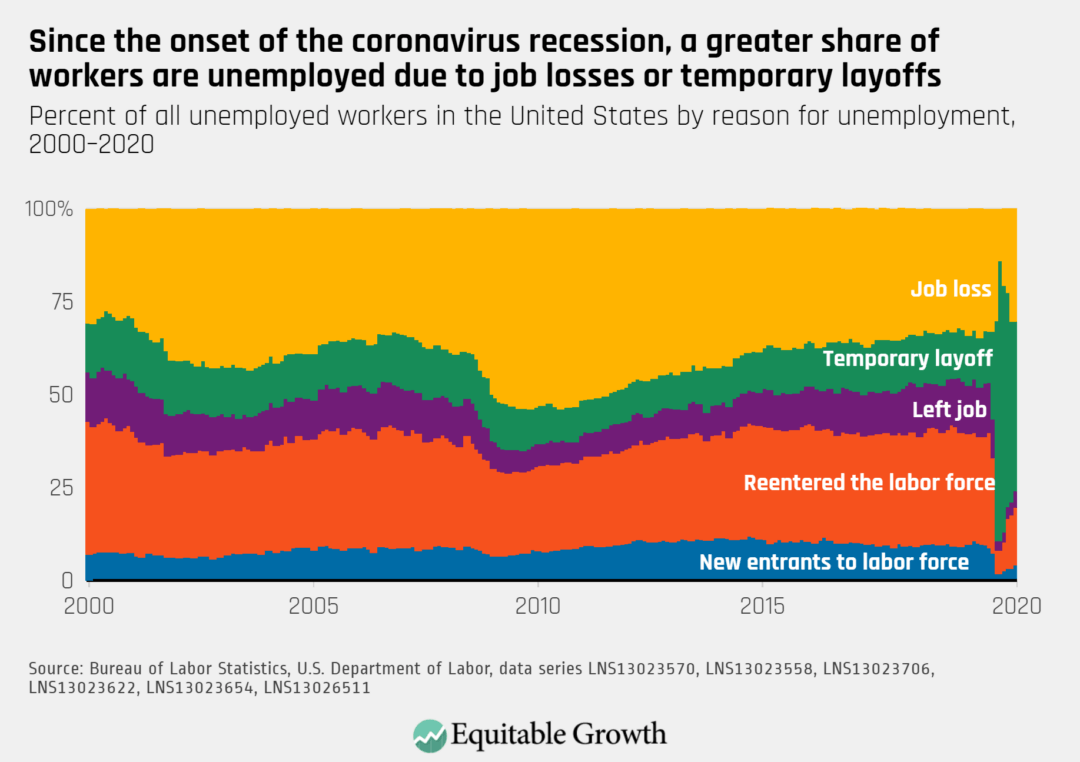
The proportion of unemployed workers who were on temporary layoff fell to 45.5% in August, while the share of permanent job losers rose to 30.6%.