Equitable Growth’s Jobs Day Graphs: April 2022 Report Edition
On May 6, the U.S. Bureau of Labor Statistics released new data on the U.S. labor market during the month of April. Below are five graphs compiled by Equitable Growth staff highlighting important trends in the data.
The employment rate for prime-age workers decreased slightly to 79.9 percent in April from 80.0 in March as total nonfarm employment rose by 428,000.

The unemployment rate stayed at 3.6 percent in April, and remains higher for Black workers (5.9 percent) and Latino workers (4.1 percent) compared to White workers (3.2 percent) and Asian American workers (3.1 percent).

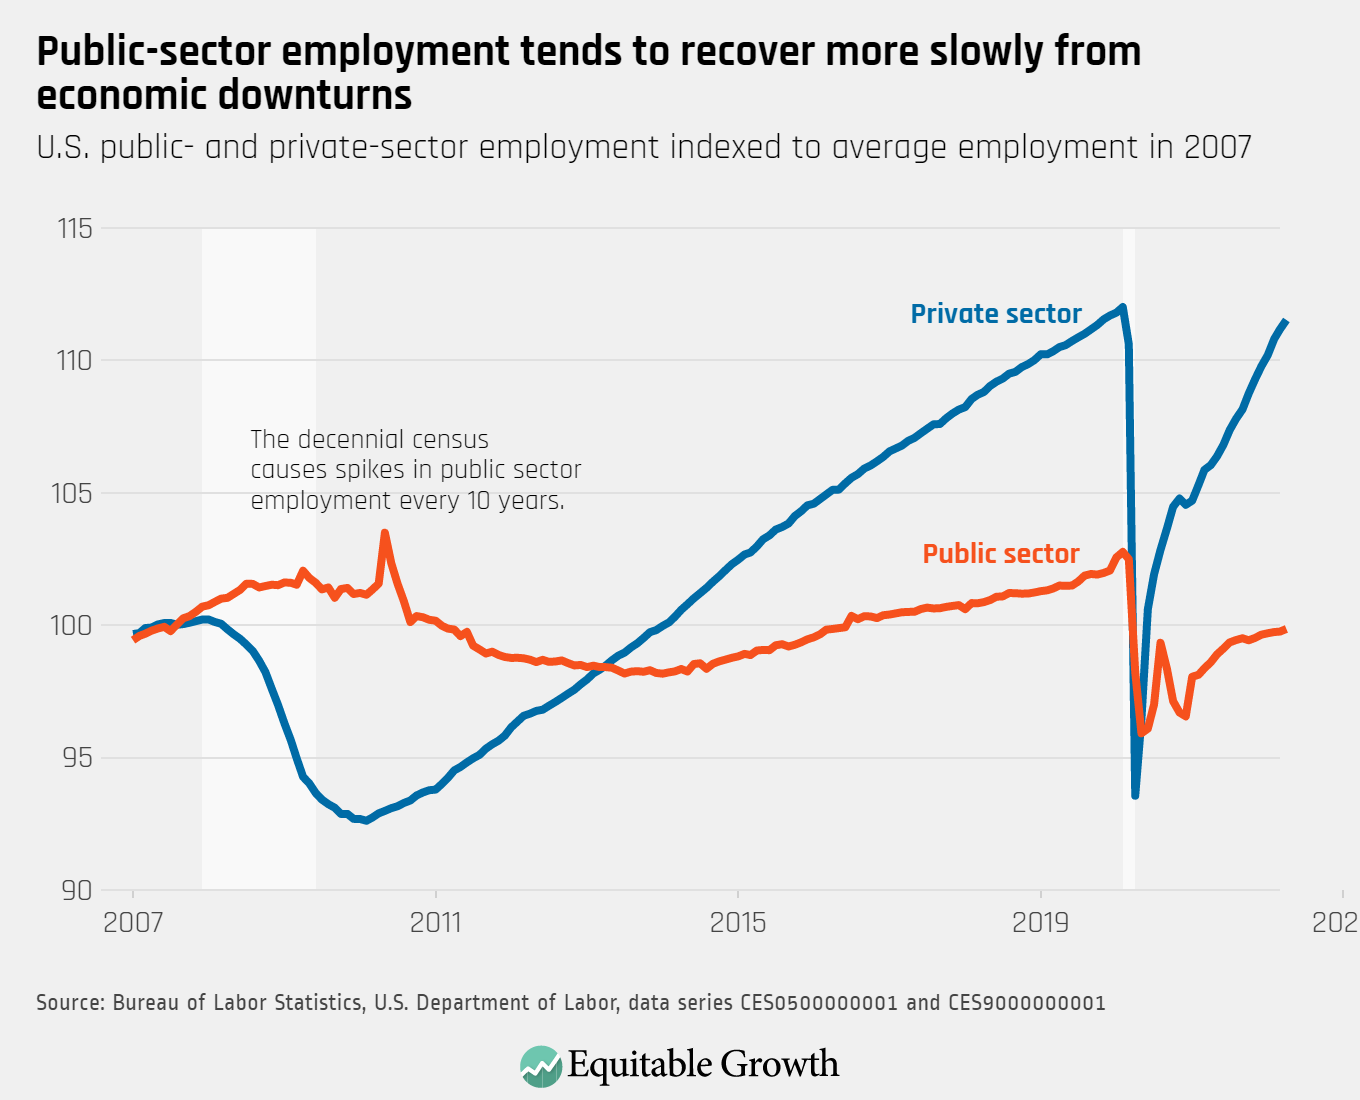
Private-sector employment continued to rise in April, while public-sector employment has recovered more slowly and remains well below pre-pandemic levels.
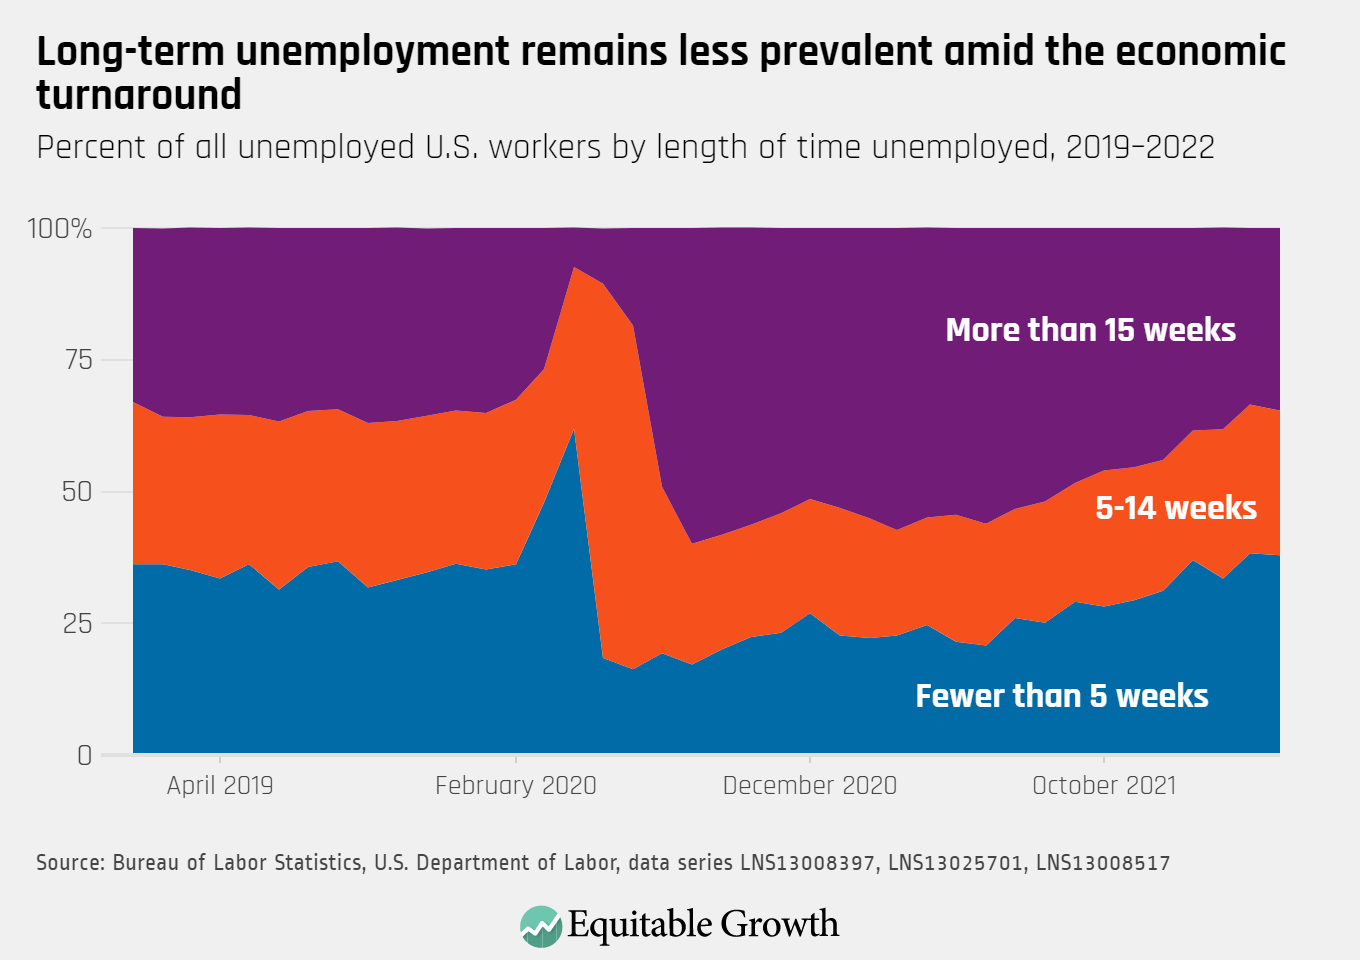
The proportion of unemployed U.S. workers facing long-term unemployment increased in April, as 34.6 percent of unemployed workers now have been out of work for more than 15 weeks.
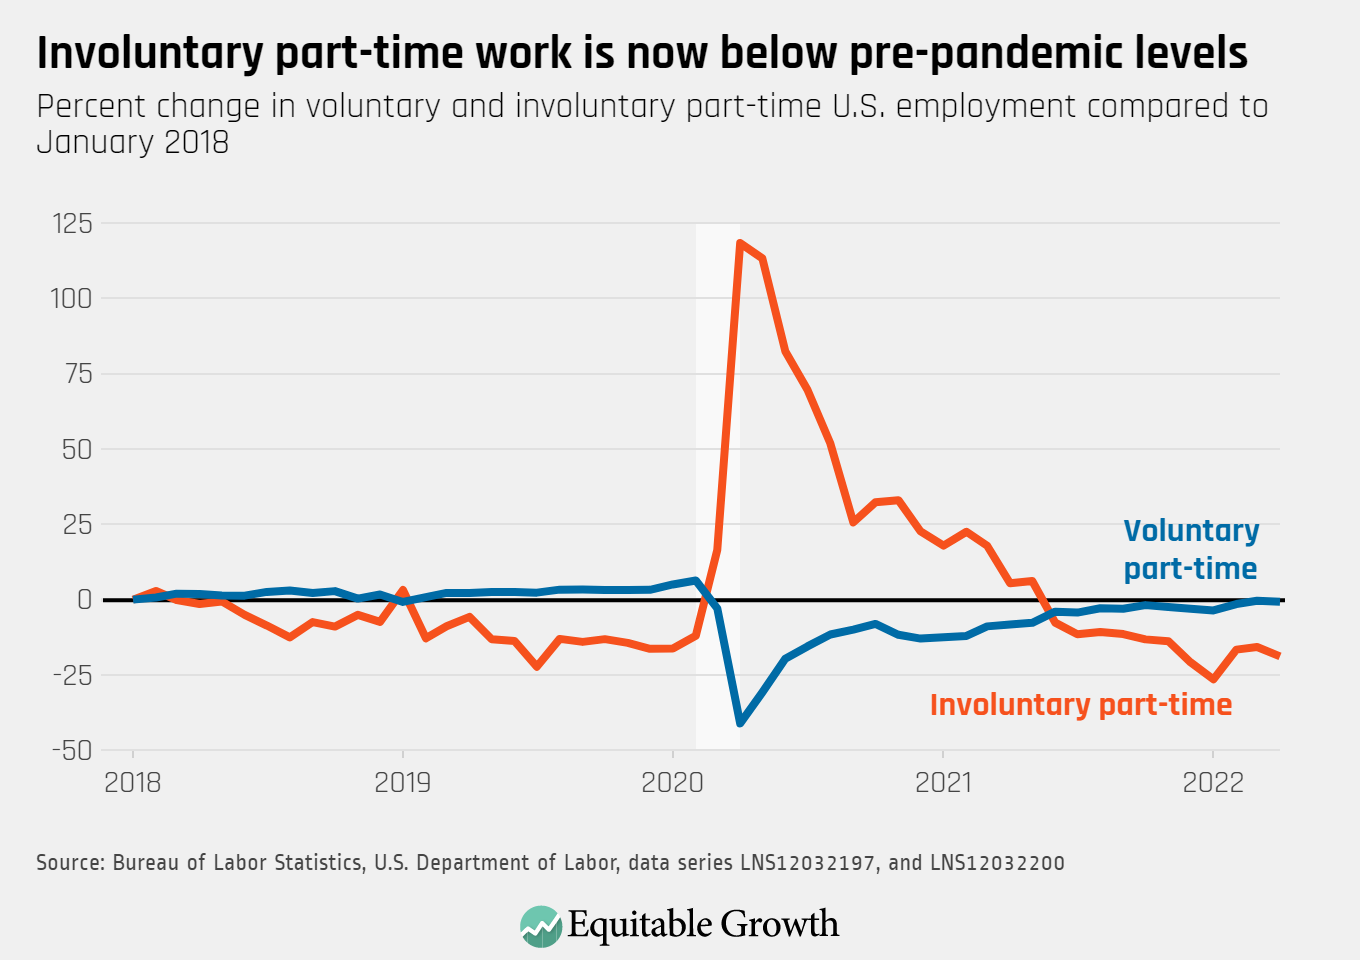
Involuntary part-time work, which represents part-time workers who would prefer full-time work, has returned to below pre-pandemic levels.