Equitable Growth’s Jobs Day Graphs: April 2020 Report Edition
On May 8th, the U.S. Bureau of Labor Statistics released new data on the U.S. labor market during the month of April. Below are five graphs compiled by Equitable Growth staff highlighting important trends in the data.
1.
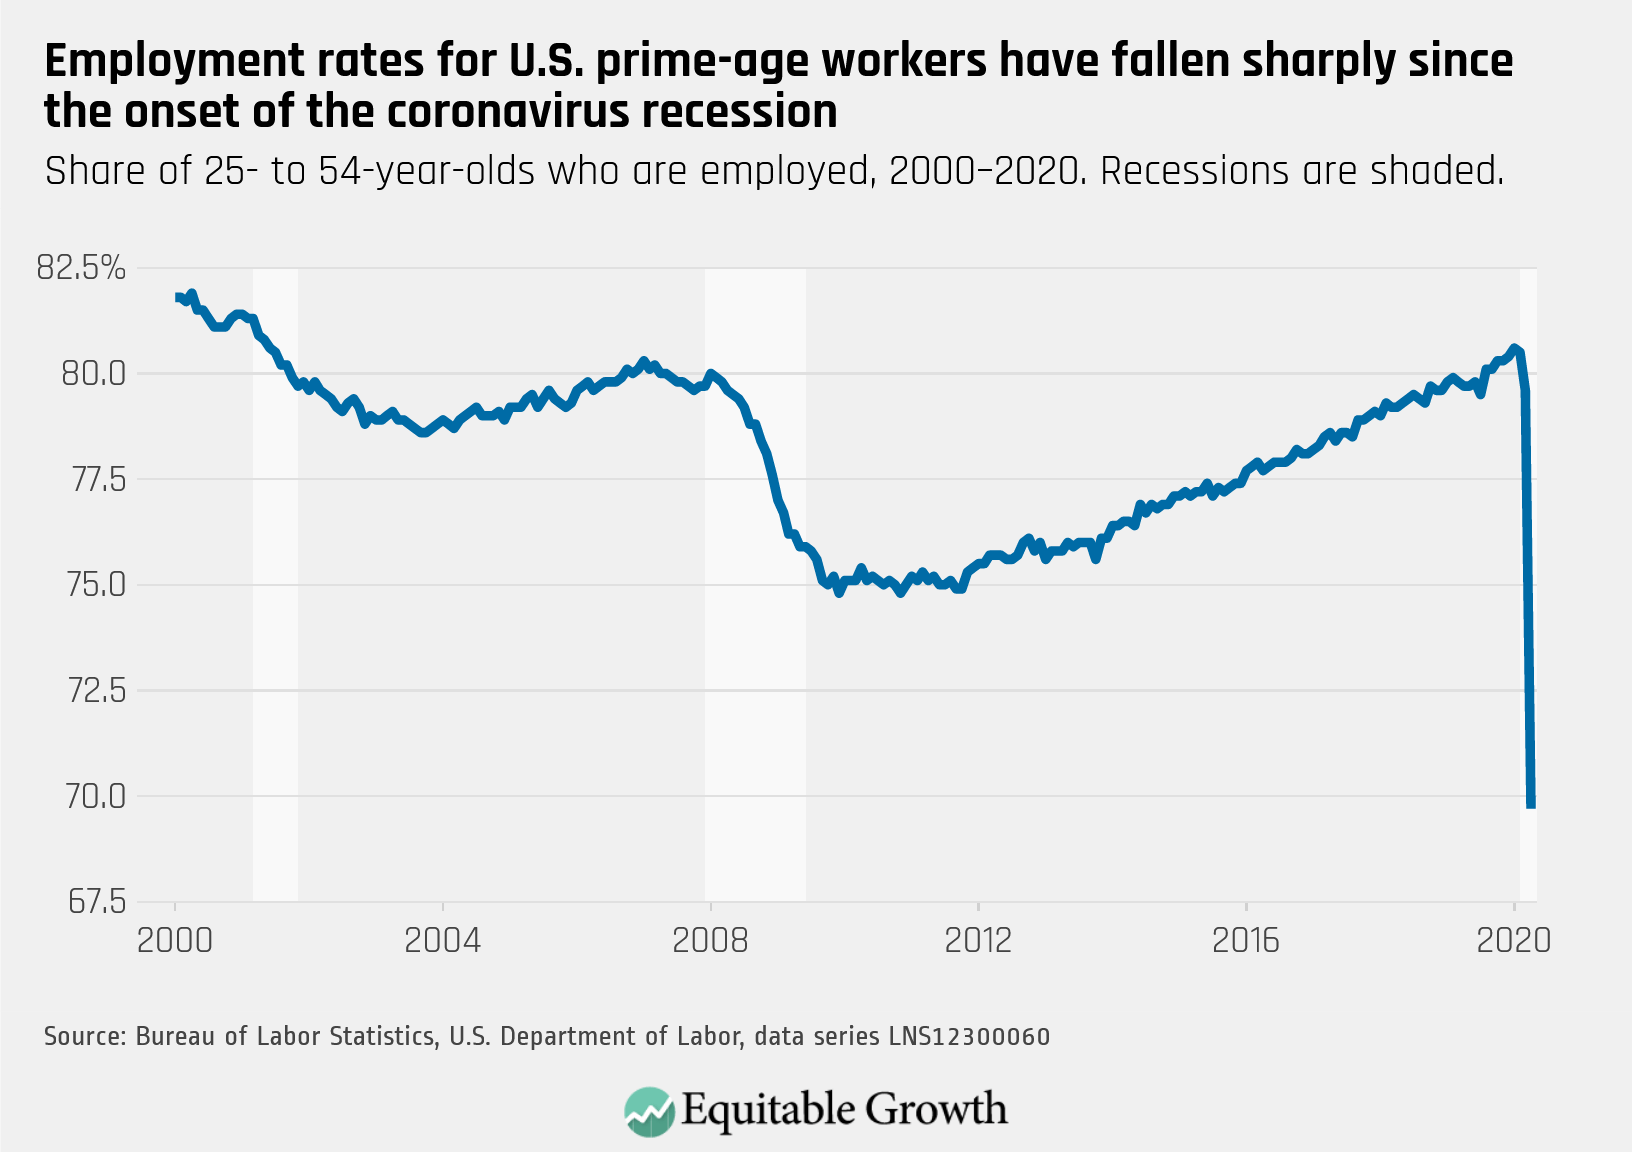
The employment rate for prime-age workers plummeted 10 percentage points, erasing all gains for those in their prime working years during the recovery from the Great Recession.
2.
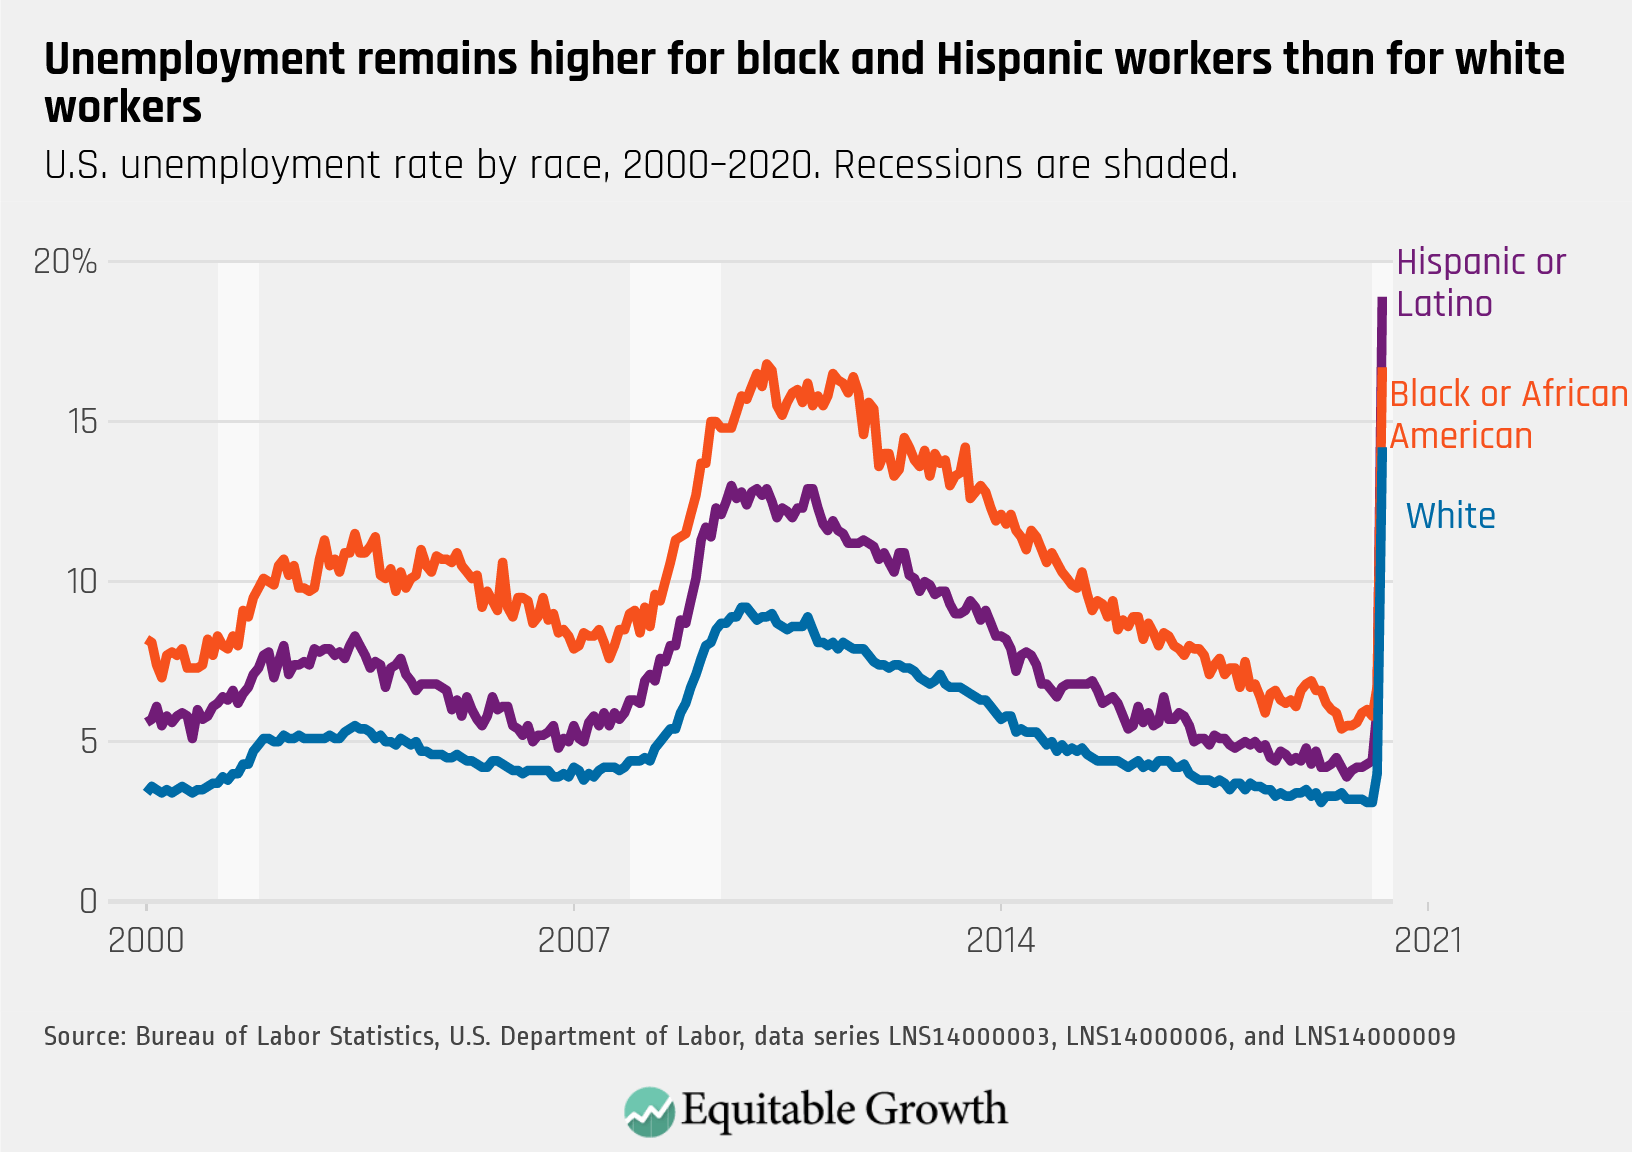
The unemployment rates for black and Hispanic workers shot up to 16.7 percent and 18.9 percent, respectively, compared to a steep but less severe increase for white workers up to 14.2 percent.
3.
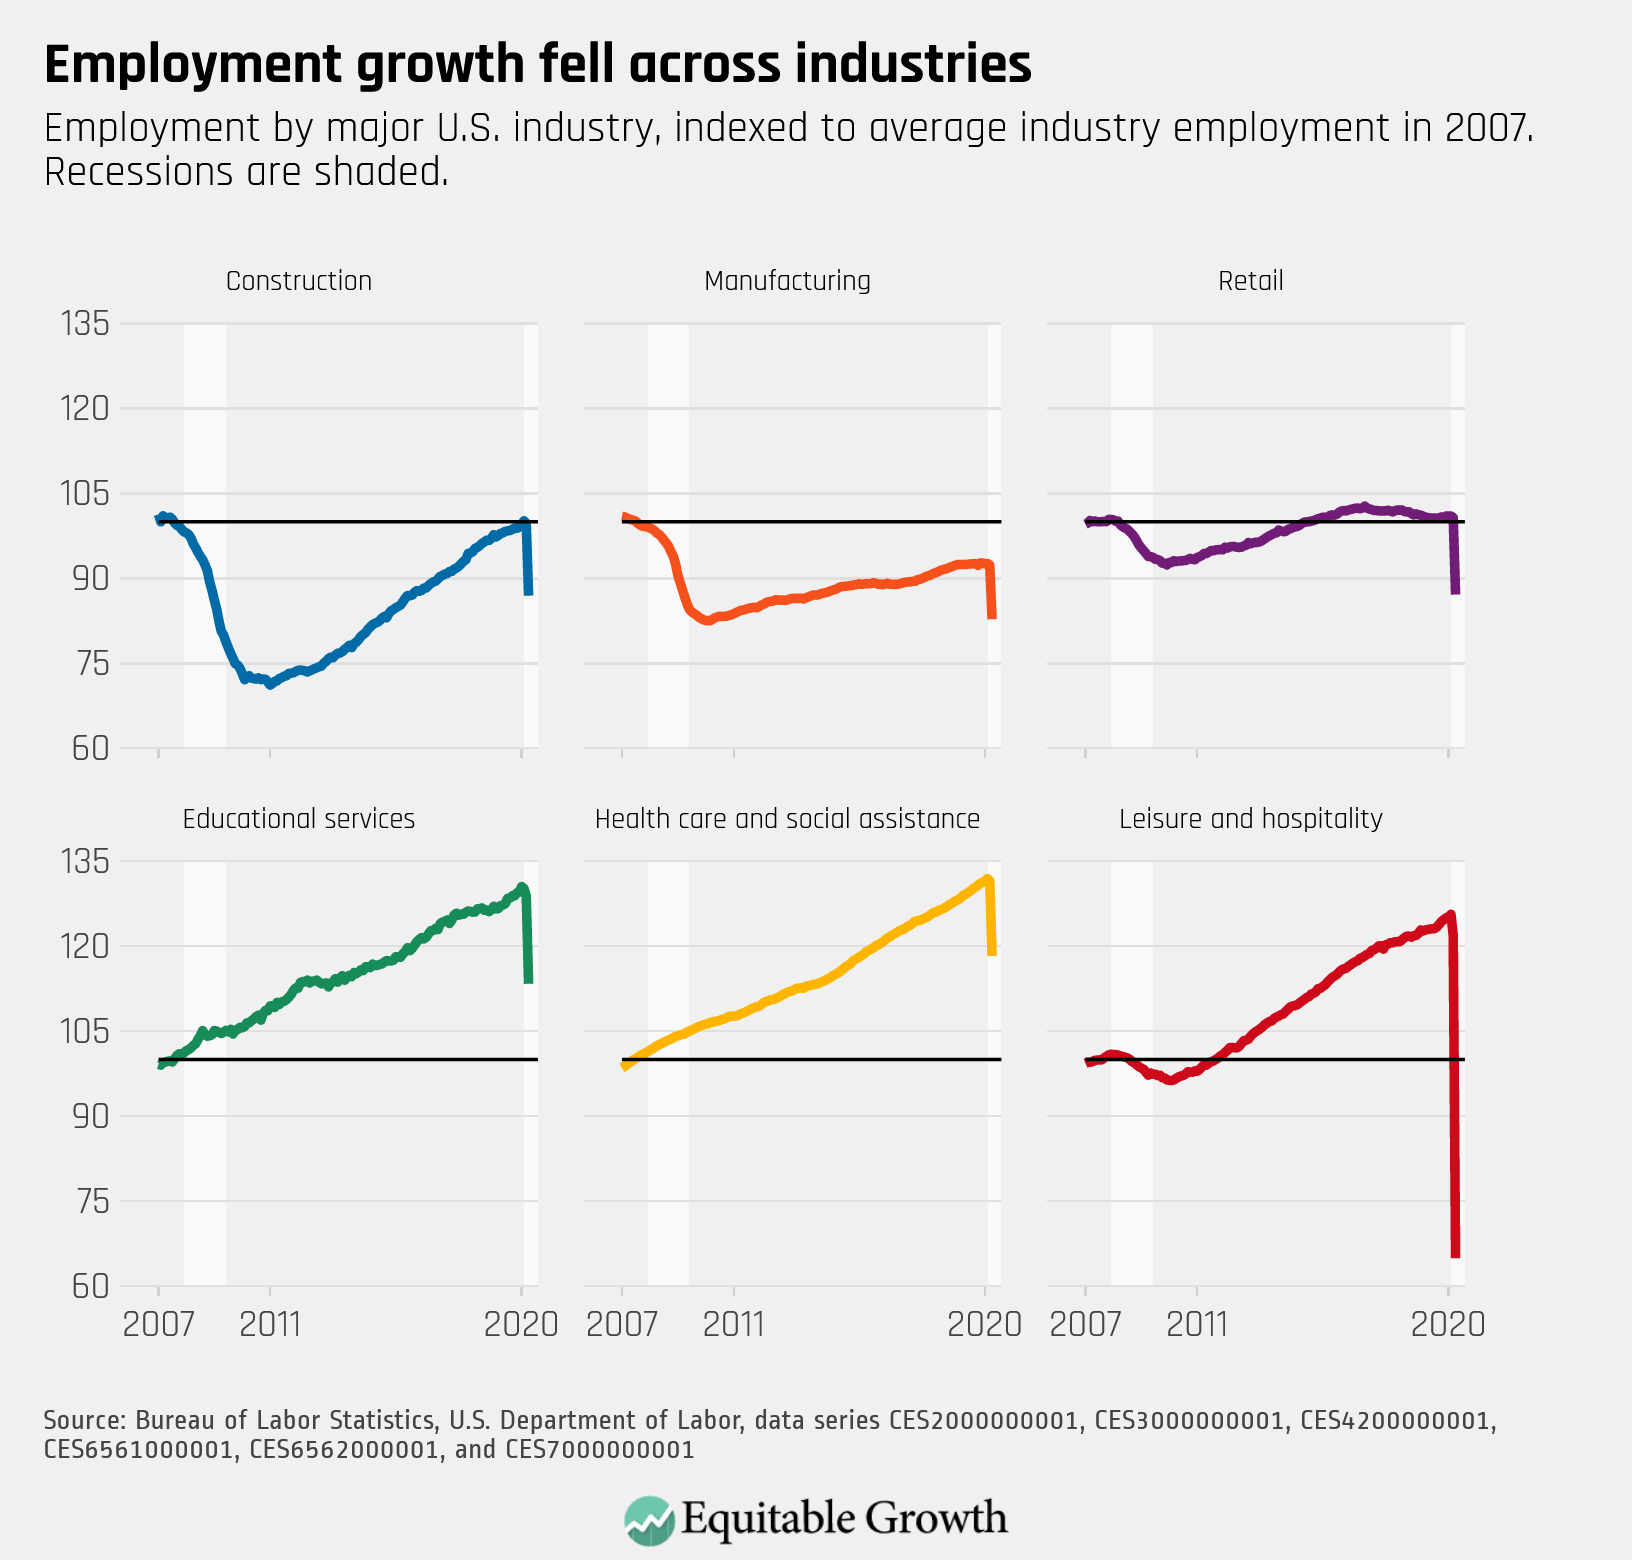
Jobs losses occurred across industries, with the greatest decline in leisure and hospitality, which shed 7.7 million jobs, or nearly half of all jobs in this sector.
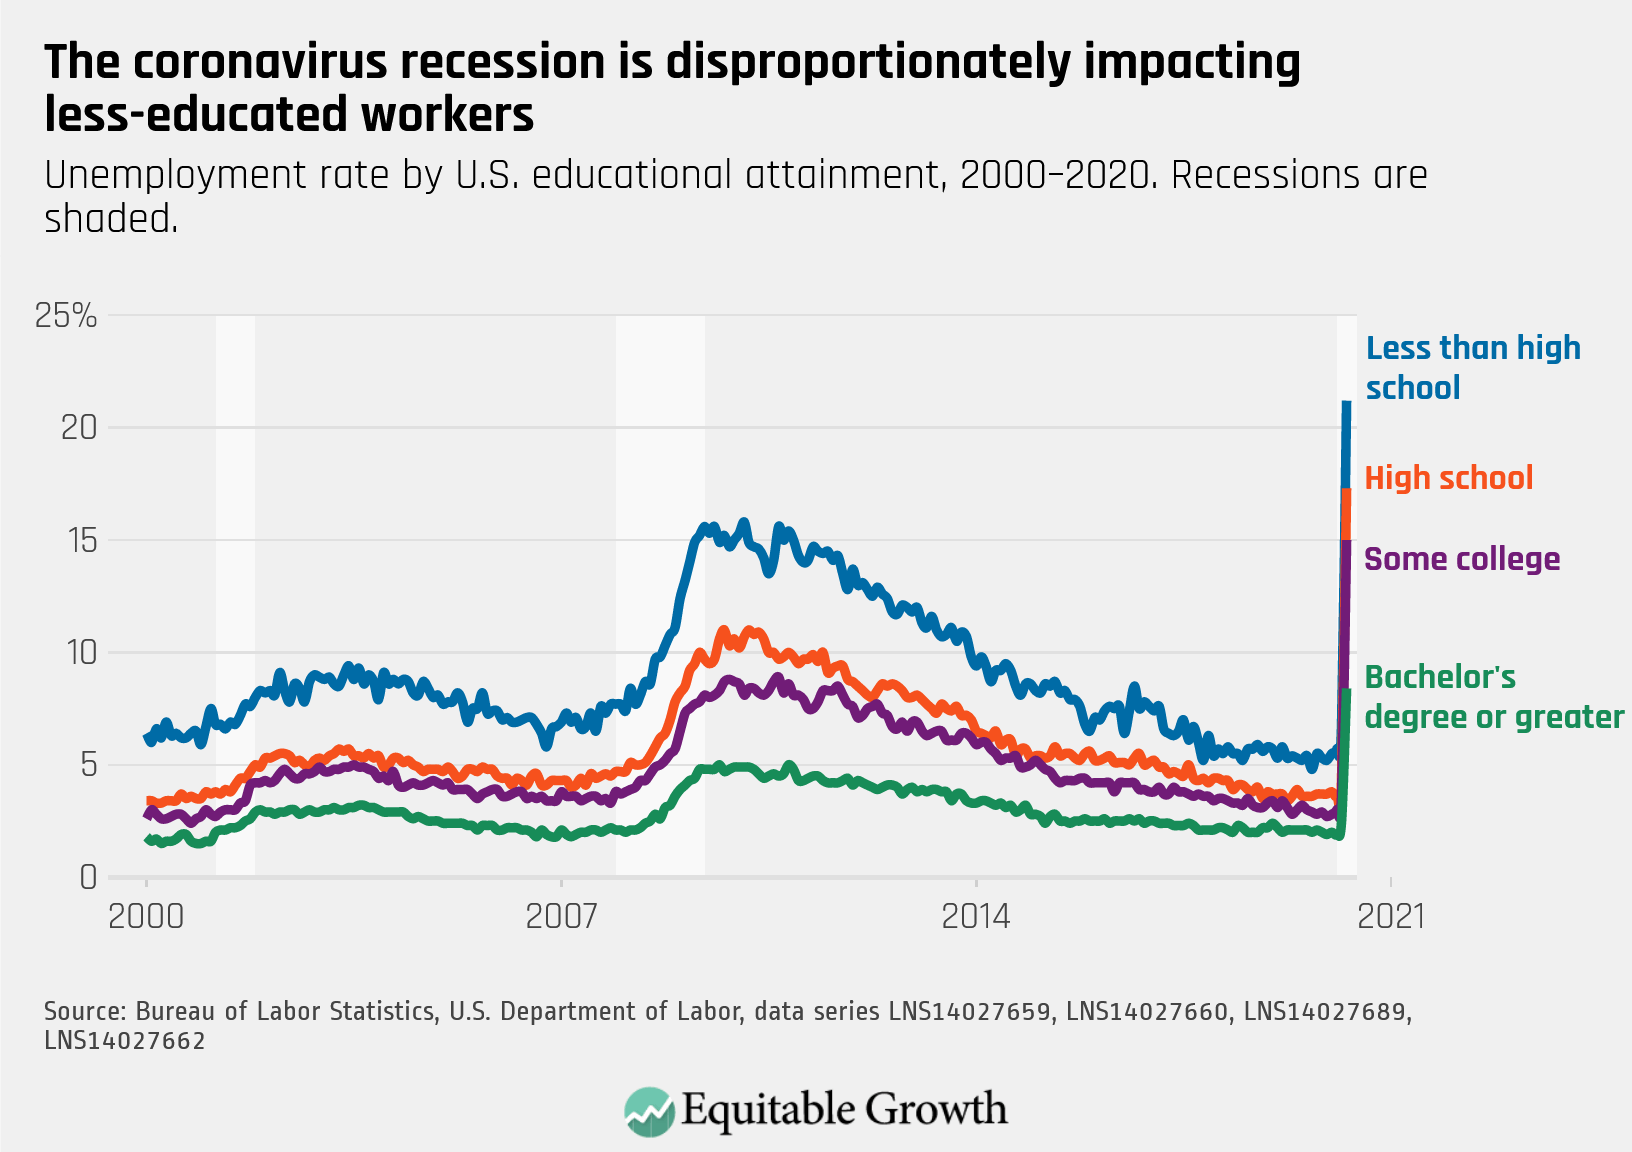
4.
The unemployment rate increased for workers at all education levels, with the highest levels for those with less than a high school degree, but the greatest increases for those with a high school degree and those with only some college.
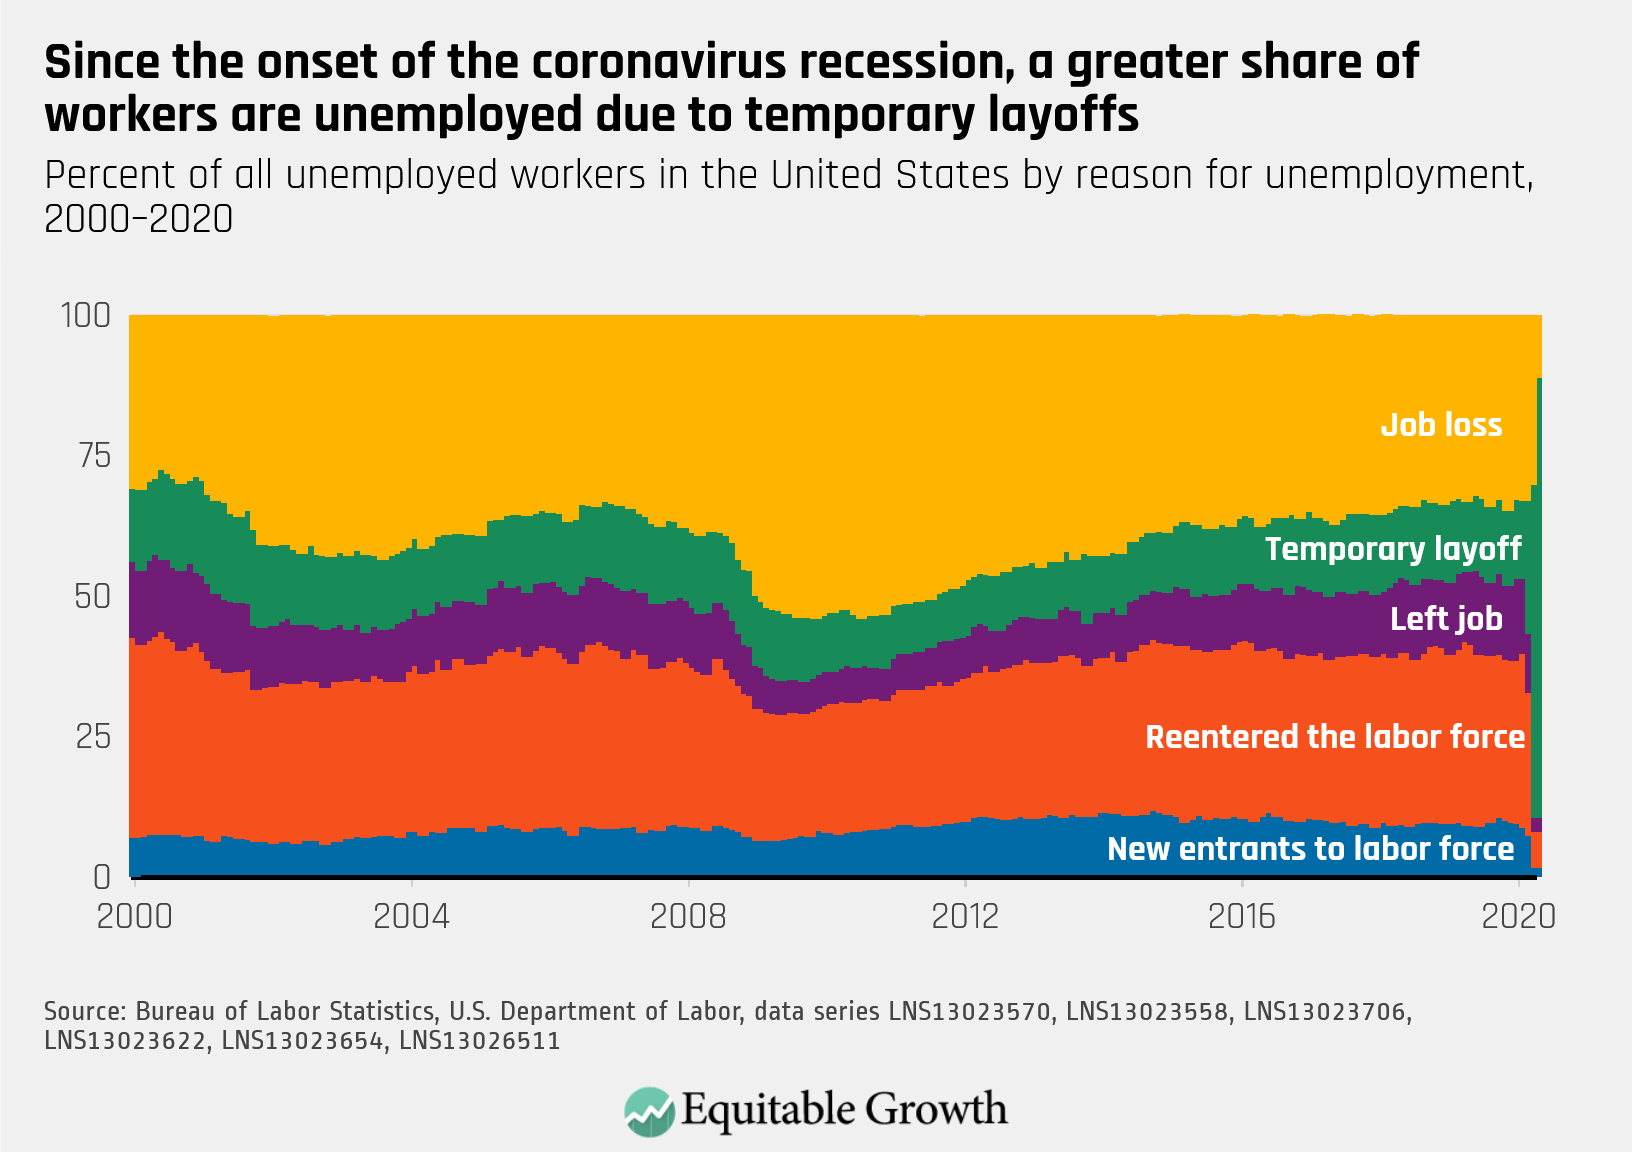
5.
The massive increase in unemployment was led by a ten-fold increase in temporary unemployment, or workers who were furloughed as the U.S. economy shut down to maintain social distancing.