Should-Read: Nick Bunker: Just how tight is the U.S. labor market?

Should-Read: Nick Bunker: Just how tight is the U.S. labor market?: “From the end of the 1991 recession until the second quarter of 2017, the prime employment rate explains about 80 percent of the variation in nominal wage growth…

Just how tight is the U S labor market Equitable Growth Just how tight is the U S labor market Equitable Growth

…The unemployment rate… explains 50 percent of the variation in nominal wage growth…. Models that include both the unemployment rate and the job switching rate explain less of the variation in wage or compensation growth than the prime employment rate by itself…. When unemployment is included with the prime employment rate, an increase in the unemployment rate is associated with an increase in wage and compensation growth—the opposite of what we might expect….

The… U.S. labor market is not as tight as the unemployment rate would have us believe…. The strong relationship between the prime employment rate and several measures of wage and compensation growth suggest a number of nonemployed workers who can and may find a job are not being counted in the unemployment rate…. Many workers who seem locked out of the labor force may, in fact, be able to get a job if the labor market continues to tighten…. Overestimating the strength of the labor market and leaving these workers unemployed would be a tragedy not only for those workers, but for the U.S. economy as a whole.

Must- and Should-Reads: October 12, 2017


Interesting Reads:

Should-Read: Vitor Gaspar and Mercedes Garcia-Escribano: Inequality: Fiscal Policy Can Make the Difference

Should-Read: Vitor Gaspar and Mercedes Garcia-Escribano: Inequality: Fiscal Policy Can Make the Difference: “Income inequality among people around the world has been declining in recent decades…

…[with] countries like China and India’s incomes catching-up to advanced economies. But… inequality within countries has increased, particularly in advanced economies…. Policymakers [now] have a window of opportunity to respond with reforms that tackle inequality, and our new Fiscal Monitor shows how the right mix of fiscal policies can make the difference. In advanced economies, fiscal policy offsets about a third of income inequality before taxes and transfers—commonly known as market income inequality—with 75 percent coming from transfers. Spending on education and health also affects market income inequality over time by promoting social mobility, including across generations. In developing economies, fiscal redistribution is much weaker, given lower and less progressive taxes and spending…

Should-Read: Jörg Mayer: Industrial robots and inclusive growth

Should-Read: Jörg Mayer: Industrial robots and inclusive growth: “Robots are not yet suitable for a range of labour-intensive industries…

…leaving the door open for developing countries to enter industrialisation processes along traditional lines. At the same time, it suggests ways that developing countries should embrace the digital revolution….

Item 0 and AirPortExtra and Item 0

Assessments of the employment impact of robots have generally been based on a task-based approach, which hypothesises that a job is composed of different tasks and that new technology does not always favour better-skilled workers but often complements workers in certain tasks of their job, while substituting for them in others (Autor et al. 2003). This approach distinguishes between manual, routine, and abstract tasks…. Routine-task intensity indices, which link routine tasks to occupations that workers perform on their jobs…. Studies indicating robots’ dramatic job displacement potential… emphasise this technical feasibility of workplace automation….

The technical feasibility of job displacement in manufacturing is highest in food, beverages and tobacco, followed by the textiles, apparel and footwear sector…. Job displacement by robots is more profitable in relatively skill-intensive and well-paying manufacturing, such as the automotive and electronics sectors, than in relatively labour-intensive and low-paying sectors, such as apparel. The sizes of the bubbles reflect the sectoral distribution of actual global robot stocks in 2015…. Taken together… economic factors are more important for robot deployment than the technical possibilities of automating workers’ tasks…. Robot deployment has remained very limited in those manufacturing sectors where labour compensation is low, even if these sectors have high values on the routine task intensity index….

[This] suggests that robot-based automation per se does not invalidate the traditional role of industrialisation as a development strategy for lower income countries. Yet the dominance of robot use in sectors higher up on the skill ladder implies greater difficulty for latecomers in attaining sectoral upgrading and may limit their scope for industrialisation to low-wage and less dynamic (in terms of productivity growth) manufacturing sectors. This could seriously stifle these countries’ economic catch-up and leave them with stagnant productivity and per capita income growth…

JOLTS Day Graphs: August 2017 Report Edition

Every month the U.S. Bureau of Labor Statistics releases data on hiring, firing, and other labor market flows from the Job Openings and Labor Turnover Survey, better known as JOLTS. Today, the BLS released the latest data for August 2017. This report doesn’t get as much attention as the monthly Employment Situation Report, but it contains useful information about the state of the U.S. labor market. Below are a few key graphs using data from the report.

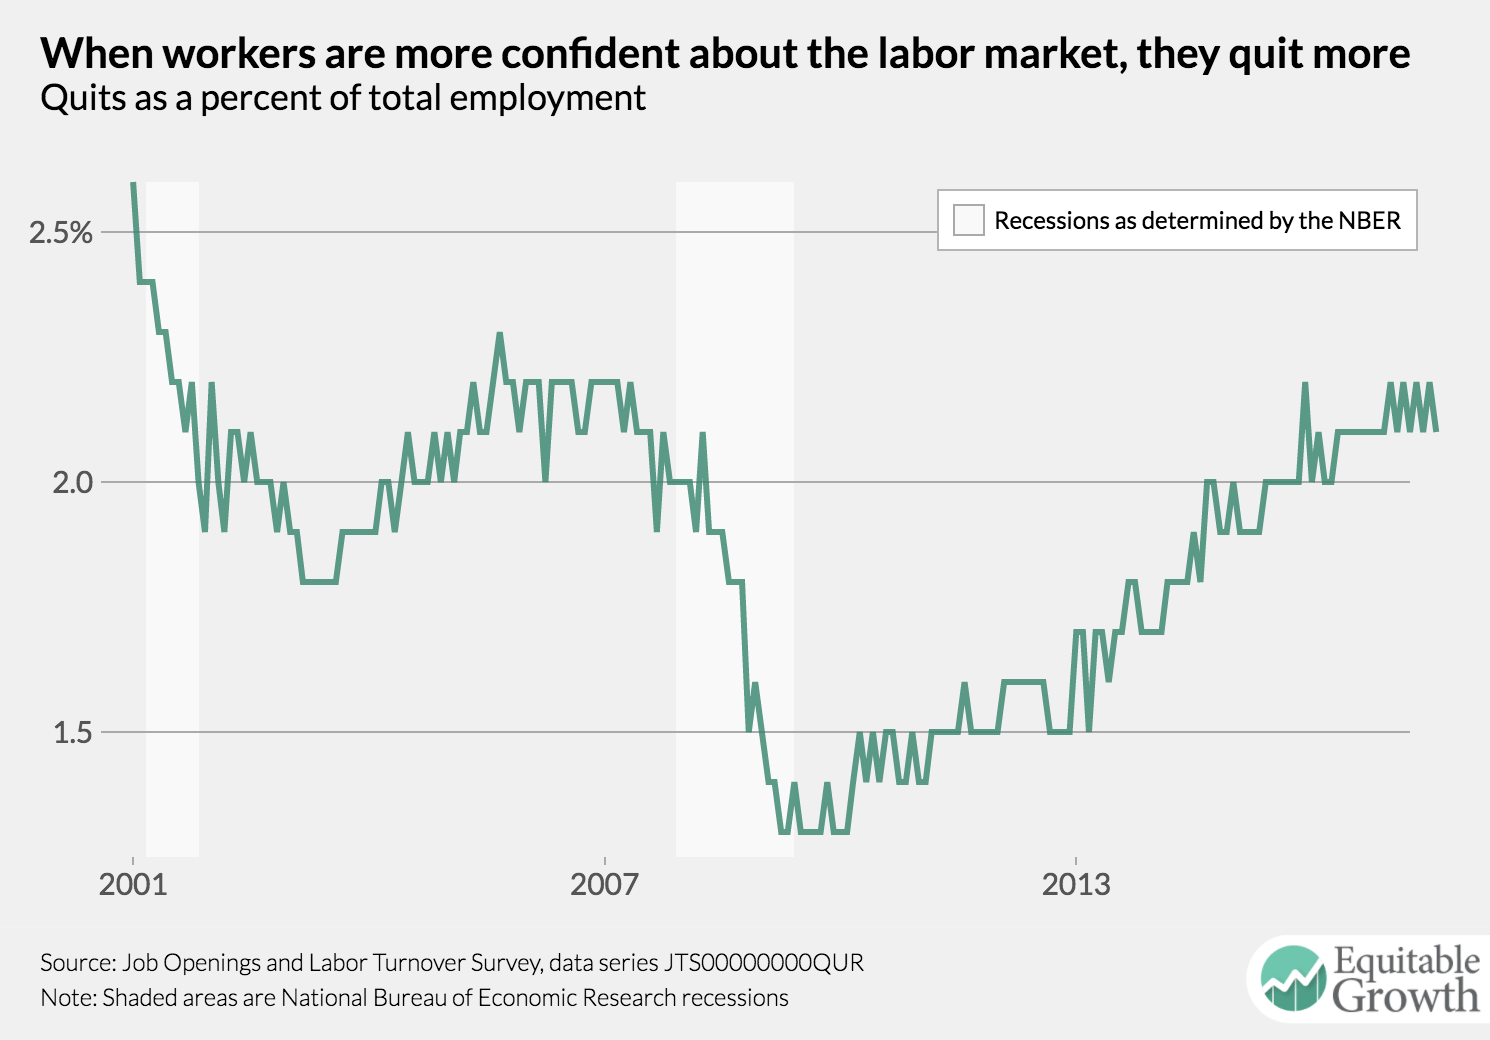
The quits rate continued its trend of not moving much in August, registering at 2.1 percent. With the exception of a few ticks up, it’s been stuck at that level since May 2016.

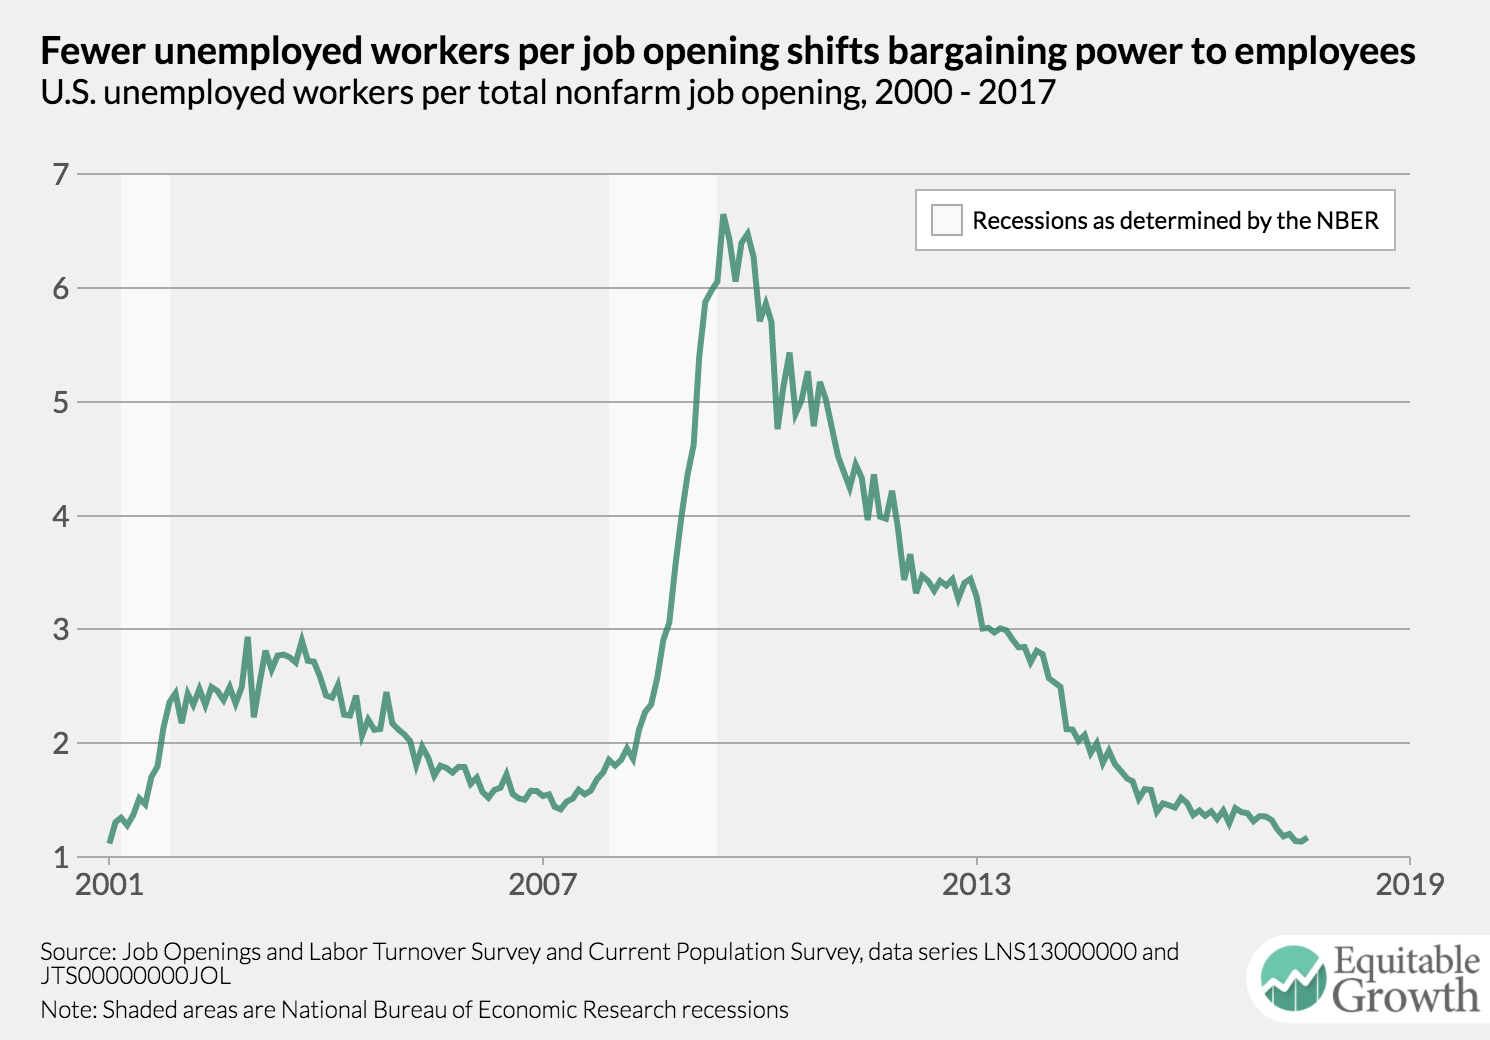
While the ratio of unemployed workers to job openings did not hit a record low in August, it’s still near the lowest levels seen during the period JOLTS data cover.

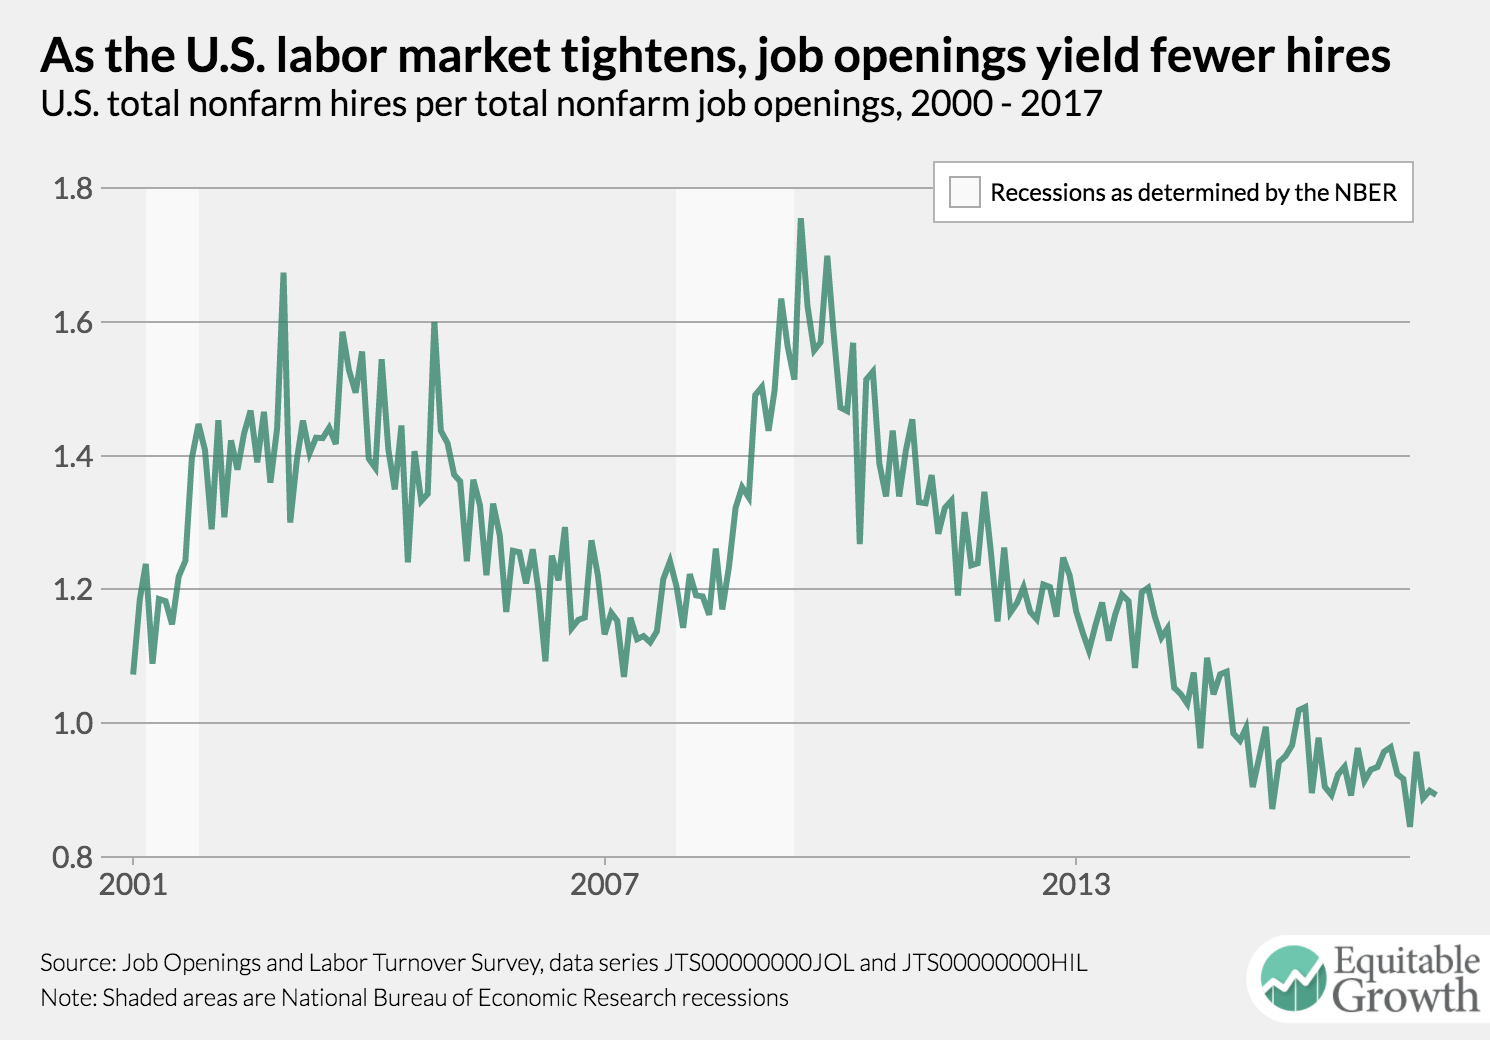
Employers are still getting fewer than one hire per job opening, with the vacancy yield coming in at 0.89 in August.

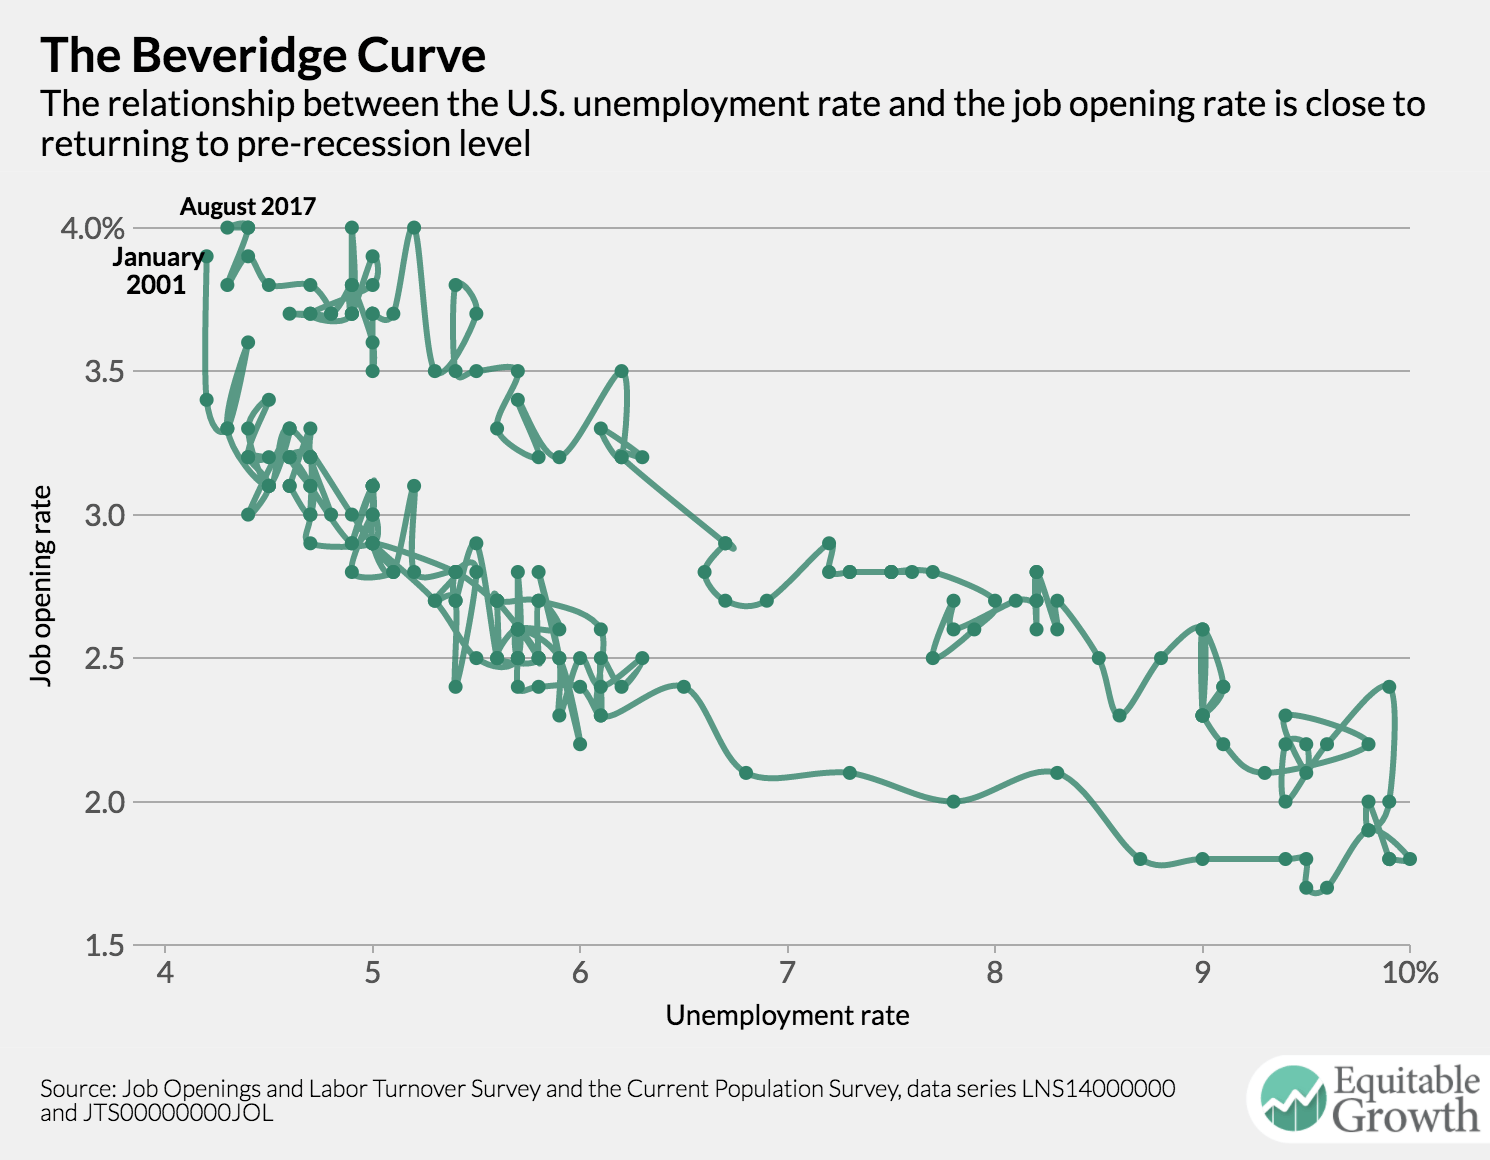
The Beveridge Curve is quite close to its pre-Great Recession relationship, but is not quite there yet.

Should-Read: Justin Fox: Nobel Winner Richard Thaler’s Savvy, Calculating Insurrection

Should-Readz: Justin Fox: Nobel Winner Richard Thaler’s Savvy, Calculating Insurrection: “‘Dumb stuff people do’ was an expansion, not a rejection, of mainstream economics…

…In the late 1970s, Richard Thaler thought most of his fellow economists deeply misunderstood how actual people make actual economic decisions, and his renegade ideas risked derailing his career. But they didn’t. Thaler’s was a lonely struggle for a while, but it evolved into a savvy, calculating operation. And it was successful…. This relatively cautious approach has occasioned some sneering… John Cochrane… in 2015 after the publication of Thaler’s memoir, “Misbehaving”:

Really, now, complaining about being ignored and mistreated is a bit unseemly for a Distinguished Service professor with a multiple-group low-teaching appointment at the very University of Chicago he derides, partner in an asset management company running $3 billion dollars, recipient of numerous awards including AEA vice president, and so on.

The AEA is the American Economic Association, of which Thaler soon afterward became president. Now, of course, Cochrane could add Nobel Prize to that list. Unlike a true-blue revolutionary, then, Dick Thaler is not spending his latter years muttering away in an unheated garret. So disappointing!

But also so intriguing…. Thaler’s career offers useful pointers on how to bring meaningful change to a large, dispersed organization while not getting thrown out of it…. Key themes…. Use humor…. Find allies outside the organization…. Build an infrastructure…. Stay respectable….

It’s always the students who matter most. Thaler told me in 2015 that “I don’t think I’ve changed a single person’s mind in 40 years.” But generations of graduate students have now come of age in an economics profession where behavioral research is, if still not central, perfectly respectable. That’s the change that Thaler has brought. It’s not a revolution, but it is something.

Should-Read: Michael Strain: Republicans, It’s Way Past Time for a Real Tax Plan – Bloomberg

Should-Read: Does Michael Strain really believe that the Trump Administration and the Congressional Republican caucus have mistakenly fuzzed the “details” of their tax plan? They have deliberately fuzzed the “details” because they have calculated that their plan is more popular with the details fuzzed. Saying exactly what you want to do is not a way to keep critics from assuming “the worst” if your intentions are in fact “the worst”—and if the goal is to keep the professional centrists from saying: “yep: the critics are right”. Michael Strain wants his party to play policy ball. But his party wants to play Calvinball.

And, of course, his blithe assumption that they really want to play policy ball is a form of meta-Calvinball itself:

Michael Strain: Republicans, It’s Way Past Time for a Real Tax Plan: “The way to keep critics from assuming the worst about your intentions is to say exactly what you want to do…”

Should-Read: Paul Krugman: Rationality and Rabbit Holes

Should-Read: I think Paul Krugman gets this one wrong because he fails to distinguish between two versions of the Efficient Financial Markets Hypothesis. The first version, which is right, is that “asset price movements are unpredictable, that patterns are subtle, unstable, and hard to make money off of”. The second version, which is wrong, is that financial markets are optional aggregators of information that get prices right. The first has done good. The second has done a lot of harm. Distinguish!

Paul Krugman: Rationality and Rabbit Holes: “Like the vast majority of economists, I was delighted to see Richard Thaler get the Nobel…

…The assumption of hyperrationality still plays far too large a role in the field. And Thaler didn’t just document deviations from rationality, he showed that there are consistent, usable patterns in those deviations…. One [camp] says that imperfect rationality changes everything; the other that the assumption of rationality is still the best game out there, or at least sets a baseline from which departures must be justified at length. Which camp is right?… Let me talk about two fields I know reasonably well: macroeconomics, which I think I know pretty well, and finance, where I am much less well-informed in general but am pretty familiar with at least some international areas. What strikes me is that vaguely Thalerish reasoning is hugely important in one, in the other not so much.

Let me state two propositions derived from the proposition that people are perfectly rational:

  1. Rational investors will build all available information into asset prices, so movements in these prices will be driven only by unanticipated events – that is, they’ll follow a random walk, with no patterns you can exploit to make money.
  2. Rational wage- and price-setters will take all available information into account when setting labor and goods prices, implying that demand shocks will have real effects only if they’re unanticipated – in particular, that monetary policy “works” only if it’s a surprise, and can’t play a stabilizing role.

Now, (1) is basically efficient markets theory, which we know is wrong in detail – there are lots of anomalies. In international finance, for example, there is the well-known uncovered interest parity puzzle: differences in national interest rates should be unbiased predictors of future changes in exchange rates, but in fact turn out to have no predictive power at all. And anyone who believed that rationality of investors precluded the possibility of massive, obvious mispricing – say, of subprime-backed securities – has not had a happy decade. Yet the broader proposition that asset price movements are unpredictable, that patterns are subtle, unstable, and hard to make money off of, seems to be right. On the whole, it seems to me that considering the implications of rational behavior has done more good than harm to the field of finance.

What about (2)?… Robert Lucas… took the whole field down a rabbit hole…. Everything we know suggests that there is a lot of nominal downward rigidity and a lot of money illusion in general. And assertions that this might be true in practice, but can’t be true in theory, and must therefore be assumed away both in research and in policy have been hugely destructive…

The forces behind the highly unequal U.S. wealth distribution

People line up at a food pantry at Sacred Heart Community Service in San Jose, CA.

The Federal Reserve’s Survey of Consumer Finances release last week reported that 38.6 percent of wealth in the United States was owned by the top 1 percent of families in 2016. The wealth distribution in the United States has always been incredibly skewed toward the wealthiest, with the share going to the top 1 percent moving up from 36.3 percent in 2013. Mathematical models of wealth distributions, however, have had a hard time accounting precisely for this “fat right tail” at the top of the U.S. wealth distribution. What key factors explain this continuing concentration of wealth?

Two papers released today as part of the Equitable Growth Working Paper series give us some guidance on the forces that have led to such an unequal wealth distribution in the United States. The first of the two papers, by Jess Benhabib and Alberto Bisin of New York University, gives an overview of previous research looking at the causes of wealth inequality. These mathematical and macroeconomic models have, in the past, fallen short of recreating the distributions of wealth we actually see in the world. The problem is that they fail to identify the high concentration of wealth among the very wealthy.

Benhabib and Bisin highlight three broad mechanisms or explanations that have been the focus of previous research and consider how much they could help explain this “fat tail” of wealth concentrated at the right side of distributional graph. The first mechanism deals with income inequality and how that arises from shocks to individuals’ earnings. The second is related to capital income risk, or differences in the rate of return on investments at different levels of wealth. The third factor is “explosive” wealth accumulation, asking whether or not savings rates differ across the wealth or income distributions. Regarding the first mechanism, the authors steer us away from high levels of income inequality as a major driving force behind wealth inequality, as the distribution of wealth is far more unequal than the distribution of income across the U.S. population. The other two factors, as the second paper shows, are more likely to explain the level of wealth inequality.

The second paper, by Benhabib, Bisin, and Mi Luo (also of NYU), is an attempt to parse out the influences of these three factors on U.S. wealth distribution. Using data from the Survey of Consumer Finances, as well as mobility data from previous research, the three economists use a model of consumption to recreate the wealth distribution. By varying the parameters in the model that account for income shocks and differences in returns and savings rates, the authors tease out the importance of each factor.

They find, in short, that differences in the rate of return on capital and in savings rates are the main factors explaining the distribution of wealth in the United States. As suggested by the first paper, the differences in income caused by shocks don’t explain much—though shocks do contribute significantly to mobility up and down the rungs of the wealth ladder.

The differences in savings rates—documented elsewhere in research by University of California, Berkeley economists Emmanuel Saez and Gabriel Zucman—are motivated by a desire to pass wealth down to children. If this is true, then an inheritance tax may do quite a bit to reduce wealth inequality. Citing other research on differences in returns on capital, the authors note that the variances in returns are high for housing, business ownership, and private equity investments. The role of housing may be key in explaining the differences in wealth, not only among the entire population but between racial groups as well.

While the rise of income inequality has inspired a great deal of research on its causes, the economic literature on wealth inequality is relatively sparse. The new findings in these papers are an important guide for future research in this area. Understanding why wealth inequality is so high may very well help us understand its effects on our economy.

Post-racial rhetoric, racial health disparities, and health disparity consequences of stigma, stress, and racism

Download File
10102017-WP-racial-health-disparities

Read the full PDF in your browser

Author:

Darrick Hamilton, Associate Professor of Economics and Urban Policy, The New School


Abstract:

We explore the paradox of why high achieving black Americans, as measured by education, still exhibit large health disparities. We discuss how the post-racial, politics of personal responsibility and “neoliberal paternalism” troupes discourage a public responsibility for the conditions of the poor and black Americans, and, instead, encourage punitive measures to “manage…surplus populations” of the poor and black Americans. We introduce an alternative frame and integrate it with John Henryism as a link to better understand the paradox above – the added efforts and stigma imposed upon high achieving blacks that threaten the relative position of the dominant white group translates in deleterious health for high achieving blacks. Ultimately, we explore how the potential physical and psychological costs of stigma and, ironically, exerting individual agency, which in the context of racist or stigmatized environment, may explain the limited role of education and income as protective health factors for blacks relative to whites.